The GNU Debugger (GDB), a popular free and open source tool for C and C++ programmers, offers a Text User Interface (TUI) to split the console into multiple windows and display different content in each window. One window will always be a command window, in which you enter the usual GDB commands, but you might also have a source code window, a register contents window, or a disassembly window. Since GDB 11, you can use a Python API to add new window types. This API can be incredibly useful, allowing you to customize GDB to visualize your application's data in new ways.
Note: The Python API for adding TUI windows was actually added to GDB 10. Unfortunately, prior to GDB 11, the gdb.TuiWindow.write call had some bugs that were not resolved until GDB 11.
In this article, the first in a two-part series, you'll learn how to create a window and load it with dynamic content. The real power of the TUI will be shown in the second article, which shows how to display useful information from GDB.
Why use the GDB Text User Interface?
Imagine you are debugging a system containing a cache. You could create a custom window that shows you, at a glance, what is mapped into each cache entry. Or if your system generates an event or activity log, you could set up a window that shows the most recent entries from that log. All of these things could be done in a pure command-line environment, but by creating a custom TUI window, you can view the information on the screen all of the time, making it much easier to spot problems, and so fix bugs more quickly.
For this two-part tutorial, you'll create a new window that just displays GDB's value history. However, once you've finished, you should have the skills needed to adapt this example to display any data you want, including unique views into your application.
Your first window
Start by creating the simplest working window possible. Create an empty file named history.py and then add this content:
class history_window:
    def __init__(self, tui_window):
        self._tui_window = tui_window
        self._tui_window.title = 'Value History'

gdb.register_window_type('history', history_window)
The function gdb.register_window_type is how you alert GDB to your new window type. The first argument is a string giving the name of the new window (history, in the example). The second argument is a factory method that GDB will call when it needs to create an instance of the history window.
The factory method is passed an object of type gdb.TuiWindow, and should return a brand new object of any type that represents your custom window.
The example uses the history_window class constructor as the factory method. The tui_window argument is of type gdb.TuiWindow and is passed from GDB. The class stores tui_window into the new instance to be used later on for writing into the window. But for now, all the class does is use the object to set the title of the window to Value History.
Now get GDB to display the new window. Start GDB, and enter this command to load and run your Python script, registering the new window type with GDB:
(gdb) source history.py
Use the tui new-layout command to create a new layout:
(gdb) tui new-layout example_1 history 1 cmd 1 status 1
A layout is just a collection of windows that are displayed together. GDB has several built-in layouts, but you just created a new one called example_1.
The remaining arguments to tui new-layout define the windows you will add to this layout. The number after each window is the relative weight of that window in the layout. The weight is a guide to GDB for how much terminal space to allocate to each window. The weight is only a guide, though. Some windows, such as status, have a maximum size. Other windows, such as cmd and history, can be any size. GDB considers all of these constraints and sizes each window appropriately.
Finally, tell GDB to activate TUI mode and use your new layout:
(gdb) layout example_1
If everything has worked, your GDB terminal should now look like Figure 1.
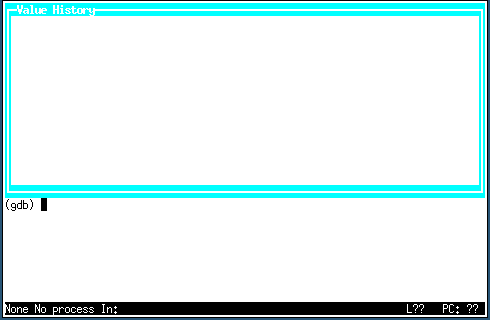
That's not very exciting. Your history_window window, displayed at the top part of the terminal, shows the Value History title, but otherwise, the new window remains blank.
Adding content to the window
The next task is to generate some content in your window. Every time GDB needs to redraw the window contents, it calls the render method on the window object. We didn't implement this method initially. If the method doesn't exist, GDB doesn't try to call it, and just leaves the window blank.
So now, add the following render method to your history_window class:
    def render(self):
        self._tui_window.erase()
        self._tui_window.write('Hello World\n')
        self._tui_window.write('Two\nLines\n')
        self._tui_window.write('abc'*2000000)
Restart GDB and reload your history.py script. Rather than retyping the commands into your GDB session, you can pass the commands to GDB from the command line like this:
gdb -ex 'source history.py' \
    -ex 'tui new-layout example_1 history 1 cmd 1 status 1' \
    -ex 'layout example_1'
GDB should start and immediately switch to TUI mode. The terminal should look like Figure 2.

Note how the very long line of repeated abc characters wraps at the right side of the window, but is cut off at the bottom of the window. The way GDB fits content into windows is important to keep in mind when you start laying out real content.
Spotting new history items
To display every value from GDB's history list, you need some way to spot when new values are added to the history list. GDB doesn't have a Python event that notifies you when values are added to the history list, but there is an event that notifies you when GDB is about to display a new prompt. So you need to catch this event, called before_prompt, then fetch any new values from the history list and add them to your window content.
Start by adding code to catch the before_prompt event to your history_window class. Add the following two lines to the history_window class, in the __init__ method:
        self._before_prompt_listener = lambda : self._before_prompt()
        gdb.events.before_prompt.connect(self._before_prompt_listener)
This code creates a new lambda function stored in _before_prompt_listener. This is the callback function for the event. The next line calls gdb.events.before_prompt.connect to register this callback with GDB. Now, every time GDB displays a prompt, it will first call this function.
The callback function forwards the call to the _before_prompt method of your history_window class. You haven't written that yet, but you will shortly. Before you do, though, let's go back and rework our render method to make it a little more useful. First, add the following line to the __init__ method:
self._lines = []
This list will contain all of the lines for our window.
Now replace the existing render method with a new one, which displays the content out of your newly created _lines variable:
    def render(self):
        height = self._tui_window.height
        width = self._tui_window.width
        lines = self._lines[-height:]
        self._tui_window.erase()
        for l in lines:
            if len(l) < width:
                l += "\n"
            else:
                l = l[0:width]
            self._tui_window.write(l)
The first two lines of this method read the height and width from the gdb.TuiWindow object. These values can change every time the render method is called, because GDB might have resized the window.
The third line of the function uses the height to select the last few lines from the list of all content lines.
Next, erase clears the window contents. The function then loops through all the lines to display. If the line is shorter than the screen width, the if statement adds a newline. Otherwise, the else statement trims the line to exactly the screen width. Finally, the function calls write to add the line to the screen.
The last thing you need to do is write the _before_prompt method:
    def _before_prompt(self):
        self._lines.append('The GDB prompt has been displayed. Good Job!')
        self.render()
This method adds content to the _lines variable, which your render method can then display.
Restart GDB using this command line:
gdb -ex 'source history.py' \
    -ex 'tui new-layout example_1 history 1 cmd 1 status 1' \
    -ex 'layout example_1'
With luck, your debugger should look something like Figure 3.
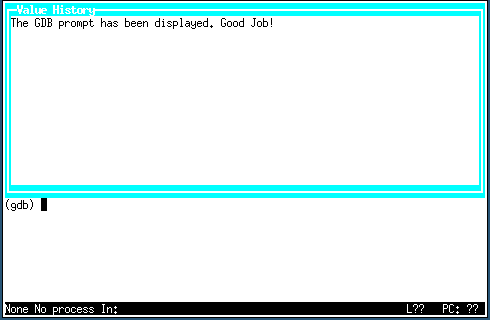
If you press the Return key a few times, you should start to see the window fill with text. Next, if you reduce the width of your terminal, you should see the text truncated to the new width (Figure 4).

Excellent. You are almost ready to replace the placeholder strings you've been using with the actual history values into the window, which the second article in this series accomplishes.
Oh, no—a bug
Start GDB and load your window, just as before. But this time, switch away from your new layout to a layout that doesn't use your custom window. The full set of GDB commands for this task are:
$ gdb
(gdb) source history.py
(gdb) tui new-layout example_1 history 1 cmd 1 status 1
(gdb) layout example_1
(gdb) layout src
You should see this error message from GDB in the terminal:
Python Exception <class 'RuntimeError'>: TUI window is invalid.
The problem is that, once GDB is no longer displaying your history window, the gdb.TuiWindow that represents it is invalidated and can no longer be used to write to the screen. However, your before_prompt event handler is still registered and continues to call render, which will try to write to the screen using the gdb.TuiWindow object.
To remove this message, you need to disconnect the event listener when your history_window is being removed from the screen. This task is easily done by adding the close method to your history_window class, like this:
    def close(self):
        gdb.events.before_prompt.disconnect(self._before_prompt_listener)
Now, when switching from the example_1 layout to the src layout, you no longer get an error.
Conclusion
This article got you started with displaying content dynamically in a GDB window. The next article in this series will show you how to display useful information by retrieving the values from GDB's history list.
Last updated: November 6, 2023