Redhat Developers  Logo
  • AI

    Get started with AI

    • Red Hat AI
      Accelerate the development and deployment of enterprise AI solutions.
    • AI learning hub
      Explore learning materials and tools, organized by task.
    • AI interactive demos
      Click through scenarios with Red Hat AI, including training LLMs and more.
    • AI/ML learning paths
      Expand your OpenShift AI knowledge using these learning resources.
    • AI quickstarts
      Focused AI use cases designed for fast deployment on Red Hat AI platforms.
    • No-cost AI training
      Foundational Red Hat AI training.

    Featured resources

    • OpenShift AI learning
    • Open source AI for developers
    • AI product application development
    • Open source-powered AI/ML for hybrid cloud
    • AI and Node.js cheat sheet

    Red Hat AI Factory with NVIDIA

    • Red Hat AI Factory with NVIDIA is a co-engineered, enterprise-grade AI solution for building, deploying, and managing AI at scale across hybrid cloud environments.
    • Explore the solution
  • Learn

    Self-guided

    • Documentation
      Find answers, get step-by-step guidance, and learn how to use Red Hat products.
    • Learning paths
      Explore curated walkthroughs for common development tasks.
    • Guided learning
      Receive custom learning paths powered by our AI assistant.
    • See all learning

    Hands-on

    • Developer Sandbox
      Spin up Red Hat's products and technologies without setup or configuration.
    • Interactive labs
      Learn by doing in these hands-on, browser-based experiences.
    • Interactive demos
      Click through product features in these guided tours.

    Browse by topic

    • AI/ML
    • Automation
    • Java
    • Kubernetes
    • Linux
    • See all topics

    Training & certifications

    • Courses and exams
    • Certifications
    • Skills assessments
    • Red Hat Academy
    • Learning subscription
    • Explore training
  • Build

    Get started

    • Red Hat build of Podman Desktop
      A downloadable, local development hub to experiment with our products and builds.
    • Developer Sandbox
      Spin up Red Hat's products and technologies without setup or configuration.

    Download products

    • Access product downloads to start building and testing right away.
    • Red Hat Enterprise Linux
    • Red Hat AI
    • Red Hat OpenShift
    • Red Hat Ansible Automation Platform
    • See all products

    Featured

    • Red Hat build of OpenJDK
    • Red Hat JBoss Enterprise Application Platform
    • Red Hat OpenShift Dev Spaces
    • Red Hat Developer Toolset

    References

    • E-books
    • Documentation
    • Cheat sheets
    • Architecture center
  • Community

    Get involved

    • Events
    • Live AI events
    • Red Hat Summit
    • Red Hat Accelerators
    • Community discussions

    Follow along

    • Articles & blogs
    • Developer newsletter
    • Videos
    • Github

    Get help

    • Customer service
    • Customer support
    • Regional contacts
    • Find a partner

    Join the Red Hat Developer program

    • Download Red Hat products and project builds, access support documentation, learning content, and more.
    • Explore the benefits

Node.js serverless functions on Red Hat OpenShift, Part 3: Debugging on a cluster

December 8, 2021
Lucas Holmquist
Related topics:
ContainersKubernetesNode.jsServerless
Related products:
Red Hat OpenShiftRed Hat OpenShift Container Platform

    This article is the third in a series about running Node.js applications in containers in an orchestration environment such as Kubernetes or Red Hat OpenShift. The first article focused on control over logging, and the second article on debugging JavaScript programs on your local system. This time, we'll look at how to use the Chrome DevTools inspector to debug a Node.js function that is running inside a container on an OpenShift cluster.

    Prerequisites

    To follow along, you will need an OpenShift cluster with the Serverless Operator installed. See the article, Create your first serverless function with Red Hat OpenShift Serverless Functions to set up this environment.  

    If you need an Openshift cluster to play around with that already has the serverless operators installed and setup, you can easily create an instance of the Openshift Sandbox.  This post won’t go into setting up the sandbox, but  the process is fairly straightforward.

    This article also assumes some familiarity with the Chrome DevTools inspector. For an introduction, please see How to debug your Node.js application on OpenShift with Chrome DevTools.

    Get the example code

    The example that we are going to use can be retrieved from the Node.js HTTP function repository on GitHub. Similar to the example used in our previous article, this function application was scaffolded with the kn-func command-line tool, which we described in that article.

    We'll have to make a few changes before using the code for this article. To start, note that the package.json file for this example defines three scripts:

    "scripts": {
    
        "test": "node test/unit.js && node test/integration.js",
    
        "start": "faas-js-runtime ./index.js",
    
        "debug": "nodemon --inspect ./node_modules/faas-js-runtime/bin/cli.js ./index.js"
    
      }

    These scripts are similar to the ones in the previous article, and we will make the same changes here that we did previously.

    First, simply switch the debug script with the start script. We make this change because the kn-func command can’t specify which script to run. You can name the start script whatever you like.

    Next, make a simple change to the start script. You need to tell it to listen on all available addresses because you are running as localhost (IP address 127.0.0.1) inside the container, which the debugger can’t access by default. Therefore, change the --inspect option in the start script to --inspect=0.0.0.0.

    These changes should produce scripts similar to the following:

    "scripts": {
    
        "test": "node test/unit.js && node test/integration.js",
    
        "debug": "faas-js-runtime ./index.js",
    
        "start": "nodemon --inspect=0.0.0.0 ./node_modules/faas-js-runtime/bin/cli.js ./index.js"
    
      }

    Debugging Node.js functions in a container

    Now, create a container using the kn-func build command. If this is the first time you are building the application, the command prompts you to add a registry and namespace for the containerized function. By default, the registry is Docker Hub. For the namespace, enter your Docker Hub ID.

    Once the image is built, use the docker command to run the container and start debugging your Node.js functions. Since the debugger listens on port 9229, you need to expose that port as well as port 8080, which is the port to access your application:

    $ docker run --rm  -p 8080:8080 -p 9229:9229 lholmquist/debugging-with-functions-on-cluster:latest

    The output should be similar to:

    Debugger listening on ws://0.0.0.0:9229/584eb679-4db1-4a40-9519-5bf5c42275f5
    
    For help, see: https://nodejs.org/en/docs/inspector
    
    The server has started. http://localhost:8080

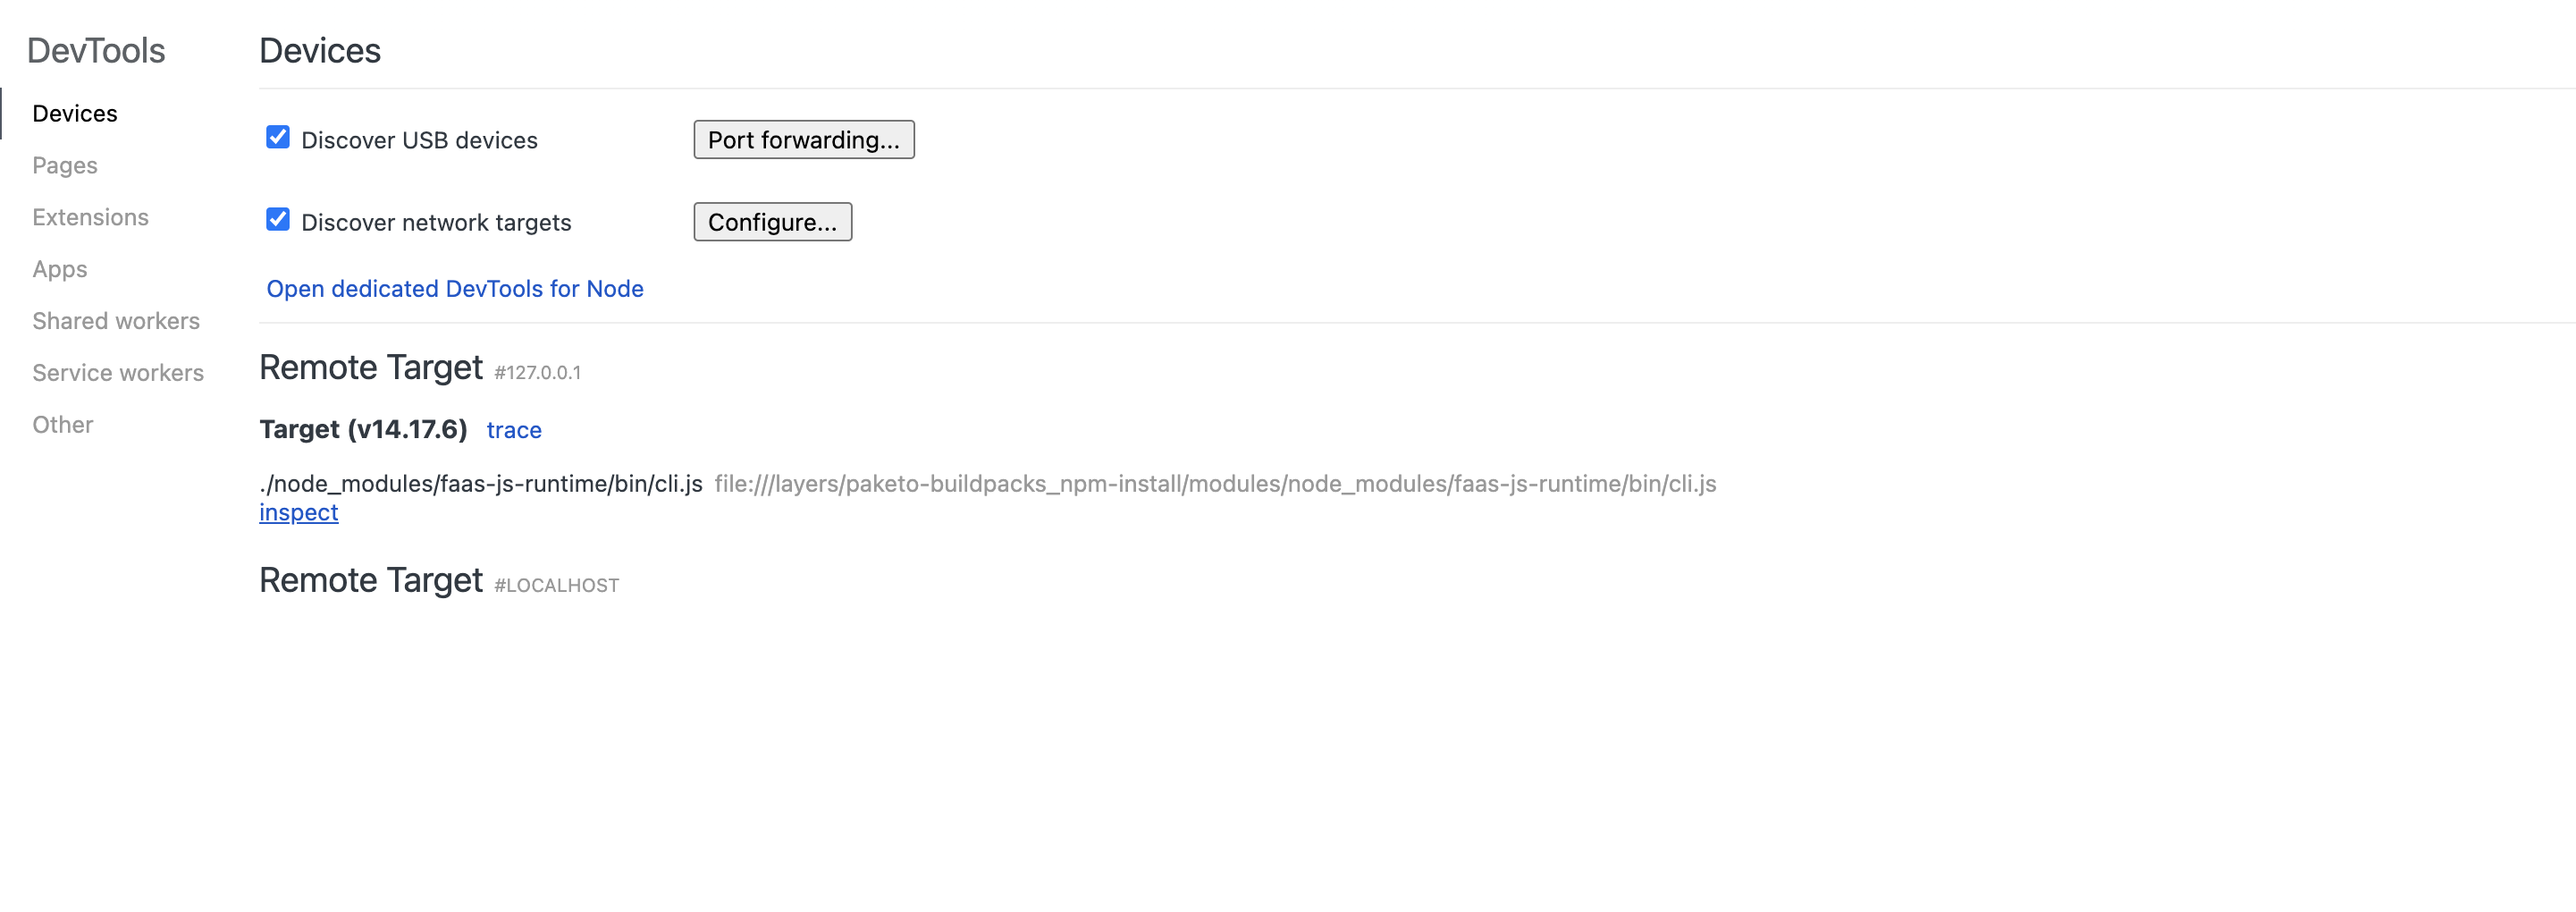
    Now that the container is running, you can open Chrome DevTools and navigate to the chrome://inspect URL, where you should see a link labeled inspect (Figure 1). Click this link to connect to your running container.

    The Chrome inspector offers an inspection link to let you view and debug your program.
    Figure 1. Use the Chrome inspector to view and debug your program.

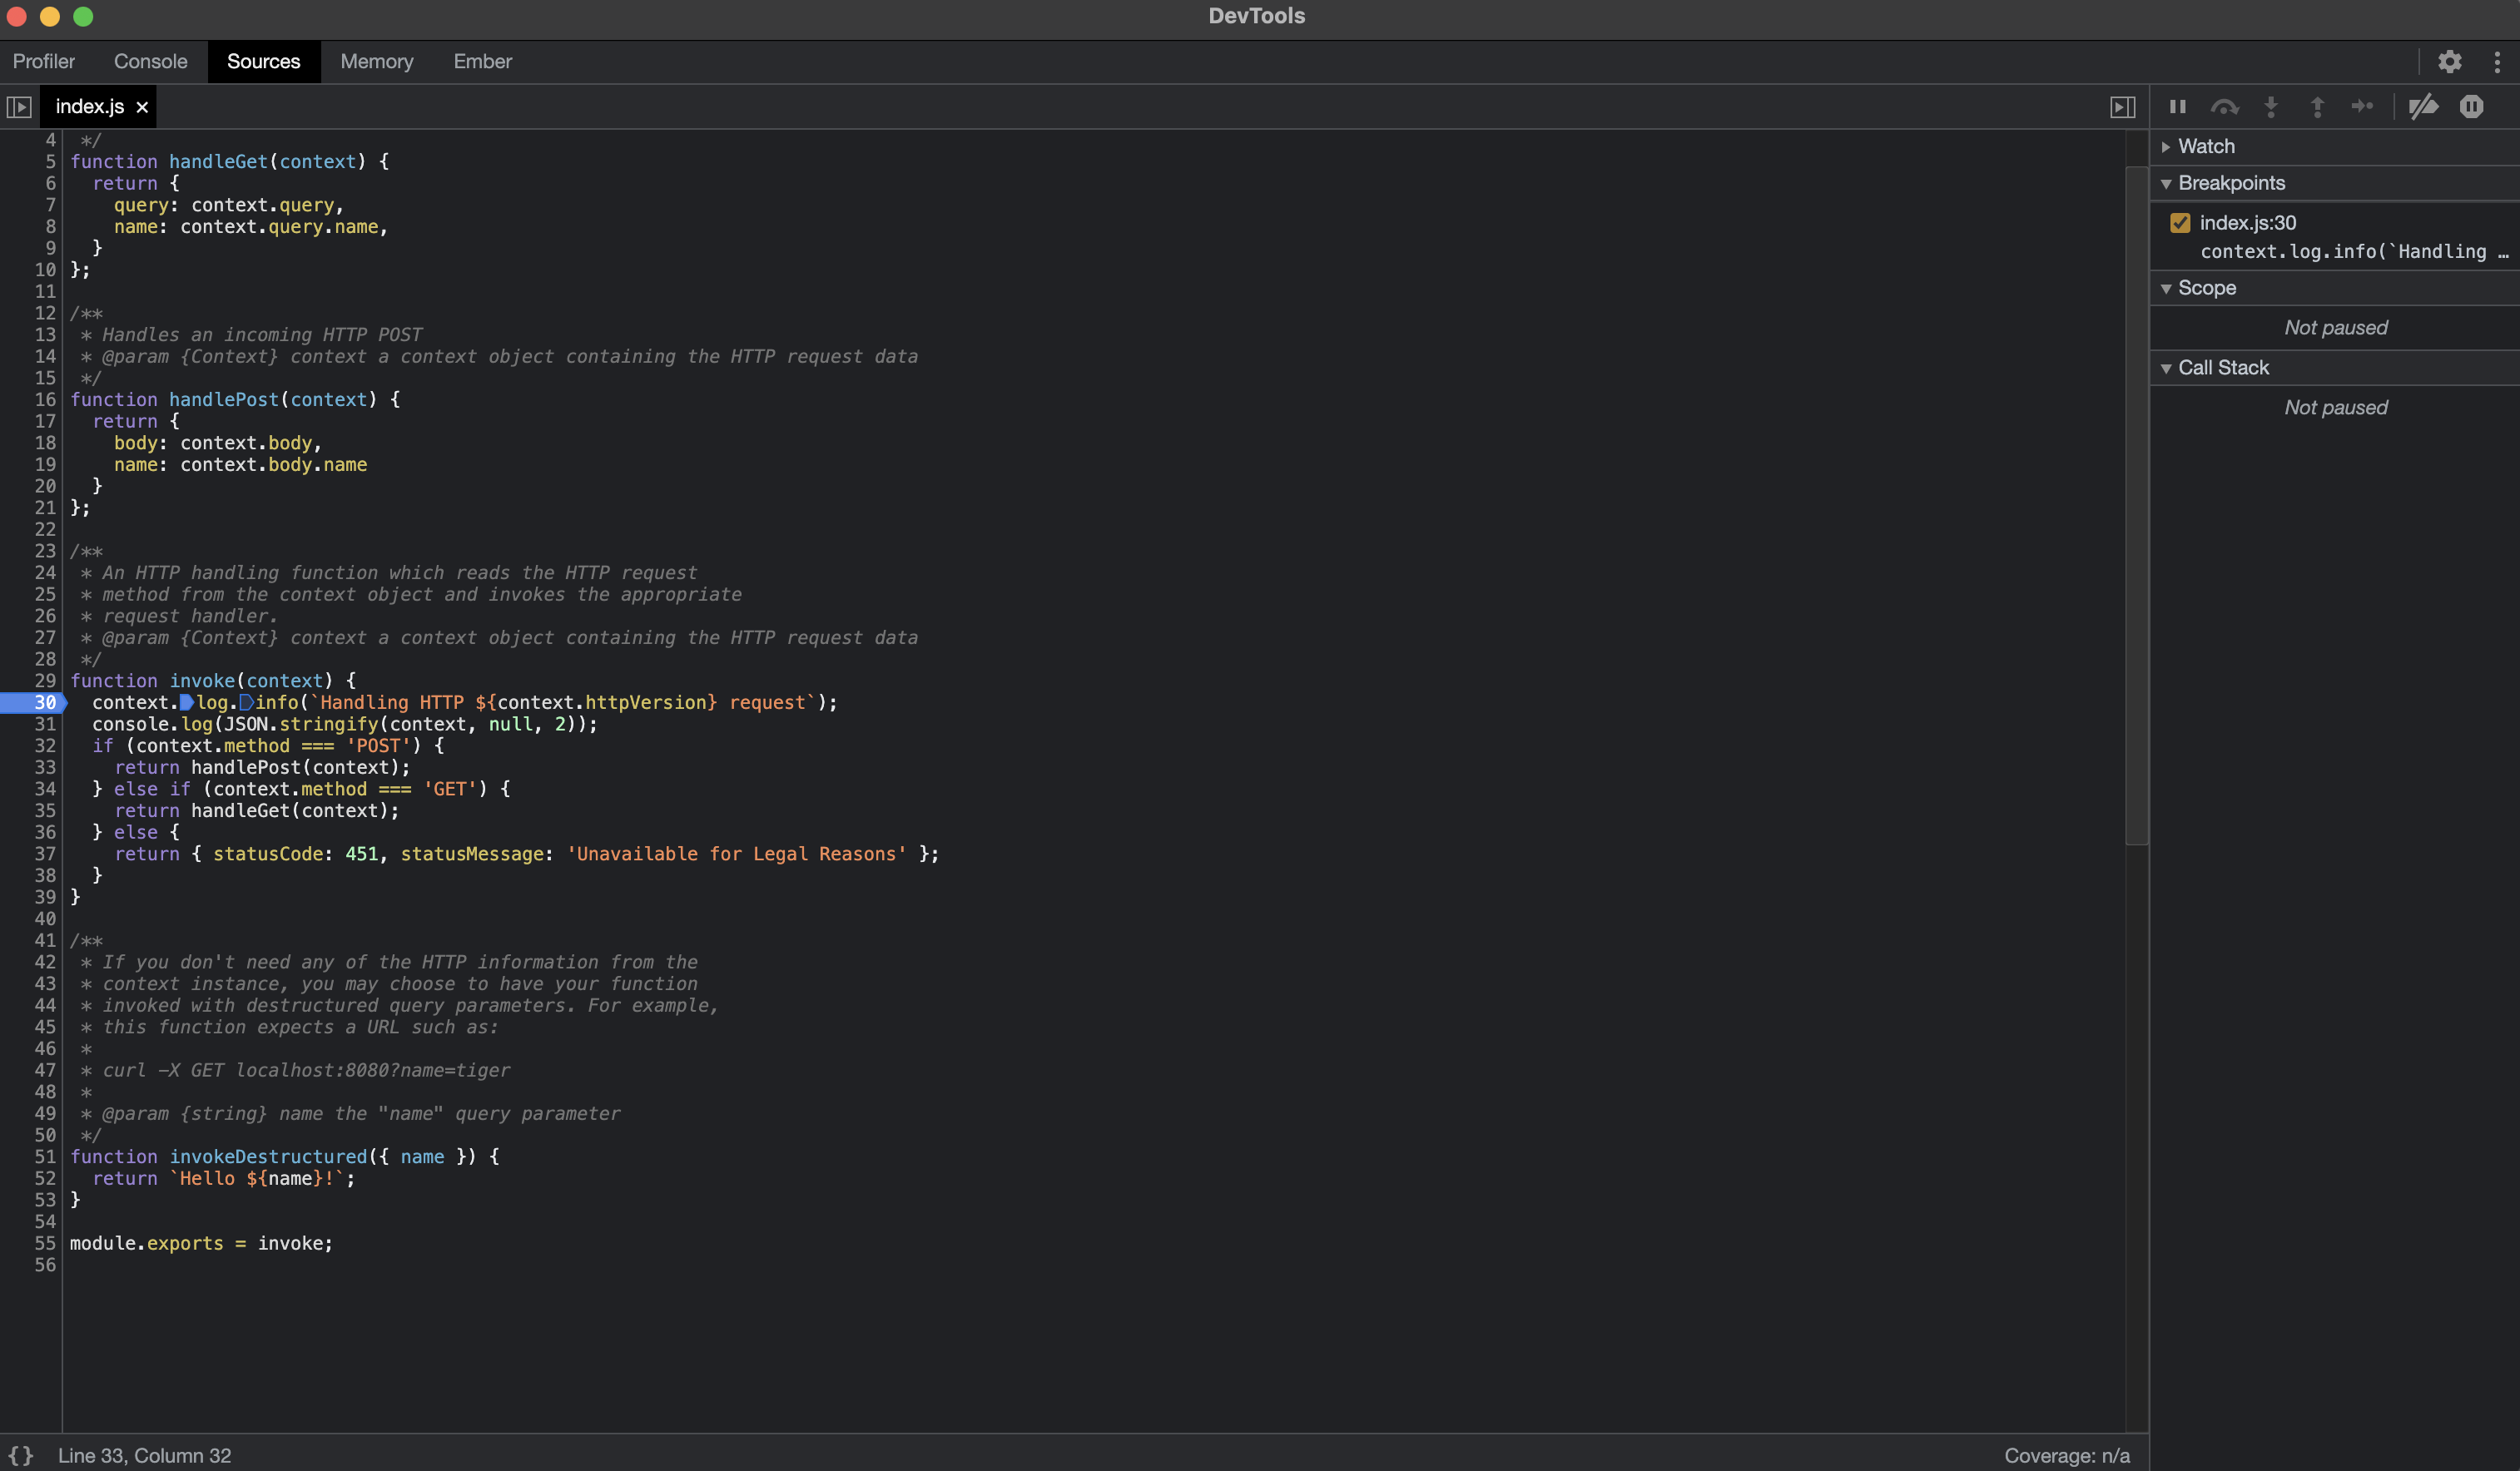
    Now you should see the Chrome inspector, showing code similar to Figure 2.

    The Chrome inspector shows the code of your application and allows you to set breakpoints.
    Figure 2. Use the Chrome inspector to set breakpoints.

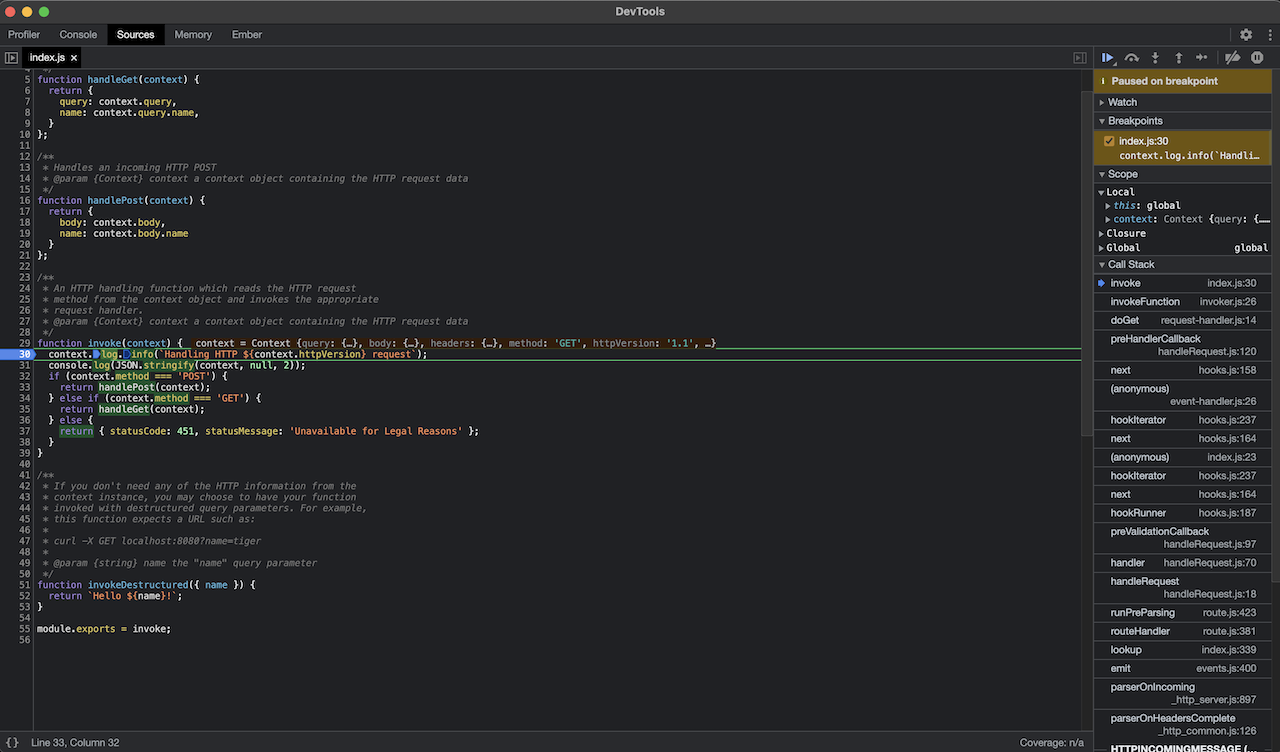
    Set a breakpoint at some point in the program, then navigate to http://localhost:8080 to run the application. The inspector stops at the breakpoint shown in Figure 3, allowing you to inspect variables and do other debugging tasks.

    The program shows the breakpoint where it stopped.
    Figure 3. The program shows the breakpoint where it stopped.

    Debugging Node.js functions on an OpenShift cluster

    Having debugged your program in your container, you can use a similar process to debug it on an OpenShift cluster. Make the same changes in the npm scripts and use the same command to build the container. To deploy the container to the cluster, use the kn-func command:

    $ kn-func deploy

    Once the container is deployed, navigate to the topology view in the OpenShift console, which should show you something like Figure 4.

    The topology view of a function deployed in OpenShift shows an icon you can click to run the function.
    Figure 4. Deploy the function from the OpenShift topology view.

    Clicking the icon on the top-right corner of the function's box navigates to the application's route. You should then see the JSON output that the function sends when invoked.

    To start debugging, you need the help of the oc port-forward command. This command was described in the article How to debug your Node.js application on OpenShift with Chrome DevTools, so I won't explain here what each part of the command does. For this example, your command should look something like this:

    $ oc port-forward $(oc get po | grep debugging-with-functions | grep Running | awk '{print $1}') 8888:9229

    The command should start forwarding requests to the debugger process. If it is successful, you'll see log messages similar to these:

    Forwarding from 127.0.0.1:8888 -> 9229
    Forwarding from [::1]:8888 -> 9229
    Handling connection for 8888
    Handling connection for 8888

    With forwarding enabled, navigate again in your browser to the chrome://inspect URL and you should see something similar to Figure 5.

    The "inspect" link in Chrome inspector also allows you to debug on a cluster.
    Figure 5. The "inspect" link in Chrome inspector also allows you to debug on a cluster.

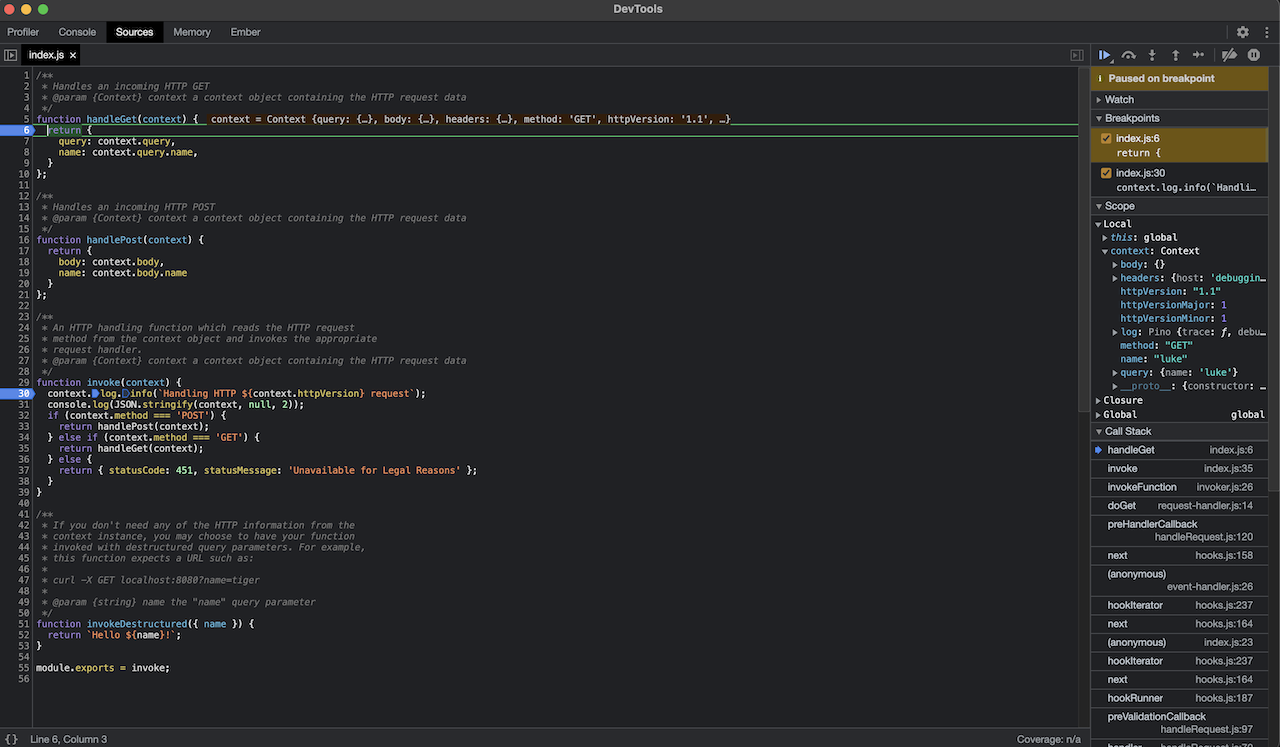
    As in the previous example with the container, clicking the inspect link should show the debugger. Again add a breakpoint, then navigate to the route that OpenShift provides to access the application. The debugger should break on the point you added, as shown in Figure 6.

    The program stops at the breakpoint in the cluster.
    Figure 6. The program stops at the breakpoint in the cluster.

    Conclusion

    This article showed how to debug a Node.js application while running inside a container, as well as running on an OpenShift cluster.

    Stay tuned for more posts related to running Node.js applications on Red Hat OpenShift Serverless. You can also check out the latest documentation at the About OpenShift Serverless Functions site.

    If you want to learn more about what Red Hat is up to on the Node.js front, check out our Node.js landing page.

    Last updated: January 12, 2024

    Related Posts

    • Node.js serverless functions on Red Hat OpenShift, Part 1: Logging

    • Node.js serverless functions on Red Hat OpenShift, Part 2: Debugging locally

    • How to Debug Your Node.js Application on OpenShift with Chrome DevTools

    • Create your first serverless function with Red Hat OpenShift Serverless Functions

    Recent Posts

    • Every layer counts: Defense in depth for AI agents with Red Hat AI

    • Fun in the RUN instruction: Why container builds with distroless images can surprise you

    • Trusted software factory: Building trust in the agentic AI era

    • Build a zero trust AI pipeline with OpenShift and RHEL CVMs

    • Red Hat Hardened Images: Top 5 benefits for software developers

    Red Hat Developers logo LinkedIn YouTube Twitter Facebook

    Platforms

    • Red Hat AI
    • Red Hat Enterprise Linux
    • Red Hat OpenShift
    • Red Hat Ansible Automation Platform
    • See all products

    Build

    • Developer Sandbox
    • Developer tools
    • Interactive tutorials
    • API catalog

    Quicklinks

    • Learning resources
    • E-books
    • Cheat sheets
    • Blog
    • Events
    • Newsletter

    Communicate

    • About us
    • Contact sales
    • Find a partner
    • Report a website issue
    • Site status dashboard
    • Report a security problem

    RED HAT DEVELOPER

    Build here. Go anywhere.

    We serve the builders. The problem solvers who create careers with code.

    Join us if you’re a developer, software engineer, web designer, front-end designer, UX designer, computer scientist, architect, tester, product manager, project manager or team lead.

    Sign me up

    Red Hat legal and privacy links

    • About Red Hat
    • Jobs
    • Events
    • Locations
    • Contact Red Hat
    • Red Hat Blog
    • Inclusion at Red Hat
    • Cool Stuff Store
    • Red Hat Summit
    © 2026 Red Hat

    Red Hat legal and privacy links

    • Privacy statement
    • Terms of use
    • All policies and guidelines
    • Digital accessibility

    Chat Support

    Please log in with your Red Hat account to access chat support.