(Edit: November 22, 2019) The Node images used in this post, both community centos7 and product, are no longer being updated and maintained. For community images, please use the Universal Base Image (UBI)-based node images located here: registry.access.redhat.com/ubi8/nodejs-10
For a fully supported Product version of Node.js, please check out the Red Hat Software Collections Node.js image, RH SCL Node.js.
Recently, I wrote a post called Zero to Express on OpenShift in Three Commands, which shows how to get started using Node.js, Express, and OpenShift together as fast as possible using the Node.js s2i (source-to-image) images that were recently released as part of Red Hat OpenShift Application Runtimes (RHOAR).
This post will add to the last one and show how we can start to debug and inspect our running code using the Chrome Developer Tools (DevTools) inspector.
Getting Started
As in the previous post, there are some required prerequisites. You need to have Node 8.x and npm 5.2 or greater installed. npm comes with the official node distribution, so if you install Node from Nodejs.org, you should be good.
You'll also need access to an OpenShift environment or the Red Hat Container Development Kit (CDK) minishift environment. For this example, I'll be using minishift. You can find instructions on getting minishift up and running here. For my local minishift, I start it with this command:
$ minishift start --memory=6144 --vm-driver virtualbox
And of course, you will need to have the Chrome browser installed. You can get that here.
First Steps
Before we start trying to debug our application on OpenShift, let's first go over how we do this locally. If you are already familiar with how this works, then feel free to skip to the next section.
Getting the Application
The app we created in the previous post was a generic app skeleton, so let's use something that is a little more useful. We are going to use the REST API Level 0 example, which is one of the boosters from RHOAR.
Clone the repo:
$ git clone https://github.com/bucharest-gold/nodejs-rest-http
Change to the directory:
$ cd nodejs-rest-http
Install the dependencies:
$ npm install
Run the application:
$ npm run start
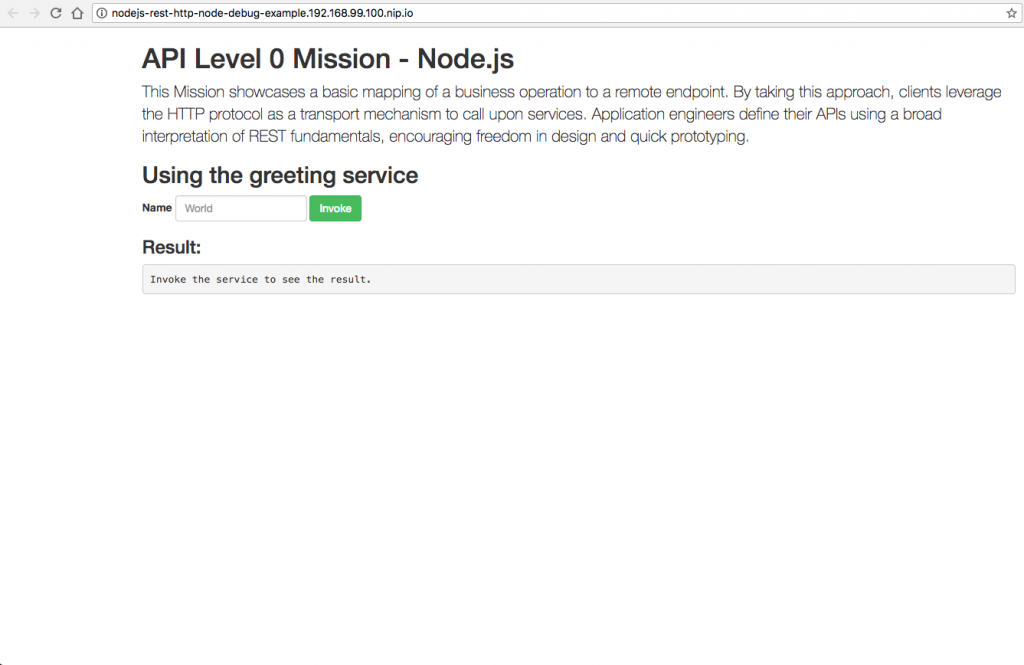
The application should then be running at localhost:8080 and look something like this:
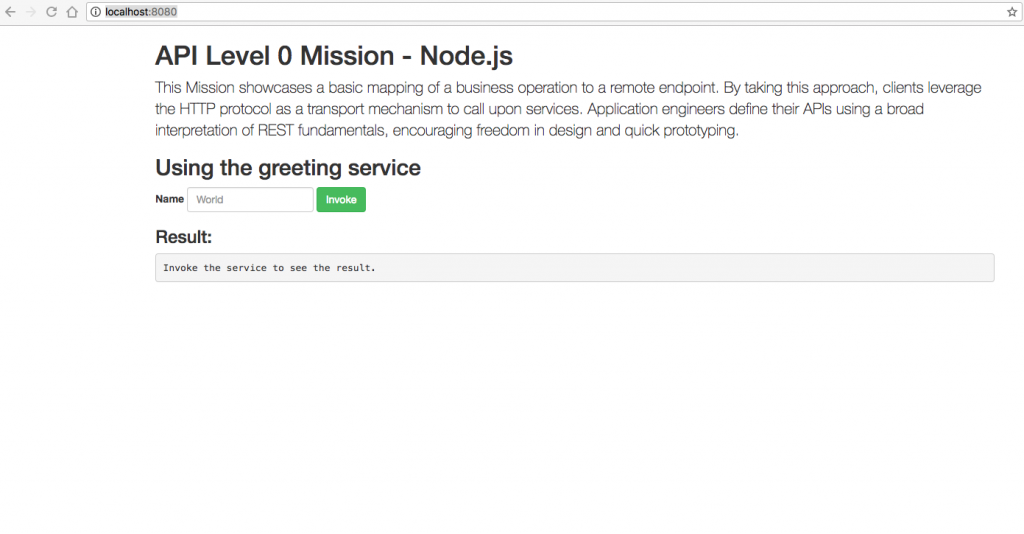
It is a pretty basic Hello World REST application.
Let's see what that npm run start is doing. In our package.json file, in the scripts section, we can see this:
// package.json
{
  "name": "nodejs-rest-http",
  ....
  "scripts": {
    ....
    "start": "node ."
  },
  "main": "./bin/www",
  ....
}
start just calls node and because there is also a main property, it will use that as the entry point.
So really, npm run start is the same as node ./bin/www.
Debugging Locally
Now let's start the application again, but this time we want to be able to inspect the code in Chrome DevTools.
This time, we are going to start the application like this:
$ node --inspect ./bin/www
After running that command, you should see something like this:
Debugger listening on ws://127.0.0.1:9229/9f332ec3-f7e9-4558-a67d-3ef8d13947cc
For help, see: https://nodejs.org/en/docs/inspector
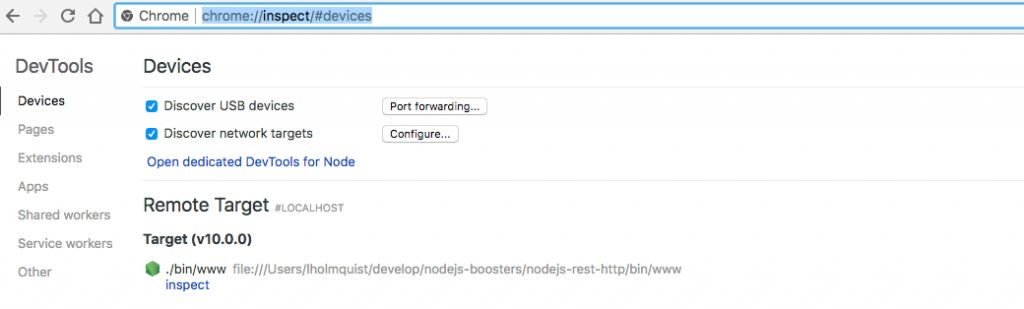
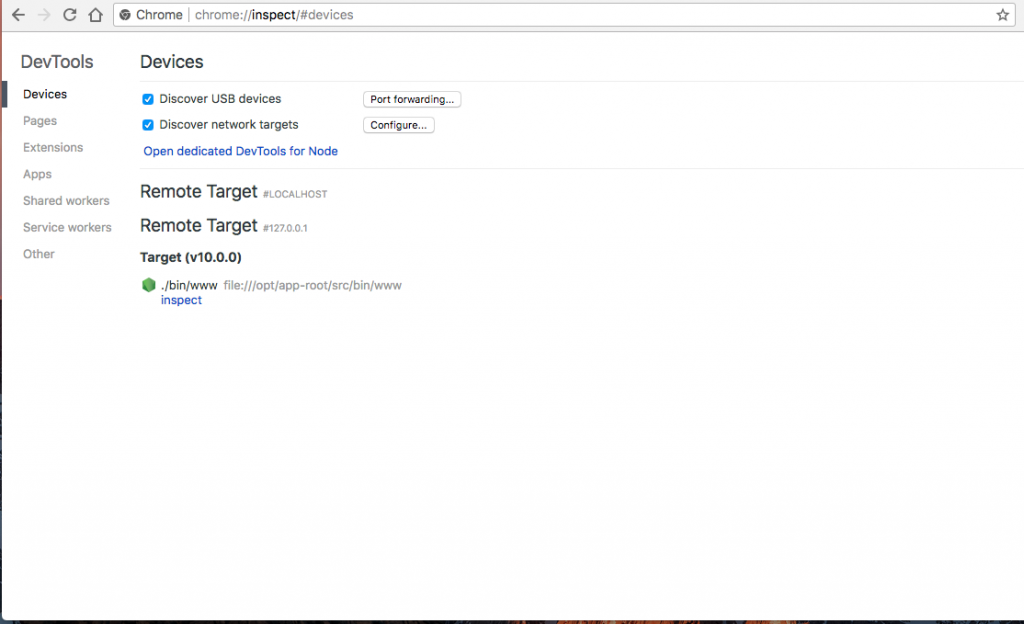
Now, open Chrome and type chrome://inspect into the address bar. You should see something similar to this:
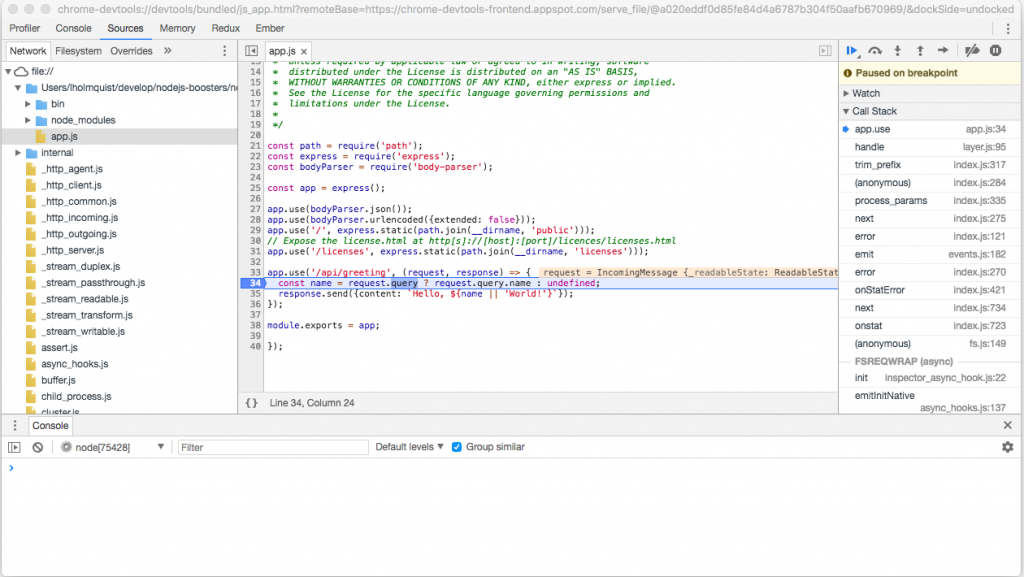
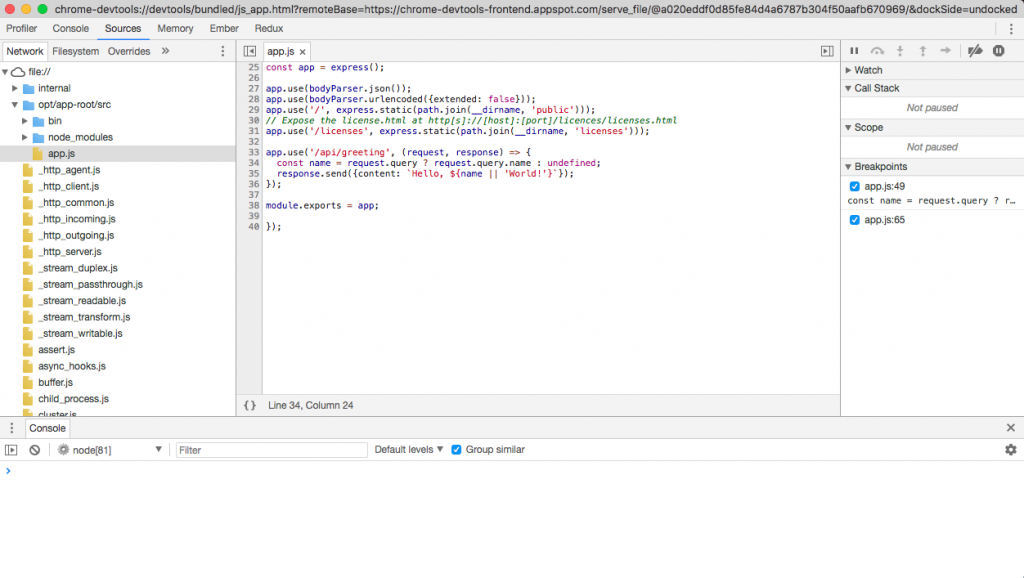
Then click the inspect link, which will open up the Chrome DevTools window. It will look something like this:
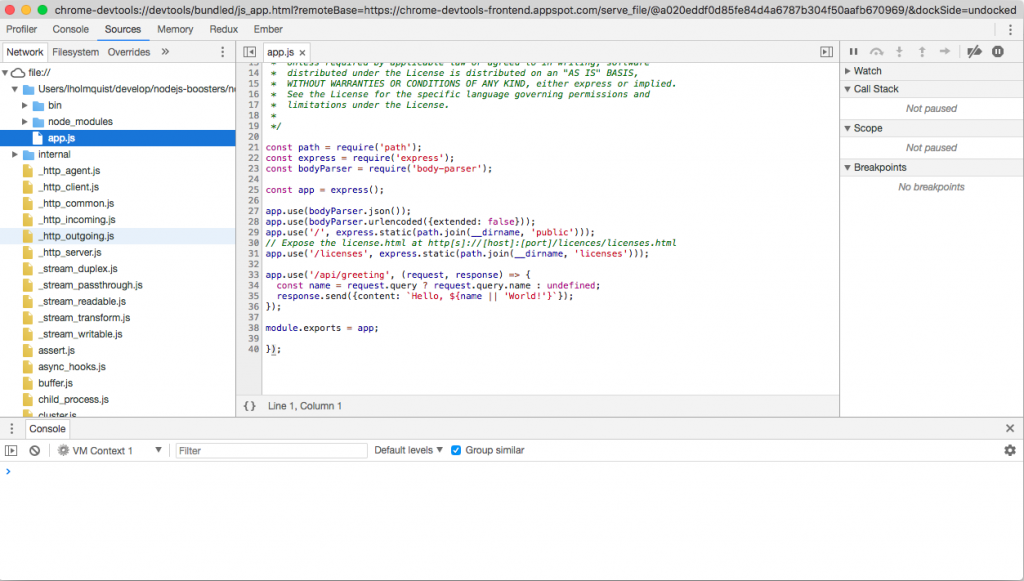
We can see there are many files we can access. We don't really need to worry about those, because those files are loaded when the node process starts. We are interested in the app.js file.
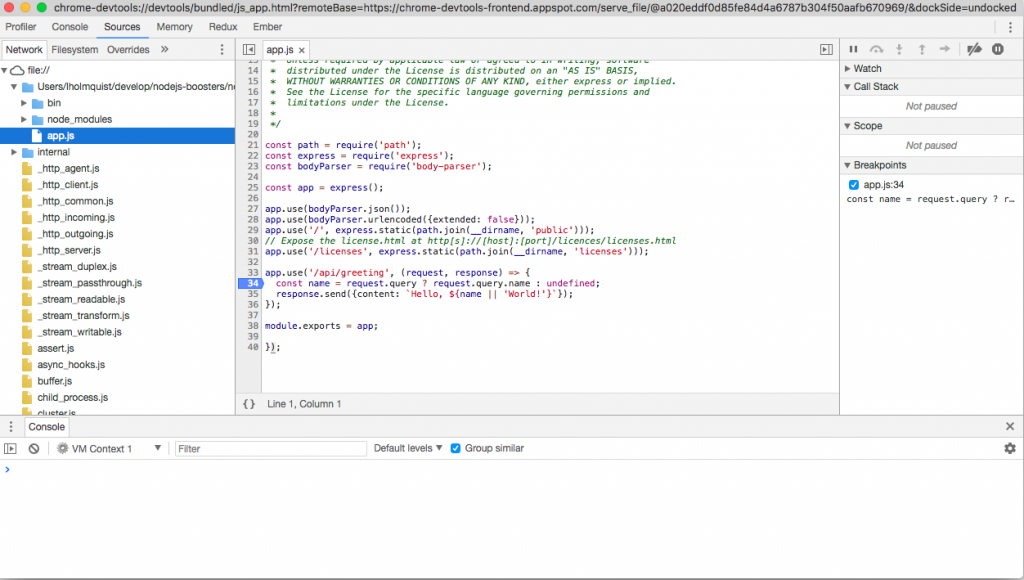
Let's set a break point so we can inspect the REST API when we call it.
To set a break point, just click the line number on the left side gutter. Let's set the break point on line 34.
Switch over to the examples UI, which is running on http://localhost:8080/, type something in the name field, and click the Invoke button.
The inspector window should take focus, and execution should be paused on the break point we set.
I'm not going to go into all the things you can inspect here, because it is similar to any source code debugger.
OpenShift
Now that we see how to connect to the debugger with our app running locally, let's see how we can connect to our app when it is running on OpenShift.
First, we need to get our application on an OpenShift cluster. As I said earlier, I will be using minishift so I can run OpenShift on my local computer.
Once you have that running, make sure you are logged in (I use developer/developer), and create a new project for deploying our application:
$ oc login
$ oc new-project node-debug-example
Deploy to OpenShift
To deploy our application, run this:
$npm run openshift
The openshift npm script uses a module called Nodeshift to do all the heavy lifting of deploying to OpenShift.
Your console output should look similar to this:
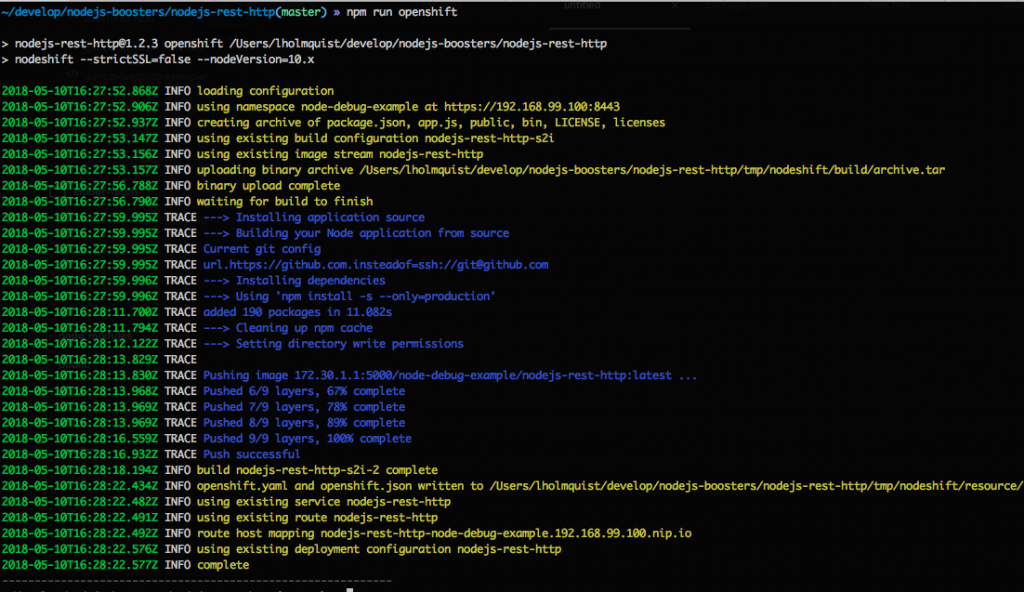
This post won't go into how Nodeshift works, but keep on eye out for a post on Nodeshift in the near future.
If you also navigate to the OpenShift console (mine is at https://192.168.99.100:8443/console/) and click your project (node-debug-example), you should see your deployed application:
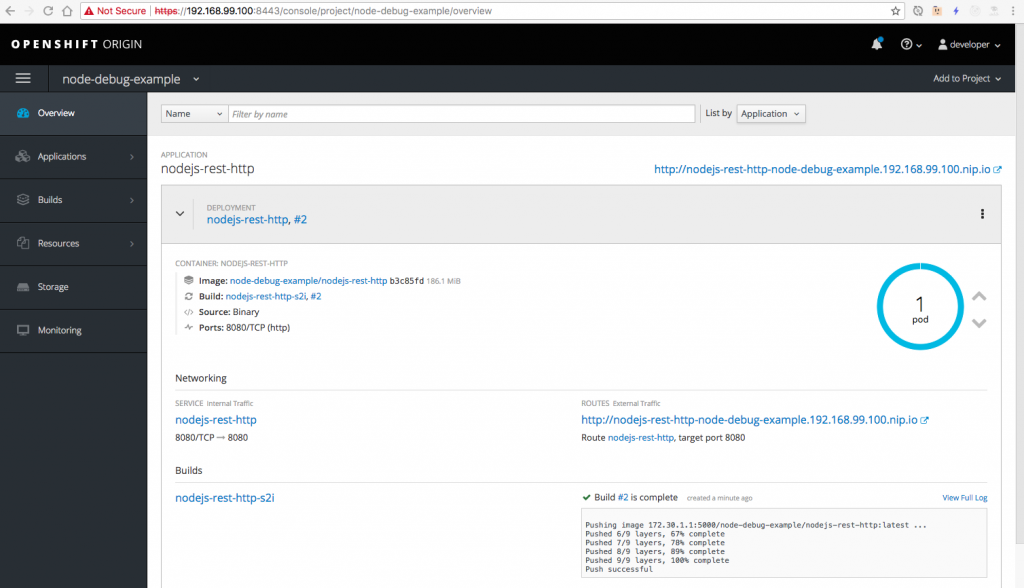
Clicking the URL, will bring you to your application, which shouldn't look any different than what we saw when we ran it locally.
Back on the main Overview page, click inside the blue circle. This will bring you to the actual pod our application is running in. Then click the Logs tab.
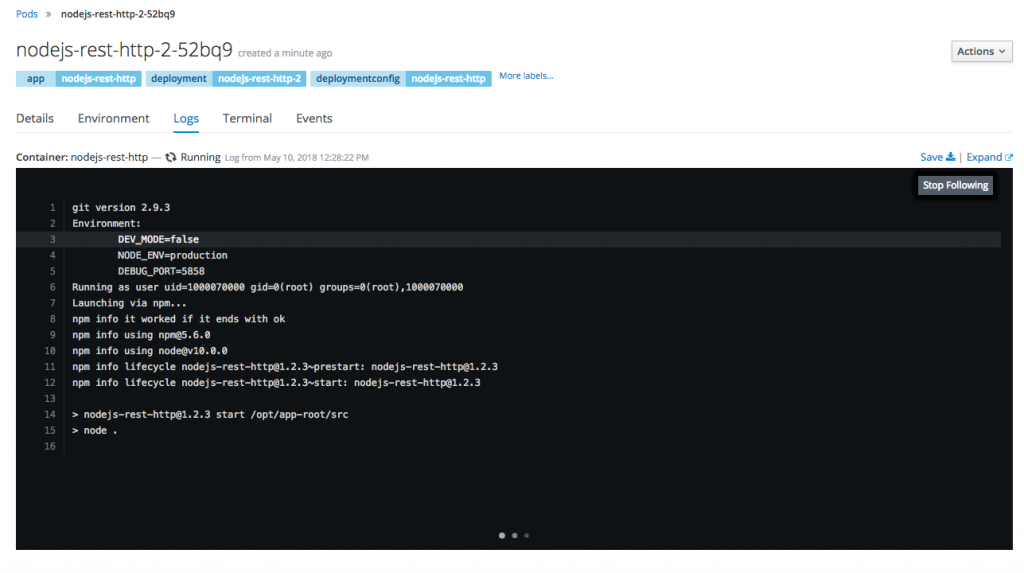
We can see that our application is running, and there is a DEBUG_PORT environment variable set with the value of 5858, but the application wasn't started with the --inspect flag because, by default, the NODE_ENV environment variable is set to production.
Debugging On OpenShift
We are going to need to deploy our application in "development" mode. There are couple ways to do it. I'm going to use the console UI to add an environment variable to our deployment config.
If you click back to the Overview screen and then click the deployment name (nodejs-rest-http), you will then be on the deployment screen.
Navigate to the Environment tab. This is where we will add a new environment variable called NODE_ENV with a value of development.
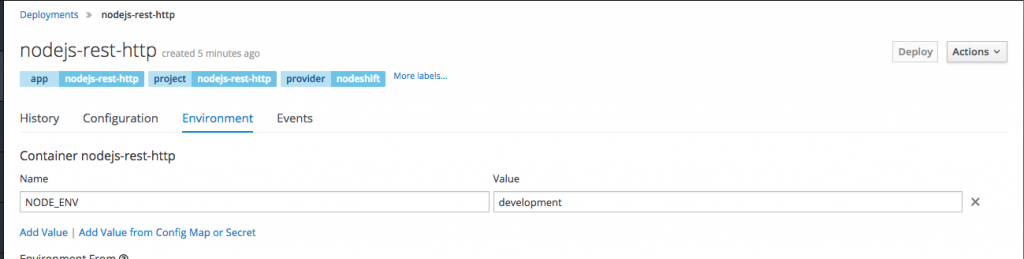
Setting that new variable will trigger a new deployment.
It might take a little longer for this deployment to become active, because we are now actually installing all the development dependencies from package.json.
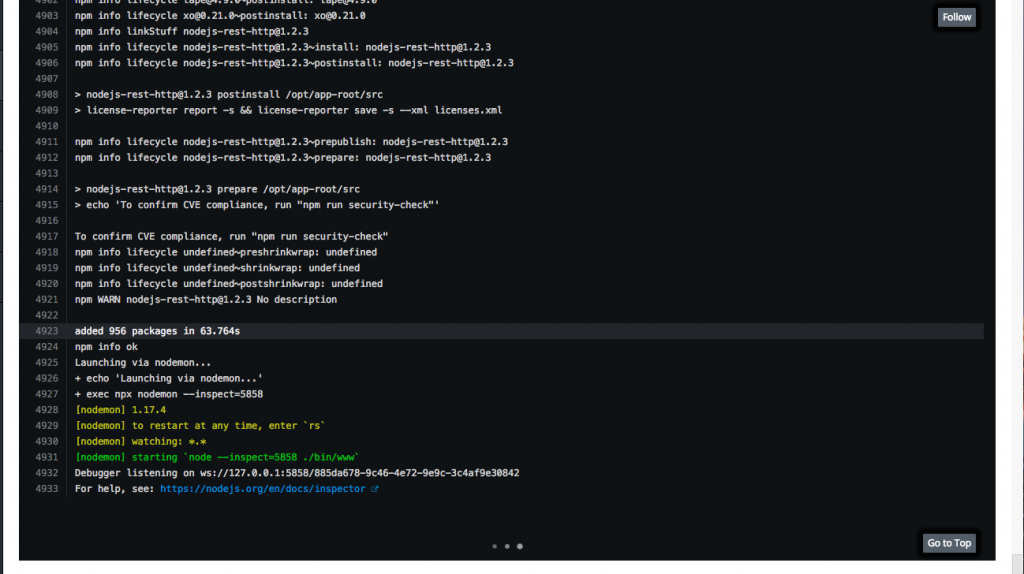
If we click into the pod like we did before and look at the log, we can see the npm install activity happening.
Our node application will now be started by Nodemon, which isn't really important for this post.
Now we can see that the node process was started with the --inspect flag and the debugger is listening on 127.0.0.1.
Port Forwarding
But that is local to that pod, so how do we connect DevTools to that? We use the oc port-forward command:
$ oc port-forward $(oc get po | grep nodejs-rest-http | grep Running | awk '{print $1}') 8888:5858
There is a lot going on here, so let's break it down.
port-forward needs a pod name, which is what is inside that $().
oc get po will get the pods.
grep nodejs-rest-http will show only pods that have nodejs-rest-http in that row.
grep Running will filter the list to show only running pods.
That awk statement will then output the first column of those grep searches, which in this case is the pod name: something like nodejs-rest-http-3-fzgk4. That mess of characters at the end changes during each deployment, so that is why we do that little statement.
The last bit, 8888:5858, says we are going to listen locally (your computer) on port 8888 and then forward those requests to port 5858 (on OpenShift).
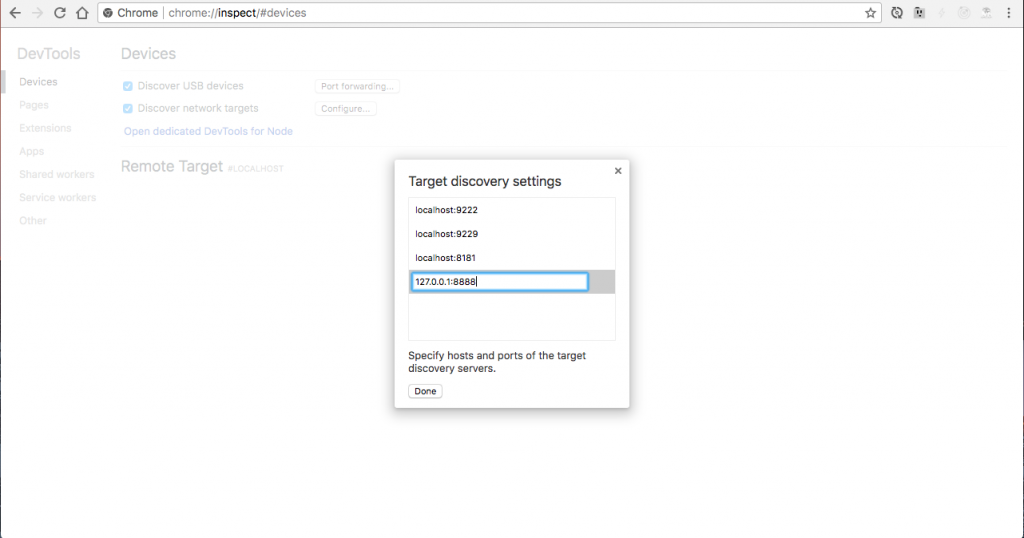
So as before, go to chrome://inspect, but this time we need to add 127.0.0.1:8888 so we can connect. Click the configure button and add those values:
Now there should be a remote target with an inspect link:
Once you click that inspect link, you can start to inspect and debug your application as we did in the local example.
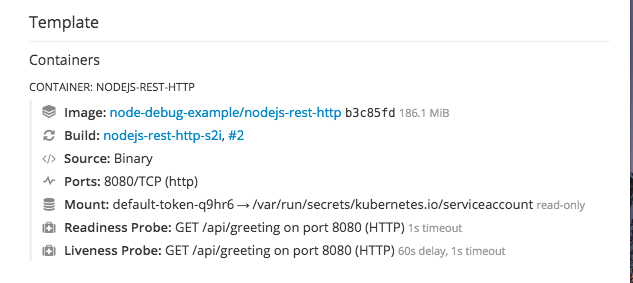
A Quick Note
If you notice that your "greeting" endpoint is getting called without you interacting with it, that is normal. This application has a readiness and liveness probe that is pointing at that endpoint.
Note: In this example, we were using the 10.x community s2i images which are located here.
To use a fully supported version of Node.js on OpenShift, all you need is to add the --dockerImage flag.
This will integrate the Red Hat OpenShift Application Runtimes version of Node.js (8.x), for which you can get full production and developer support as part of our product subscription.
This might look something like this:
// package.json
{
  "name": "nodejs-rest-http",
  ....
  "scripts": {
    ....
    "openshift": "nodeshift --strictSSL=false --dockerImage=registry.access.redhat.com/rhoar-nodejs/nodejs-8"
  },
  ....
}
Recap
While we used a pretty simple application for the example, this post shows the minimal setup that is required to start debugging your applications that are running on OpenShift.