The first article in this series presented a legacy Java application that we want to upgrade to a microservices architecture. In the second article, we upgraded the Java EE environment to Jakarta EE. Now, we will add a powerful collection of microservices functionality, writing very little code of our own. Specifically, we will:
- Extend the Red Hat JBoss Enterprise Application Platform (JBoss EAP) 7.3 capabilities with JBoss EAP XP 2.
- Introduce MicroProfile specifications that implement the patterns needed in a distributed architecture.
- Install several popular monitoring tools:
- Jaeger: A tracing tool for distributed applications.
- Prometheus: An analytical tool for application and network metrics.
- Grafana: A tool for visually displaying metrics captured by Prometheus and Jaeger.
Read the whole series:
-
Part 1: An incremental approach using Jakarta EE and MicroProfile
-
Part 3: Integrate MicroProfile services
-
Part 4: Optimize the runtime environment
About Eclipse MicroProfile
MicroProfile, a project maintained by the Eclipse Foundation, provides highly sophisticated tools that Java programmers can insert into their applications with minimal effort. In this article, we will implement and test the following components:
- MicroProfile Health: Routinely checks whether instances of your service are accepting requests.
- MicroProfile Metrics: Collects measurements that help with provisioning and planning.
- MicroProfile Opentracing: Records the flow of requests between services for troubleshooting.
- MicroProfile OpenAPI: Allows the creation of OpenAPI v3 documents for RESTful services based on the OpenAPI standard.
- MicroProfile Config: Standardizes the configuration of parameters for your application.
Installation and configuration
This article uses the same GitHub repository as the previous articles in the series. We are working in Red Hat OpenShift.
Start your upgrade by switching to the git tag that contains the source code used to implement the MicroProfile adoption:
$ git checkout tags/Microprofile_version
Now, delete the previous version of the application to start with a clean environment:
$ oc delete all --selector app=weather-app-eap-cloud-ready
$ oc delete is weather-app-eap-cloud-ready
$ oc delete bc weather-app-eap-cloud-ready
Next, we'll install Jaeger, Prometheus, and Grafana in an OpenShift environment. We'll also create the cloud-ready weather application.
Install Jaeger
Import the Jaeger image from the catalog:
$ oc import-image distributed-tracing/jaeger-all-in-one-rhel8 --from=registry.redhat.io/distributed-tracing/jaeger-all-in-one-rhel8 --confirm
Create the Jaeger application:
$ oc new-app -i jaeger-all-in-one-rhel8
Expose the route in order to make the Jaeger application available outside of OpenShift:
$ oc expose svc jaeger-all-in-one-rhel8 --port=16686
Install the weather application
Now, we'll create the cloud-ready weather application. First, import the image for JBoss EAP XP 2.0 for OpenJDK 11:
$ oc import-image jboss-eap-7/eap-xp2-openjdk11-openshift-rhel8 --from=registry.redhat.io/jboss-eap-7/eap-xp2-openjdk11-openshift-rhel8 --confirm
Create the build for the cloud-ready weather app that will be deployed on JBoss EAP XP 2.0:
$ oc new-build eap-xp2-openjdk11-openshift-rhel8 --binary=true --name=weather-app-eap-cloud-ready
Change to the directory for the weather-app-eap-cloud-ready project. Start the build of the application on OpenShift:
$ oc start-build weather-app-eap-cloud-ready --from-dir=. --wait
Create the weather application for JBoss EAP XP 2.0 and configure it:
$ oc create -f k8s/weather-app-eap-cloud-ready.yaml
Install Prometheus
Next, we create the Prometheus environment that will collect the values provided by the MicroProfile Metrics specification, which we'll integrate shortly. Start by importing the Prometheus image from the catalog:
$ oc import-image openshift4/ose-prometheus --from=registry.redhat.io/openshift4/ose-prometheus --confirm
Create the config map with the Prometheus configurations:
$ oc create configmap prometheus --from-file=k8s/prometheus.yml
Create the Prometheus application:
$ oc create -f k8s/ose-prometheus.yaml
Install Grafana
Finally, we create the Grafana environment used to collect the values provided by the MicroProfile Metrics specification. Import the Grafana image from the catalog:
$ oc import-image openshift4/ose-grafana --from=registry.redhat.io/openshift4/ose-grafana --confirm
Create the config map with the Grafana configurations:
$ oc create configmap grafana --from-file=k8s/datasource-prometheus.yaml --from-file=k8s/grafana-dashboard.yaml --from-file=k8s/jboss_eap_grafana_dashboard.json
Create the Grafana application:
$ oc create -f k8s/ose-grafana.yaml
Configure JBoss EAP XP
This section shows how easy it is to implement the MicroProfile specifications using JBoss EAP XP and OpenShift. We'll use the JBoss EAP XP container image at registry.redhat.io/jboss-eap-7/eap-xp2-openjdk11-openshift-rhel8.
To move from JBoss EAP to JBoss EAP XP, you need to update the Maven pom.xml file as follows:
...
<properties>
    ...
    <version.microprofile.bom>2.0.0.GA</version.microprofile.bom>
    ...
</properties>
...
<dependencyManagement>
    ...
    <!-- importing the microprofile BOM adds MicroProfile specs -->
    <dependency>
        <groupId>org.jboss.bom</groupId>
           <artifactId>jboss-eap-xp-microprofile</artifactId>
           <version>${version.microprofile.bom}</version>
           <type>pom</type>
           <scope>import</scope>
     </dependency>
     ...
</dependencyManagement>
...
You can use the following command to get the route to the application, then use it to test the application:
$ oc get route weather-app-eap-cloud-ready --template='{{ .spec.host }}'
Copy the output of this command into your browser. You should be able to connect to the weather application and check the weather in the selected cities.
Activate the MicroProfile services
As stated at the beginning of this article, I have chosen five tools from the MicroProfile project for our application. We'll install and use each of them in the following sections.
MicroProfile Health
The MicroProfile Health specification defines a runtime mechanism for validating the availability and status of a MicroProfile implementation. To implement MicroProfile Health, set this dependency in the Maven pom.xml file:
<!-- Import the MicroProfile Health API, we use provided scope as the API is included in JBoss EAP XP -->
<dependency>
    <groupId>org.eclipse.microprofile.health</groupId>
    <artifactId>microprofile-health-api</artifactId>
    <scope>provided</scope>
</dependency>
Readiness checks
Next, we'll create two classes to implement health checks for the application. Start with a readiness check (com.redhat.example.weather.DatabaseHealthCheck), which verifies that the application is ready to service the customers’ requests:
import org.eclipse.microprofile.health.HealthCheck;
import org.eclipse.microprofile.health.HealthCheckResponse;
import org.eclipse.microprofile.health.HealthCheckResponseBuilder;
import org.eclipse.microprofile.health.Readiness;

@Readiness
@ApplicationScoped
public class DatabaseHealthCheck implements HealthCheck {

    @Override
    public HealthCheckResponse call() {

        HealthCheckResponseBuilder responseBuilder = HealthCheckResponse.named("Database connection health check");
        String hostName = (System.getenv("WEATHER_POSTGRESQL_SERVICE_HOST") != null) ? System.getenv("WEATHER_POSTGRESQL_SERVICE_HOST") : "localhost";
        Integer port = (System.getenv("WEATHER_POSTGRESQL_SERVICE_PORT") != null) ? Integer.parseInt(System.getenv("WEATHER_POSTGRESQL_SERVICE_PORT")) : 5432;

        try {
            pingServer(hostName, port);
            responseBuilder.up();
        } catch (IOException e) {

            responseBuilder.down()
                    .withData("error", e.getMessage());
        }

        return responseBuilder.build();
    }

    private void pingServer(String dbhost, int port) throws IOException {
            Socket socket = new Socket(dbhost, port);
            socket.close();
    }

}
Liveness checks
The second class (com.redhat.example.weather.DatabaseConnectionHealthCheck) implements a liveness check, which verifies whether the application is still able to serve the requests:
import org.eclipse.microprofile.health.HealthCheck;
import org.eclipse.microprofile.health.HealthCheckResponse;
import org.eclipse.microprofile.health.HealthCheckResponseBuilder;
import org.eclipse.microprofile.health.Liveness;

@Liveness
@ApplicationScoped
public class DatabaseConnectionHealthCheck implements HealthCheck {

    @Resource
    private DataSource datasource;

    @Override
    public HealthCheckResponse call() {

        HealthCheckResponseBuilder responseBuilder = HealthCheckResponse.named("Database sql connection health check");
        try (var connection = datasource.getConnection()) {
            boolean isValid = connection.isValid(5);

            DatabaseMetaData metaData = connection.getMetaData();

            responseBuilder = responseBuilder
                        .withData("databaseProductName", metaData.getDatabaseProductName())
                        .withData("databaseProductVersion", metaData.getDatabaseProductVersion())
                        .withData("driverName", metaData.getDriverName())
                        .withData("driverVersion", metaData.getDriverVersion())
                        .withData("isValid", isValid);

            return responseBuilder.state(isValid).build();


        } catch(SQLException  e) {
            responseBuilder = responseBuilder
                   .withData("exceptionMessage", e.getMessage());
            return responseBuilder.down().build();
        }
    }

}
Note that we've used the @Liveness and @Readiness annotations on the class to enable the health checks.
Viewing the application's health status
To view the health status, click on the health route in the OpenShift web console or get the value using the following command:
$ oc get route health --template='{{ .spec.host }}'
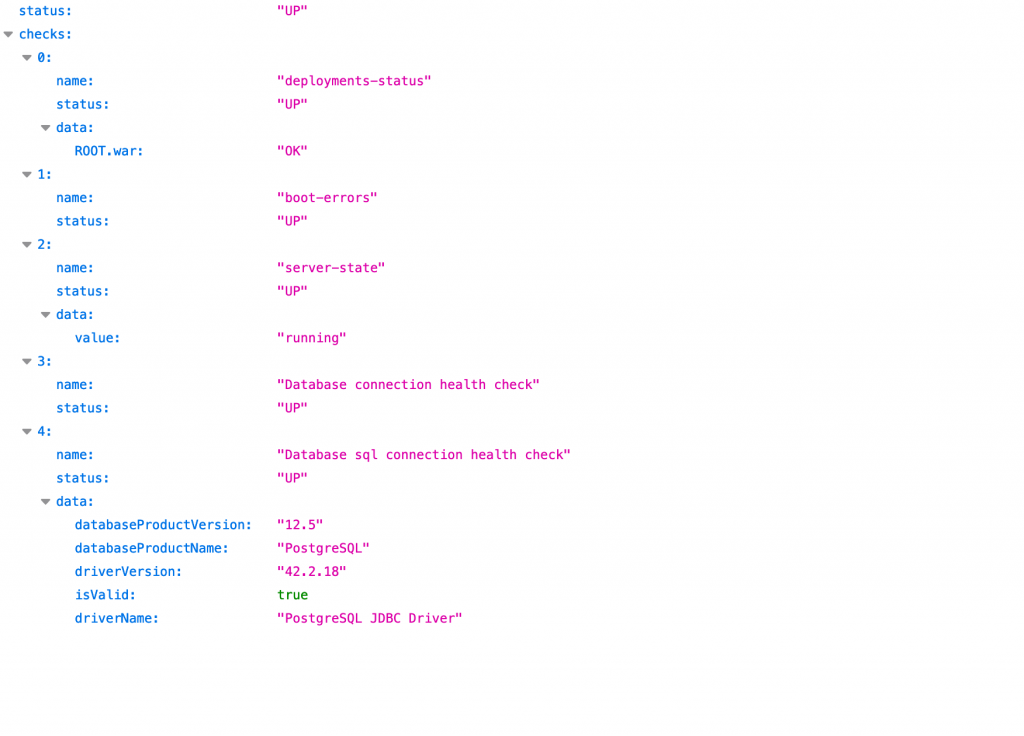
Append the path health to the command output. You can also verify the status of your application using the following paths after your health route:
/health/live: To check whether the application is up and running./health/ready: To check whether the application is ready to serve requests.
You should obtain results like those in Figure 1 (click to enlarge).
Automatic restarts
With health checks in place, you can instruct OpenShift and Kubernetes to automatically observe your application and restart the pod when a failure is reported by the checks implemented through the MicroProfile Health specification. I set up automatic restarts using the DeploymentConfig file (k8s/weather-app-eap-cloud-ready.yaml under the src folder), where I defined the liveness and readiness probes and set the application path that implements the checks:
apiVersion: apps.openshift.io/v1
kind: DeploymentConfig
...
spec:
  replicas: 1
  ...
    spec:
      containers:
        - resources: {}
          readinessProbe:
            httpGet:
              path: /health/ready
              port: 9990
              scheme: HTTP
            initialDelaySeconds: 25
            timeoutSeconds: 1
            periodSeconds: 10
            successThreshold: 1
            failureThreshold: 3
          name: weather-app-eap-cloud-ready
          livenessProbe:
            httpGet:
              path: /health/live
              port: 9990
              scheme: HTTP
            initialDelaySeconds: 25
            timeoutSeconds: 1
            periodSeconds: 10
            successThreshold: 1
            failureThreshold: 3
MicroProfile Metrics
MicroProfile Metrics allows applications to log metrics during execution, which you can use to monitor essential system parameters. You can implement this service without touching your code. Just add the following dependencies to your Maven pom.xml file:
<!-- Import the MicroProfile Metrics API, we use provided scope as the API is included in JBoss EAP XP -->
<dependency>
    <groupId>org.eclipse.microprofile.metrics</groupId>
    <artifactId>microprofile-metrics-api</artifactId>
    <scope>provided</scope>
</dependency>
To add more information that helps to test the metrics capabilities, I updated my com.redhat.example.weather.WeatherService class as follows:
...
import org.eclipse.microprofile.metrics.MetricUnits;
import org.eclipse.microprofile.metrics.annotation.Counted;
import org.eclipse.microprofile.metrics.annotation.Metered;
import org.eclipse.microprofile.metrics.annotation.Timed;

@RequestScoped
@Path("weather")
public class WeatherService {
    ...
    @GET
    @Produces(MediaType.APPLICATION_JSON)
    @Counted(name = "requestCount", description = "How many weather forecast have been performed.")
    @Timed(name = "checksTimer", absolute = true, description = "A measure of how long it takes to perform the getList method.", unit = MetricUnits.MILLISECONDS)
    @Metered(name = "getList", absolute = true)
    public Country getList() {
        return em.find(Country.class,selectedCountry.getCode());
    }
}
Accessing metrics
To get access to the metrics being generated, click on the metric route in the OpenShift web console or get the value using the following command:
$ oc get route metric --template='{{ .spec.host }}'
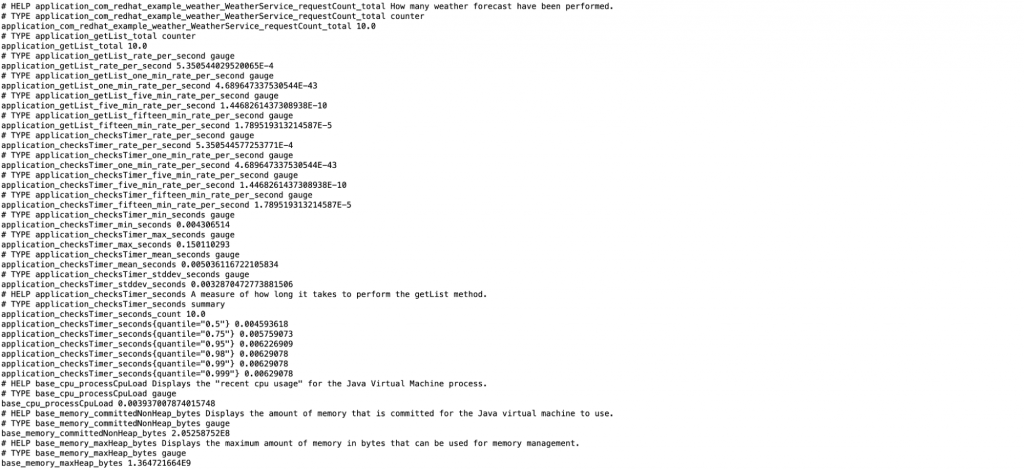
Then, append the path metrics. The MicroProfile Metrics specification defines three different scopes of metrics that you can check by appending the following paths after your metric route:
/metrics/base: Metrics that all MicroProfile vendors must provide./metrics/vendor:Vendor-specific metrics./metrics/application: Application-specific metrics.
The metrics look something like what's shown in Figure 2.
Visualizing metrics with Prometheus and Grafana
To provide a more comprehensible display of the metrics exposed by your application in OpenShift, you can integrate them into Prometheus and Grafana.
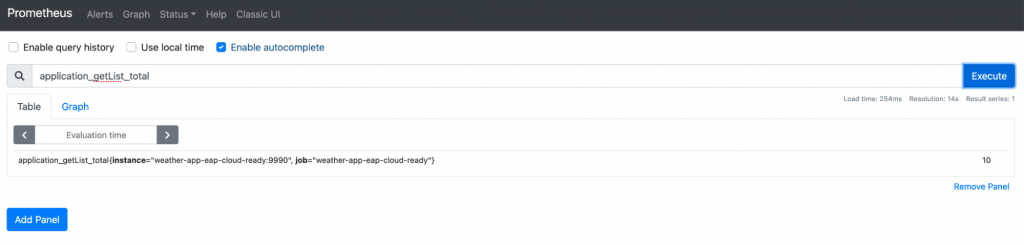
Prometheus is an open source, community-driven project that collects metrics from targets by scraping the metrics HTTP endpoints. We installed and configured it in the previous steps using the prometheus.yml and ose-prometheus.yaml files under the k8s directory. Click on the ose-prometheus route in the OpenShift web console or get the value using the following command:
$ oc get route ose-prometheus --template='{{ .spec.host }}'
Visiting the URL opens the Prometheus web console. Enter application_getList_total there and click on the Execute button. This will show you the number of invocations of the getList method used by the application. You should see something like Figure 3.
Grafana is an open source tool that composes dashboards with statistics from Prometheus to aid in the observability of applications, systems, and networks. I installed and configured Grafana in the previous steps using the datasource-prometheus.yaml, grafana-dashboard.yaml, jboss_eap_grafana_dashboard.json, and ose-grafana.yaml files. These files create the Grafana application, connect it with Prometheus, and pre-load a dashboard with some metrics. To view the dashboard, click on the ose-grafana route in the OpenShift web console or get the value using the following command:
$ oc get route ose-grafana --template='{{ .spec.host }}'
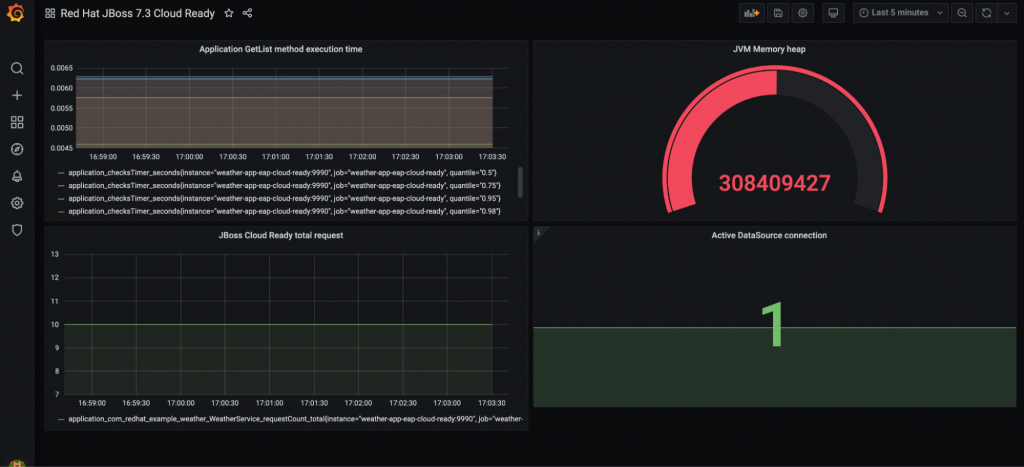
Visting the URL opens the Grafana web console. Enter admin in the username and password fields and skip the page offering to set the new password. Then click on Dashboards—>Manage in the left-side menu. This displays a pre-loaded Red Hat JBoss 7.3 Cloud Ready dashboard that shows the following metrics:
- Application
getListmethod execution time - JBoss Cloud Ready total requests
- JVM Memory heap
- Active data source connections
The display looks like Figure 4.
MicroProfile OpenTracing
Distributed tracing allows you to trace the flow of a request across service boundaries. This is particularly important in a microservices environment, where a request typically flows through multiple services. Here again, standards make it easy to enable the service, and I didn’t need to touch my code to obtain it. To make my application traceable, I only added the following dependency to the Maven pom.xml file:
<!-- Import the MicroProfile OpenTracing API, we use provided scope as the API is included in the server -->
<dependency>
    <groupId>org.eclipse.microprofile.opentracing</groupId>
    <artifactId>microprofile-opentracing-api</artifactId>
    <scope>provided</scope>
</dependency>
Visualizing distributed tracing with Jaeger
To add detailed information about the request, I integrated Jaeger into OpenShift. Jaeger is an open source, end-to-end distributed tracing tool that helps monitor and troubleshoot transactions in complex distributed systems. We installed and configured the tool in the previous steps using the Jaeger image from the Red Hat Container Catalog (registry.redhat.io/distributed-tracing/jaeger-all-in-one-rhel8). To use the service, click on the jaeger-all-in-one-rhel8 route in the OpenShift web console or get the value using the following command:
$ oc get route jaeger-all-in-one-rhel8 --template='{{ .spec.host }}'
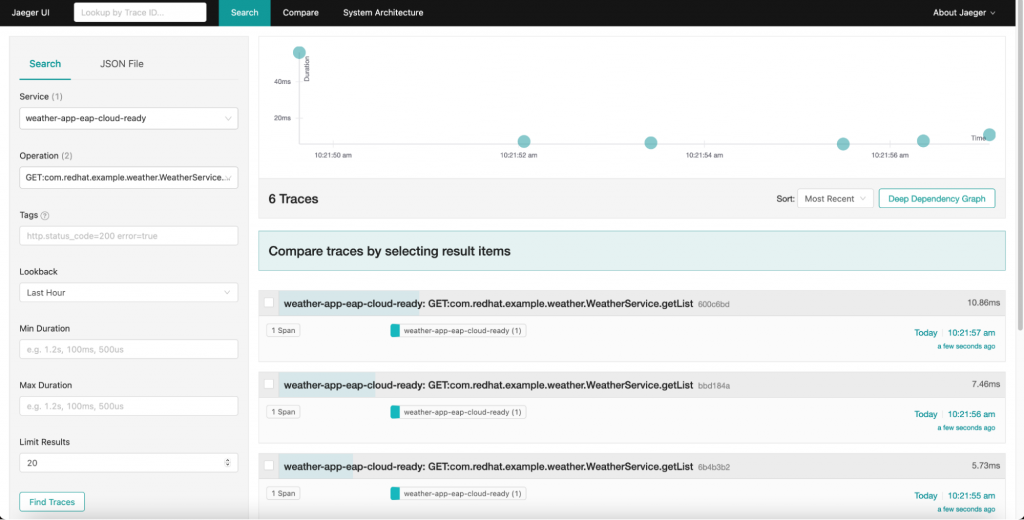
Visting the URL opens the Jaeger web console. Select weather-app-eap-cloud-ready from the Operation drop-down list box, then GET:com.redhat.example.weather.WeatherService.getList. Click the Find Traces button to visualize the results of the trace. You should see something like Figure 5.
MicroProfile OpenAPI
The MicroProfile OpenAPI specification provides a set of Java interfaces and programming models that allow Java developers to natively produce OpenAPI v3 documents from Java API for RESTful Web Services (JAX-RS) applications. To implement that specification and obtain documentation for my APIs, I didn’t touch my code. I only added the following dependency to the Maven pom.xml file:
<!-- Import the MicroProfile OpenAPI, we use provided scope as the API is included in the server -->
<dependency>
    <groupId>org.eclipse.microprofile.openapi</groupId>
    <artifactId>microprofile-openapi-api</artifactId>
    <scope>provided</scope>
</dependency>
Viewing the OpenAPI structure of your APIs
To use the service, click on the weather-app-eap-cloud-ready route in the OpenShift web console or get the value using the following command:
$ oc get route weather-app-eap-cloud-ready --template='{{ .spec.host }}'
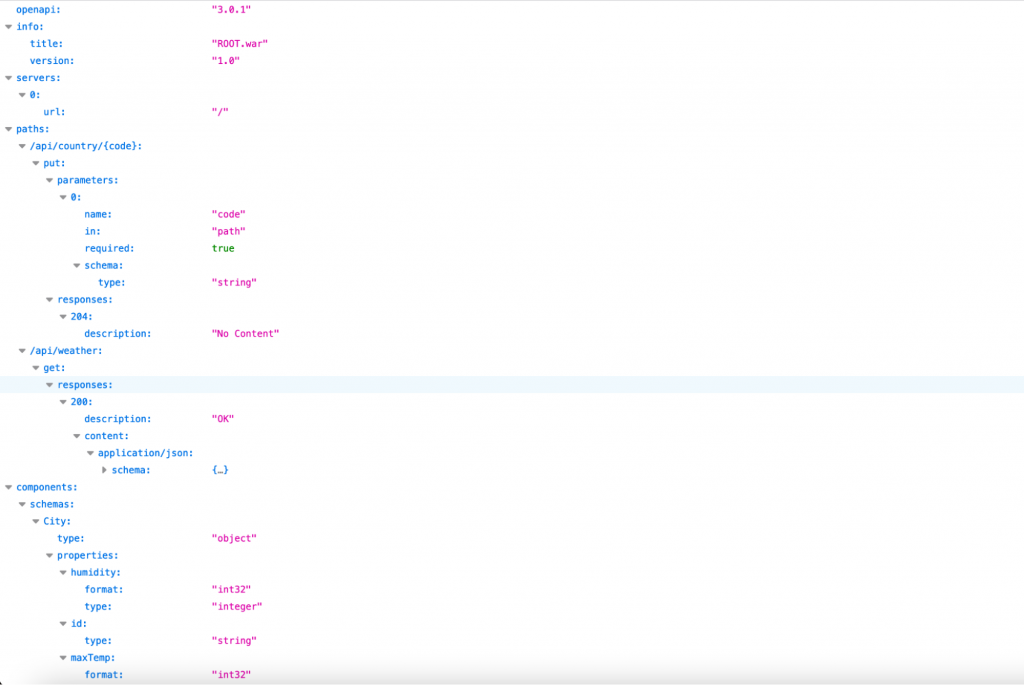
Then, append the path openapi to download the YAML file that contains the OpenAPI structure of your APIs. You should see something like Figure 6. If you want to visualize the data in JSON format, append the path openapi?format=JSON to the weather-app-eap-cloud-ready route.
Visualize and test API data
I extended the specification with a user interface that can help you visualize and test the API's data. As usual, you need only to add the following dependency to the Maven pom.xml file:
<dependency>
    <groupId>org.microprofile-ext.openapi-ext</groupId>
    <artifactId>openapi-ui</artifactId>
    <version>1.1.4</version>
    <scope>runtime</scope>
</dependency>
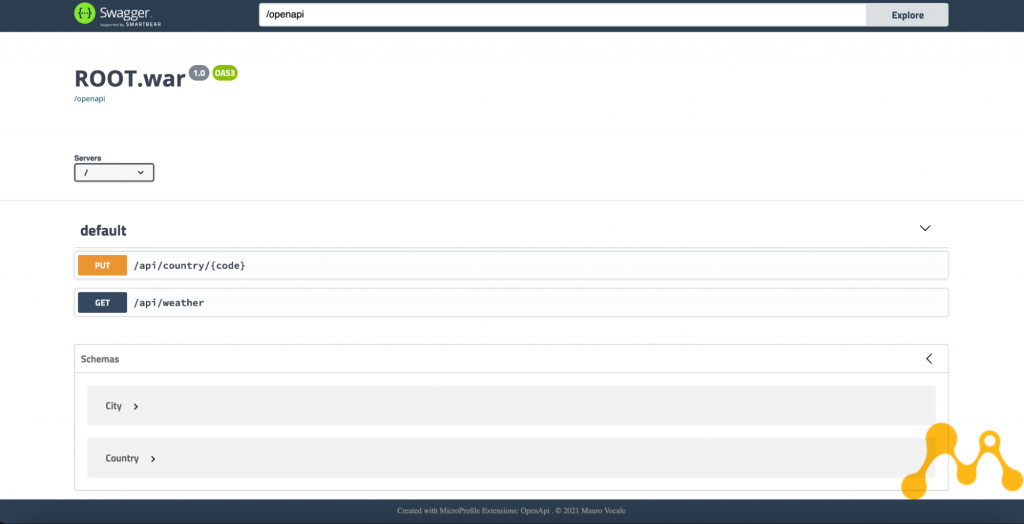
The dependency is not directly related to MicroProfile specifications, so it’s not provided by the Maven bill of materials (BOM) and JBoss EAP XP. To test the service, append the path api/openapi-ui to the weather-app-eap-cloud-ready route. The resulting URL (shown in Figure 7) displays the Swagger UI. You can use it to test my APIs, which you will probably agree could use improvement.
MicroProfile Config
MicroProfile Config defines a simple and flexible system for application configuration. To demonstrate how easy it is to use, I configured the OpenAPI UI described in the previous section using the values provided by the Config specification. As usual, I didn’t touch my source code, but only added the following dependency to the Maven pom.xml file:
<!-- Import the MicroProfile Config API, we use provided scope as the API is included in the server -->
<dependency>
    <groupId>org.eclipse.microprofile.config</groupId>
    <artifactId>microprofile-config-api</artifactId>
    <scope>provided</scope>
</dependency>
Then, under the src/main/resources/META-INF directory, I created a microprofile-config.properties file that contains the values I didn’t want to put statically into my source code:
openapi.ui.copyrightBy=Mauro Vocale
openapi.ui.title=Weather Application OpenAPI specifications
openapi.ui.swaggerHeaderVisibility=visible
openapi.ui.exploreFormVisibility=visible
You can see the first value, for example, in the footer section of the OpenAPI UI.
Conclusion to Part 3
In this article, we've enriched our "traditional" Java application with a set of features that prepare it for being used in distributed scenarios such as OpenShift, on-premises, or in a cloud environment. We only needed to make minimal updates to the source code. The final result was obtained through the declaration of the dependencies that are provided, at runtime, from JBoss EAP XP and OpenShift.
The final container image (JBoss EAP XP plus the application) is similar to the one that we built with Jakarta EE and JBoss EAP 7.3 in the previous article. You can get summary information about the application from the OpenShift web console, as shown in Figure 8.
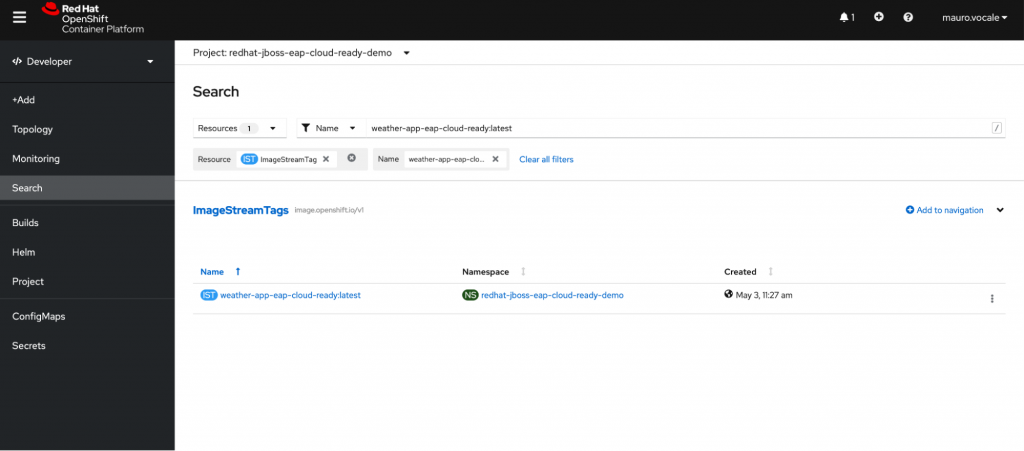
Figure 9 shows that our memory utilization is higher than that of the traditional application, as I mentioned in the conclusion to Part 2.

Figure 10 shows increased memory use, as well. We'll fix this issue in the next and final article in this series, where we will optimize the image's runtime environment.

Next up: Optimize the runtime environment.
Last updated: January 12, 2024