This article will show how OpenTracing instrumentation can be used to collect Application Metrics, in addition to (but independent from) reported tracing data, from services deployed within Kubernetes. These Application Metrics can then be displayed in your monitoring dashboard and used to trigger alerts.
THE EXAMPLE APPLICATION
In a recent article, we showed how a Spring Boot application could easily be instrumented using OpenTracing.
The example we are going to use in this article uses the same approach to create two services, ordermgr and accountmgr.
accountmgr presents a single REST endpoint (/getAccount) for internal use by ordermgr. The code for this endpoint is:
    @RequestMapping("/account")
    public String getAccount() throws InterruptedException {
        Thread.sleep(1 + (long)(Math.random()*500));
        if (Math.random() > 0.8) {
            throw new RuntimeException("Failed to find account");
        }
        return "Account details";
    }
| This line simply introduces a random delay, to make the collected metrics more interesting. | |
| These three lines randomly cause an exception, which will result in the span (associated with the REST endpoint invocation) being tagged as an error with associated log events identifying the error details. |
ordermgr presents three REST endpoints for use by an end user. These are:
    @Autowired
    private io.opentracing.Tracer tracer;

    @RequestMapping("/buy")
    public String buy() throws InterruptedException {
        Thread.sleep(1 + (long)(Math.random()*500));
        tracer.activeSpan().setBaggageItem("transaction", "buy");
        ResponseEntity<String> response = restTemplate.getForEntity(accountMgrUrl + "/account", String.class);
        return "BUY + " + response.getBody();
    }

    @RequestMapping("/sell")
    public String sell() throws InterruptedException {
        Thread.sleep(1 + (long)(Math.random()*500));
        tracer.activeSpan().setBaggageItem("transaction", "sell");
        ResponseEntity<String> response = restTemplate.getForEntity(accountMgrUrl + "/account", String.class);
        return "SELL + " + response.getBody();
    }

    @RequestMapping("/fail")
    public String fail() throws InterruptedException {
        Thread.sleep(1 + (long)(Math.random()*500));
        ResponseEntity<String> response = restTemplate.getForEntity(accountMgrUrl + "/missing", String.class);
        return "FAIL + " + response.getBody();
    }
The service injects the OpenTracing Tracer to enable access to the active span. |
|
| All three methods introduce a random delay. | |
The buy and sell methods additionally set a baggage item transaction with the name of the business transaction being performed (i.e. buy or sell). For those not familiar with OpenTracing, the baggage concept allows information to be carried in band with the trace context between invoked services. We will show you how a baggage item can be used to isolate the metrics relevant only for a particular business transaction. |
|
| Invoking a non-existent endpoint on accountmgr will lead to an error being reported in the trace and metric data. |
ADDING METRICS REPORTING TO THE OPENTRACING INSTRUMENTATION
The OpenTracing API defines the concept of a Span, which represents a unit of work performed by a service, e.g. to receive a service invocation, perform some internal task (e.g. accessing a database) or invoking an external service. They provide an ideal basis upon which to report metrics (count and duration) regarding these points within a service.
Therefore, a new OpenTracing contrib project has been established (initially just for Java) to intercept the finished spans, and create the relevant metrics. These metrics are then submitted to a MetricsReporter for recording - the initial implementation of this interface is for Prometheus.
The first step is to expose an endpoint for collecting the Prometheus metrics. Each service has the following configuration:
@Configuration
@ConditionalOnClass(CollectorRegistry.class)
public class PrometheusConfiguration {

     @Bean
     @ConditionalOnMissingBean
     CollectorRegistry metricRegistry() {
         return CollectorRegistry.defaultRegistry;
     }

     @Bean
     ServletRegistrationBean registerPrometheusExporterServlet(CollectorRegistry metricRegistry) {
           return new ServletRegistrationBean(new MetricsServlet(metricRegistry), "/metrics");
     }
}
This will allow the Prometheus metrics to be obtained from the service’s /metrics REST endpoint.
Each service then requires a configuration to obtain the io.opentracing.Tracer:
@Configuration
public class TracerConfiguration implements javax.servlet.ServletContextListener {

	@Bean
	public io.opentracing.Tracer tracer() {
		return io.opentracing.contrib.metrics.Metrics.decorate(
			io.opentracing.contrib.tracerresolver.TracerResolver.resolveTracer(),
			PrometheusMetricsReporter.newMetricsReporter()
				.withBaggageLabel("transaction","n/a")
				.build());
	}

	@Override
	public void contextInitialized(javax.servlet.ServletContextEvent sce) {
		sce.getServletContext().setAttribute(io.opentracing.contrib.web.servlet.filter.TracingFilter.SKIP_PATTERN, Pattern.compile("/metrics"));
	}

	...
The first method uses the TracerResolver to provide a vendor-neutral approach for accessing a Tracer. This tracer is then enhanced with the metrics capability using a PrometheusMetricsReporter. This metrics reporter is further configured to add a special label related to the baggage key transaction (discussed later).
By default, the Servlet OpenTracing integration will trace all REST endpoints. Therefore in the second method above, we add an attribute that will inform the instrumentation to ignore the /metrics endpoint. Otherwise, we will have tracing data reported each time Prometheus reads the metrics for the service.
DEPLOYING ON KUBERNETES
The steps to set up an environment on Kubernetes is discussed in the example codebase. A summary of the steps is:
- Start minikube
minikube start minikube dashboard - Deploy Prometheus - using the Prometheus Operator project to capture metrics from the services
kubectl create -f https://raw.githubusercontent.com/coreos/prometheus-operator/master/bundle.yaml # Wait until pods are green, then add configuration to locate service monitors based on label "team: frontend": kubectl create -f https://raw.githubusercontent.com/objectiser/opentracing-prometheus-example/master/prometheus-kubernetes.yml # Wait until these pods are green, then get the URL from the following command and open in browser: minikube service prometheus --url - Deploy Jaeger - an OpenTracing compatible tracing system
kubectl create -f https://raw.githubusercontent.com/jaegertracing/jaeger-kubernetes/master/all-in-one/jaeger-all-in-one-template.yml # Once pods are green, then get the Jaeger dashboard URL from the following command and open in a browser minikube service jaeger-query --url - For this article, we also deployed Grafana to display the metrics, although the Prometheus dashboard could be used. Once Grafana is installed:
- Obtain the Prometheus server URL using
minikube service prometheus --url - Configure a new Datasource named Prometheus of type
Prometheusand specify the URL obtained from the previous command - Download the example dashboard using the following command and import it into Grafana
wget https://raw.githubusercontent.com/objectiser/opentracing-prometheus-example/master/simple/GrafanaDashboard.json
- Obtain the Prometheus server URL using
Once they are all running, then the simple example with the two services can be deployed. For this, you will need to clone the example code repo and follow these instructions.
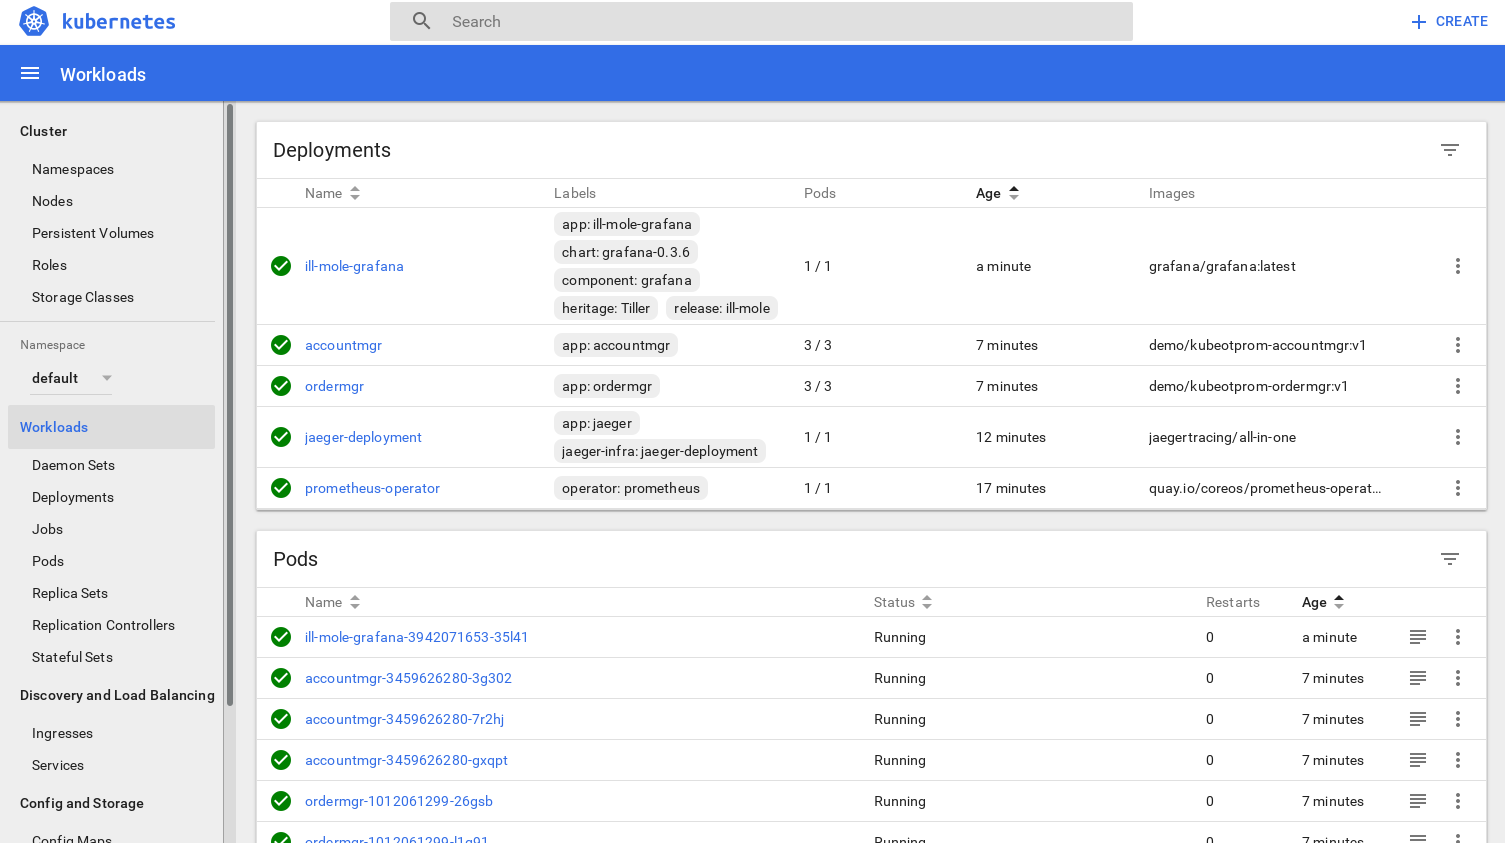
At this stage the Kubernetes dashboard would look like this:
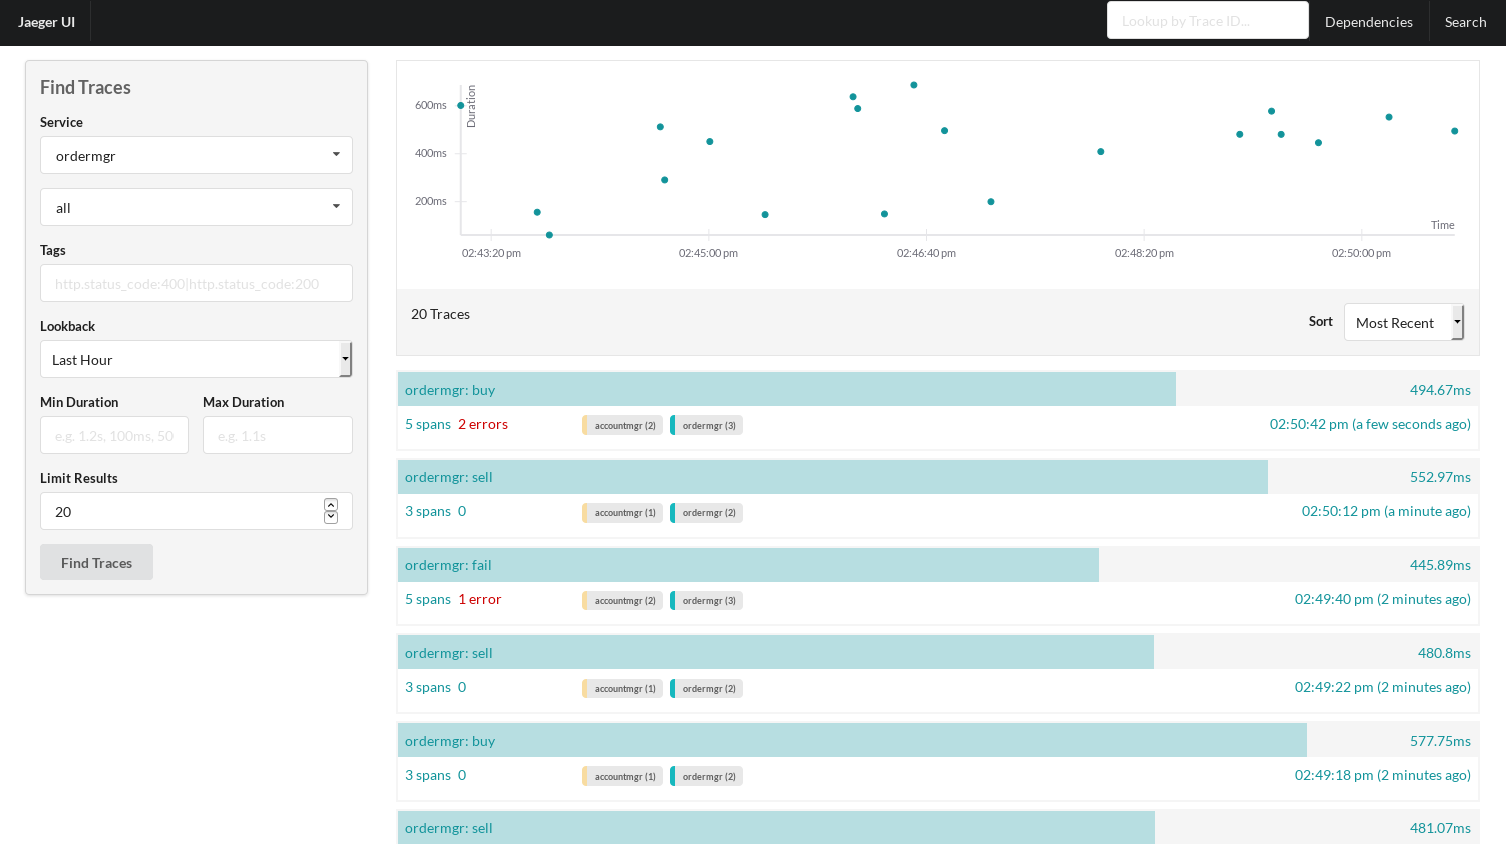
The example code includes a script that loops, randomly invoking the three REST endpoints provided by ordermgr. Once some example requests have been created, you can view the tracing dashboard:
Then you can select a specific trace instance and see further details:
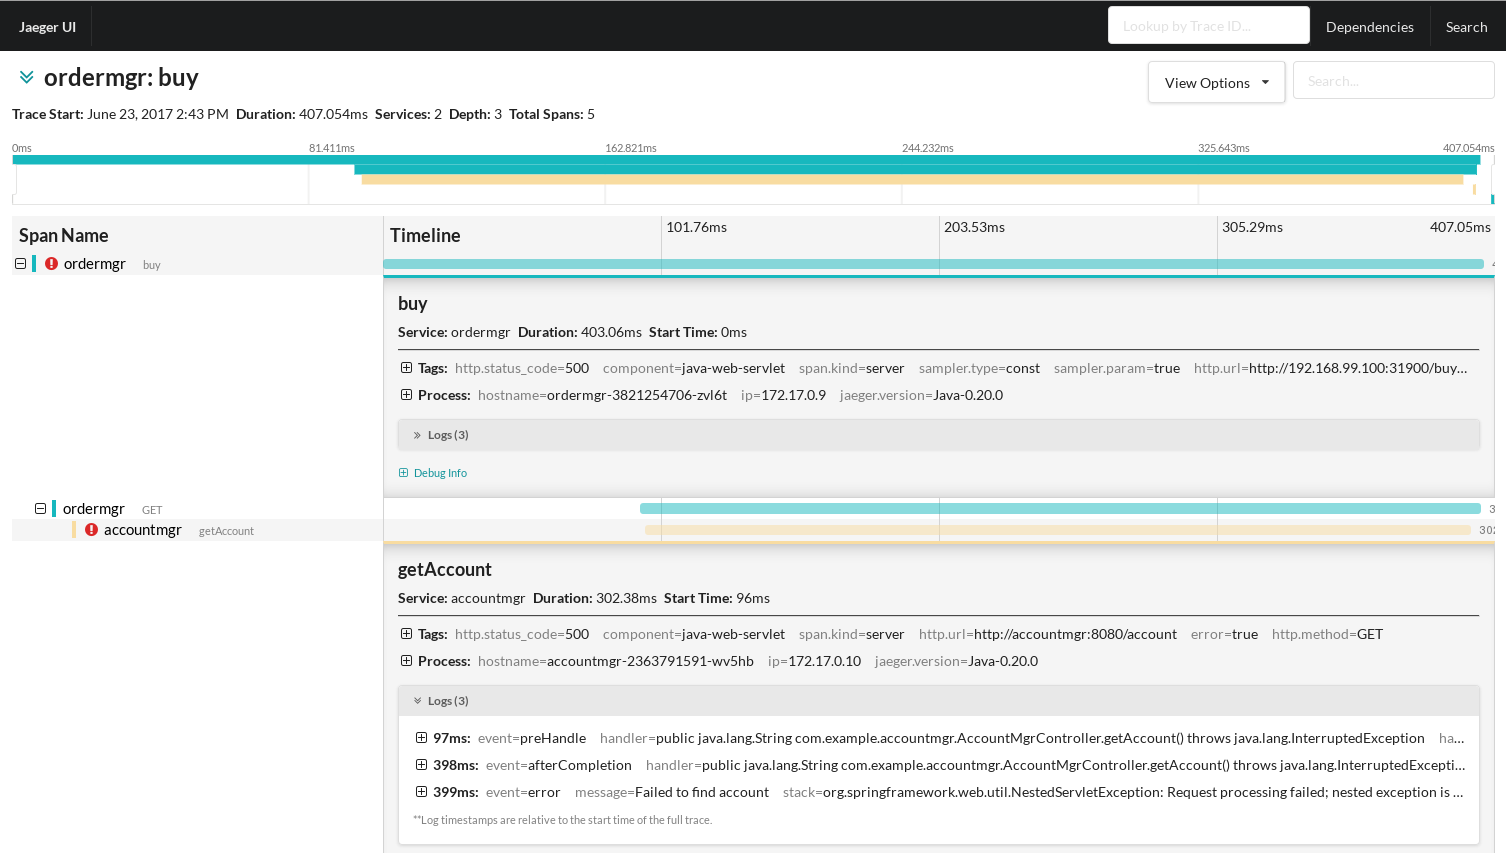
This shows that the trace instance has three spans, the first representing the receipt of the /buy request on ordermgr, the second where ordermgr is invoking accountmgr, and finally the accountmgr receiving the /hello request. In this particular trace instance, the accountmgr invocation has reported an error, indicated by the error=true tag.
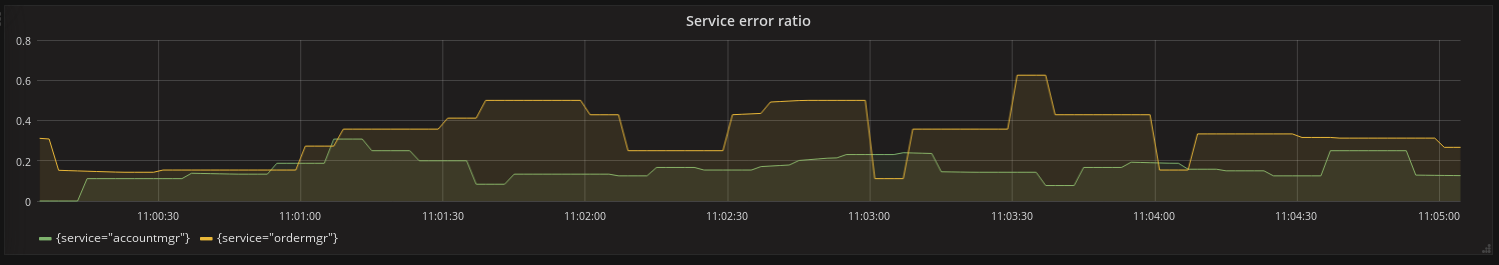
Now we will look at the Grafana dashboard to see what metrics have been reported from the OpenTracing instrumentation within the two services:
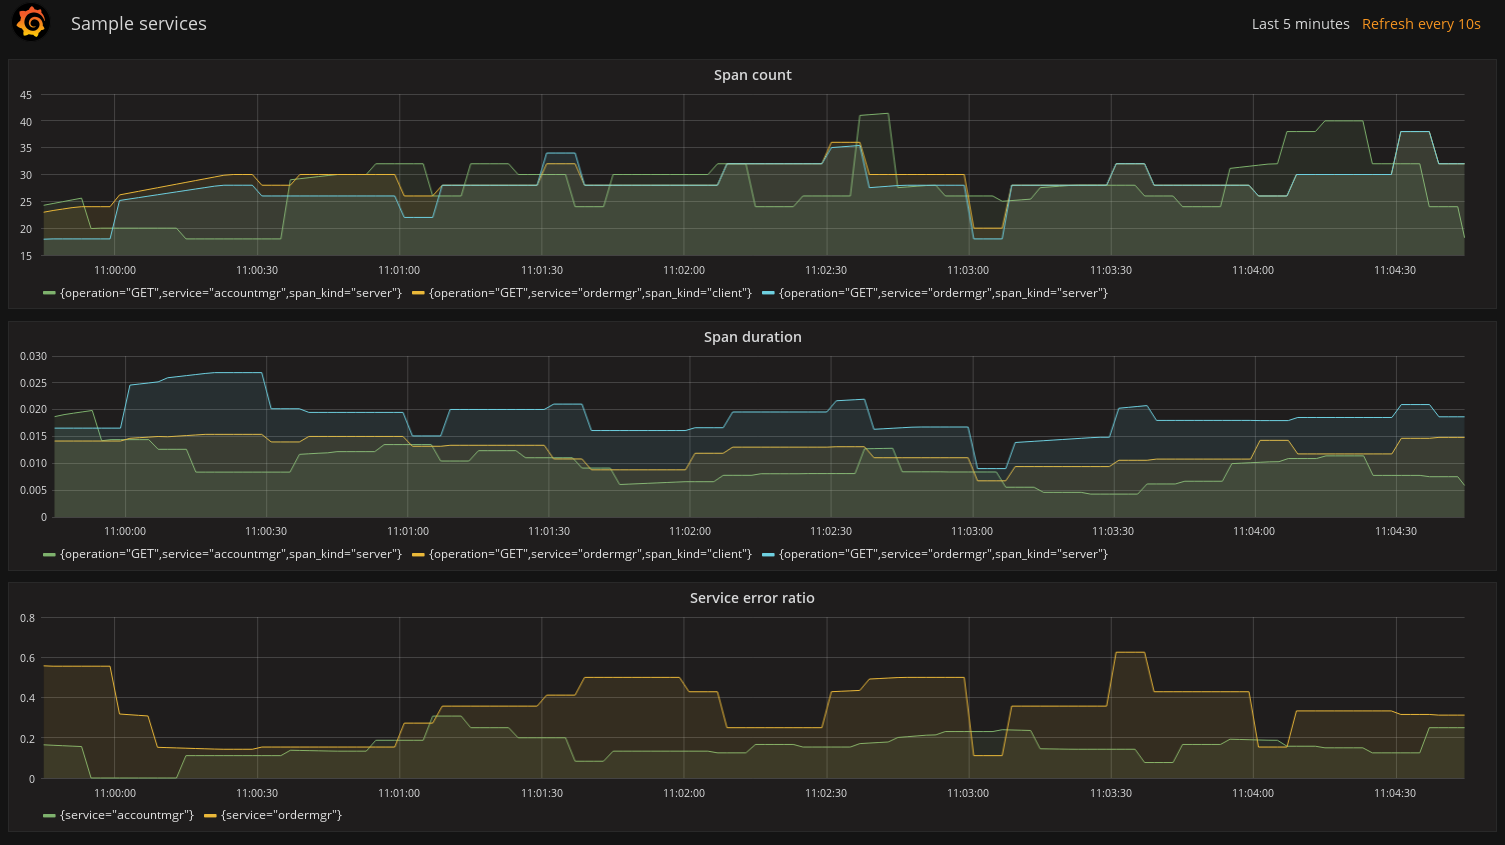
This dashboard includes three graphs, the first showing the number of spans created (i.e. span count) by our sell() method, and we can use it to track how many times this business operation has been executed. The second showing the average duration of the spans, and third showing the ratio between successful and erroneous spans.
The metrics reported by Prometheus are based on a range of labels - a metric exists for each unique combination of those labels.
The standard labels included with the OpenTracing java-metrics project are: operation, span.kind and error.
With this particular example, we also included the transaction label.
However, when the services are deployed to Kubernetes, the following additional labels are included for free: pod, instance, service, job and namespace.
In our example Prometheus queries, we have ignored most of the Kubernetes added labels (except service) so that the metrics are aggregated across the specific pods, namespaces, etc. However, having these labels available means it is possible to segment the metrics in whatever way is required to analyze the data.
When using the java-metrics project outside of Kubernetes, it is still possible to include the service label, however, you would configure this when setting up the tracer.
We can also filter the data, to focus on specific areas of interest:
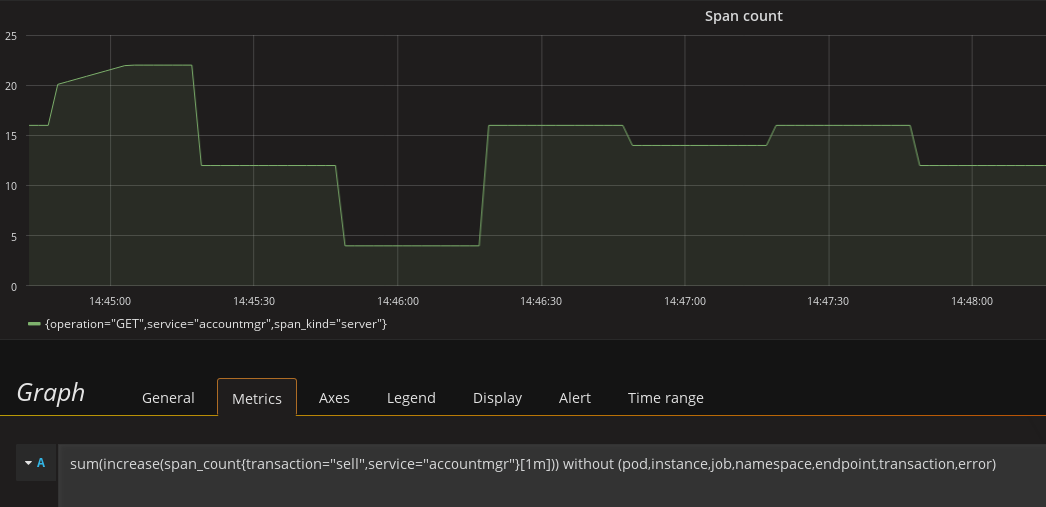
In this image, we have filtered the metrics based on the transaction='sell' and service='accountmgr'. This is where using the metric label based on the baggage item transaction can be useful, to understand the usage of a particular shared service by a business transaction. With further work, it would be possible to show the distribution of requests for a service across the various business transactions.
VIDEO
CONCLUSION
This article has shown how a service can be instrumented once (using OpenTracing) and generates both tracing and application metrics.
When deployed to a Kubernetes environment, the metrics also benefit from an additional set of labels automatically added by the infrastructure, describing the service, pod, namespace, etc. This makes it easy to isolate specific metrics of interest or view high level aggregated metrics to gain an overview of your application's performance.
LINKS
- OpenTracing: http://opentracing.io
- Github repository with demo: https://github.com/objectiser/opentracing-prometheus-example
- OpenTracing Java metrics: https://github.com/opentracing-contrib/java-metrics
- Kubernetes: https://kubernetes.io
- Jaeger: https://github.com/uber/jaeger
- Prometheus: https://prometheus.io
- Hawkular: http://www.hawkular.org/
LEARN MORE
You can learn more about Distributed Tracing and Jaeger in an upcoming OpenShift Commons Briefing with
Distributed Tracing with Jaeger & Prometheus on Kubernetes with Yuri Shkuro (Uber) & Gary Brown (Red Hat)
The schedule of all upcoming OpenShift Commons Briefings can be found here: https://commons.openshift.org/events.html
Please note: this article was authored by Gary Brown (Red Hat) and originally posted here: http://www.hawkular.org/blog/2017/06/26/opentracing-appmetrics.html
Download this Kubernetes cheat sheet for automating deployment.