Red Hat OpenShift 4.6 streamlines developer onboarding in the OpenShift web console, but that's not all. This article details improvements and new features in the topology view and introduces OpenShift's new, form-based approach to creating horizontal pod autoscalers and Helm charts. I also touch on application monitoring improvements and the latest updates for Red Hat OpenShift Pipelines, Red Hat OpenShift Serverless, and the Kiali Operator in OpenShift 4.6.
Note: This article presents an overview of what's new in OpenShift 4.6. See the video at the end of the article for a guide to accessing and using the new features in the OpenShift web console.
Getting started with OpenShift 4.6
In OpenShift 4.6, we've made a few additions to improve the developer onboarding experience:
- The developer perspective is now the default landing page for non-privileged users. The first time you log into the OpenShift web console, you go directly to this page.
- First-time users entering the developer perspective are invited to opt-in for a guided tour. The tour introduces the developer perspective's user interface (UI) and what you can do in each UI area.
- You can use various sample applications to easily and efficiently create new applications and run them on OpenShift.
- Developer quick starts guide you through creating a new serverless or pipeline project, configuring health checks, and more.
Learn more: See New developer onboarding features in Red Hat OpenShift 4.6 for more about these updates to the OpenShift 4.6 web console.
The developer perspective topology view
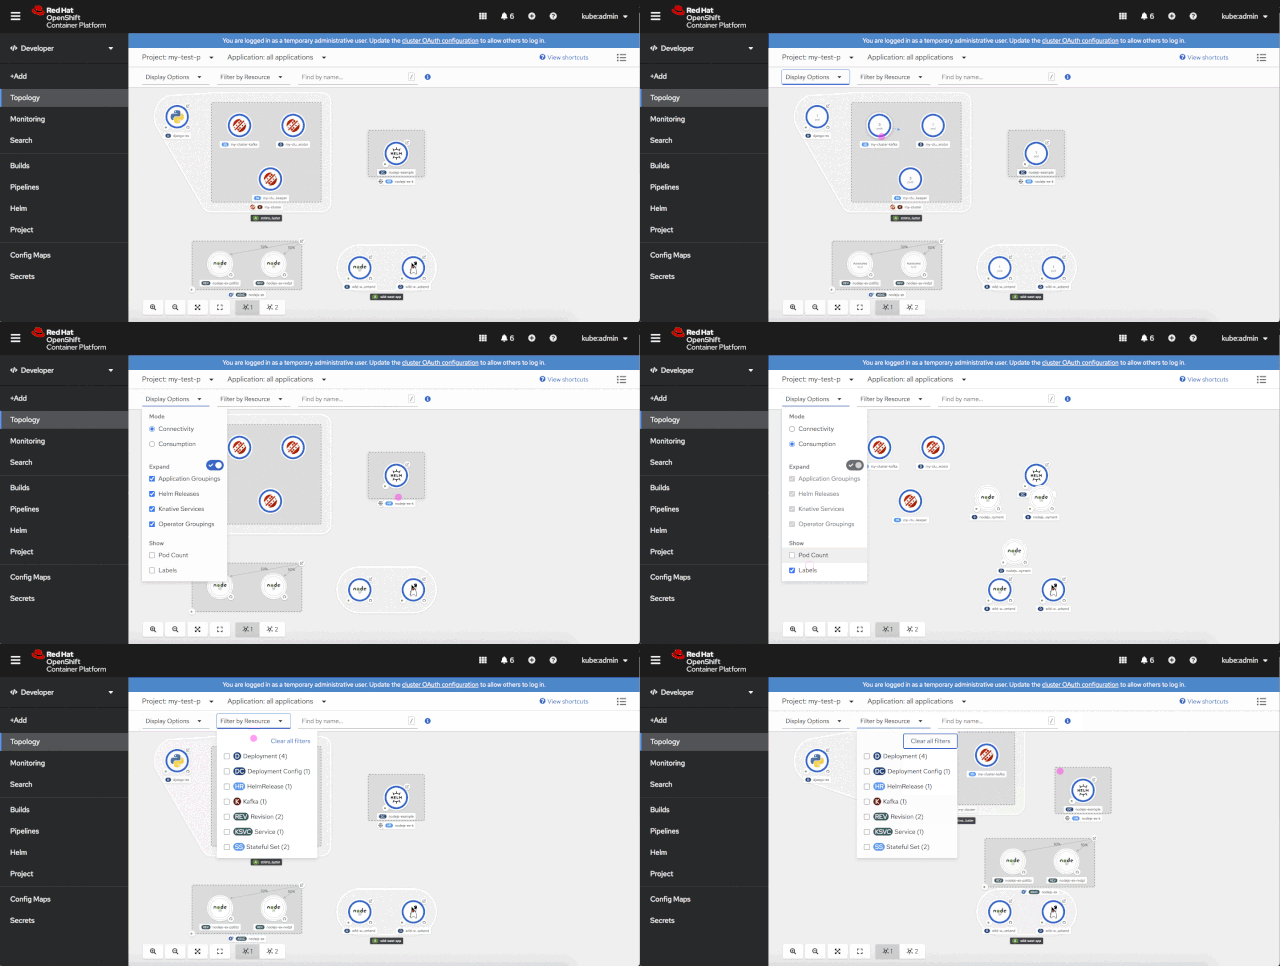
We’ve made big updates to the developer perspective's topology view:
- There are now two modes in the application topology graph: Connectivity and Consumption.
- We've improved the Filter and Find features to better support large projects that need to scale.
- On the admin side, you will find more features under the Workload tab on the project details page.
The demonstration in Figure 1 introduces these updates and new features in the topology view.

Horizontal pod autoscaling
You can use horizontal pod autoscalers (HPAs) to autoscale your pods during periods of increased usage. In OpenShift 4.6, we've added a form in the web console to make it easier to create HPAs. As shown in Figure 2, you can use the form to quickly add one or more autoscalers to your Deployments and DeploymentConfigs.

When you create a new autoscaler, you need to ensure that you've set the CPU or memory limits. Once autoscaling is defined, you will longer be able to modify the pod count. You can also use the topology view to edit or remove HPAs that are associated with a Deployment or DeploymentConfig.
Improvements for Helm chart users
OpenShift 4.5 introduced new features for accessing and managing Helm charts. Now, we've added even more new features for Helm charts users. The OpenShift 4.6 console features a form-driven experience for working with Helm charts. We've also streamlined the UI so that charts with multiple versions added will only show up once in the catalog. Additionally, charts that aren’t compatible with the current Kubernetes version will not be shown in the OpenShift catalog.
Application monitoring
From the OpenShift console, you can now use the application monitoring dashboard to filter resource-specific metrics. By opening the Alerts tab, you can view alerts that are firing, silence them, and see at a glance what alert rules are configured for your project. Figure 3 shows the new Alerts tab.

OpenShift Serverless Eventing
The OpenShift Serverless Eventing component is now generally available with OpenShift Serverless 1.11. Eventing supports powerful application constructs such as event sources, brokers, and channels. Additionally, Camel K now extends event sources for Amazon Simple Queue Service (SQS), Amazon Kinesis, Salesforce, and other services.
Troubleshooting OpenShift Pipelines
We've improved the efficiency of troubleshooting build and pipeline failures so that you can fix problems quickly and get back to coding. You will now find failure details for pipeline runs and task runs on the details pages for each of these workflows. You can also locate this information from the side panel in the topology view, as shown in Figure 4.

Easier access to the Kiali UI
We've made it easier to access the Kiali user interface when Red Hat OpenShift Service Mesh is enabled on your OpenShift cluster. As shown in Figure 5, you can navigate to the Kiali dashboard from the topology view, and from the project overview and project pages.

As shown in Figure 6, we've also made it easy to know whether Service Mesh is active for the project in context.

Take a video tour of OpenShift 4.6
Do you want to know more about using the new features in OpenShift 4.6? Check out this video tour by Red Hat Developer Advocate Brian Tannous.
What's next for OpenShift?
Keep a lookout for new features coming in OpenShift 4.7. We are working on improvements, and we're excited about sharing them with our OpenShift developer community.
In the meantime, please let us know what you think of the new web console features in OpenShift 4.6! Hearing directly from developers helps us continually improve your experience on OpenShift. You can share your feedback by attending office hours on the OpenShift Twitch channel. Or, if you prefer, you can use this form to let us know your thoughts. We also invite you to join the OpenShift Developer Experience Google Group, where you can share your web console tips, get support from other developers, and provide feedback that will help us shape the future of OpenShift. Are you ready to get started? Try OpenShift today.
Last updated: November 20, 2020