The OpenJDK 8u 262 release includes several security-related patches and a new addition, JDK Flight Recorder (JFR). This article introduces OpenJDK developers to using JDK Flight Recorder with JDK Mission Control and related utilities. I will also briefly introduce you to Project Hamburg, also known as Container JFR.
About JDK Flight Recorder
JDK Flight Recorder is a troubleshooting, monitoring, and profiling framework that is deeply embedded within the Java Virtual Machine (JVM) code. It was first introduced in OpenJDK 11 as part of JEP 328. JDK Flight Recorder was available before OpenJDK 11 as a commercial feature only in JRockit, and then in the Oracle distribution of the Java Development Kit (JDK). Since JFR was released as a proper open source component in OpenJDK 11, a growing number of Java community members have wanted to make the feature available in older releases.
In 2019, during FOSDEM's Java DevRoom and the OpenJDK Committers Workshop, a group of OpenJDK committers decided to form a joint task force with the goal of backporting the necessary changes and fixes to OpenJDK 8u. A little over a year and many, many patches later, the project was finally merged with the main upstream OpenJDK 8u development tree.
The first public release was OpenJDK 8u 262; however, if you attempt to compile OpenJDK yourself, you will find that OpenJDK 8u 262 defaults to skipping JFR during compilation. OpenJDK 8u 272 (due in October) will be the first release to compile JFR by default.
Note: Developers who consume OpenJDK through Red Hat Enterprise Linux or Fedora get a Red Hat Package Manager (RPM) file that contains support for JFR. We would certainly like to hear about your experiences, especially regarding bugs or issues that you find.
JDK Flight Recorder under the hood
JDK Flight Recorder consists of two main components: One is the critical part containing the data, and the other is the internal infrastructure to record and expose the data. This data is abstracted via a concept called events. Events can have many kinds of useful information associated with them and can represent samples in time, single-trigger events, or a given time duration. As a developer, you can add metadata as well as other contextual information to an event definition and use that information to describe the event for your analysis tools, and also make it self-descriptive for other humans to better understand the event type. For example, you might want to be notified when file access happens or when a garbage collection (GC) compaction phase begins, or to know how long a full garbage collection phase took. Such events might contain fields that can be annotated—for example, to represent a Period or a Frequency—which JFR's tooling lets you visualize in a particular way during analysis. OpenJDK 8u includes more than 160 events for you to record and analyze.
Although those events are recorded when they happen, JFR itself is not a real-time tool and does not stream events at the point of call. (There is a JFR Event Streaming API in later OpenJDKs, but its purpose is not to stream events in real-time.) Instead, the underlying framework stores events in thread-local buffers that are then written to a global ring buffer. When those buffers are filled, they are finally flushed to disk by a periodic thread, using a mechanism that resembles the mechanism used by transactional databases.
Note: While JFR's design might seem overly complicated, it allows for efficient use of both memory and CPU. Generally, JFR's overhead is extremely low—about 1%, and in most cases, even less. The low overhead means that JFR can be (and is) used at production time, unlike most other solutions where the runtime cost is more prohibitive.
JFR recordings
JFR's recording file is a binary representation of all of the events and their metadata. This information is divided into chunks. A chunk is the smallest unit of self-contained information in a JFR recording that can be read separately and still completely describe the events contained within the chunk.
All of the information is encoded as LEB128 encoding integers, including strings that reference back to constant-pool positions. This encoding guarantees a high level of data compaction in each recording. You can also further compress recordings using methods like GZip, LZMA and XZ, or LZ4. Recordings are written to disk either on request or when the program terminates, based on configuration. You also can have endless recordings that are written to disk at intervals, letting you see the behavior of the application over time. In short, JFR's configuration options are flexible.
How to use JDK Flight Recorder
By default, a number of mechanisms are available to control JDK Flight Recorder in OpenJDK, which makes it extremely simple to adapt to the use case at hand. The first option is to start JFR directly with the JVM, for example:
$ java -XX:StartFlightRecording your.application.ClassName
You can use a comma-separated list of options to configure JFR further. As an example, you might want to dump the recording on exit:
$ java -XX:StartFlightRecording=dumponexit=true your.application.ClassName
You can use jcmd, a utility you might already be familiar with, to control JFR after application startup:
$ jcmd <pid>

<pid>:
The following commands are available:
VM.unlock_commercial_features
JFR.configure
JFR.stop
JFR.start
JFR.dump
JFR.check
VM.native_memory
ManagementAgent.stop
ManagementAgent.start_local
ManagementAgent.start
VM.classloader_stats
GC.rotate_log
Thread.print
GC.class_stats
GC.class_histogram
GC.heap_dump
GC.finalizer_info
GC.heap_info
GC.run_finalization
GC.run
VM.uptime
VM.dynlibs
VM.flags
VM.system_properties
VM.command_line
VM.version

help

For more information about a specific command use 'help <command>'.
Intuitively, the jcmd utility allows you to start and stop a recording, configure the recording settings, check the status of a recording, and dump a recording. It is possible to have multiple recordings running at the same time.
You can use the standard Java Flight Recorder API to access a recording directly from your application code. Some things are essential to understand when using the API, so I will discuss this option further and show you an example at the end of the article.
The other, arguably more useful method of retrieving recordings is via JDK Mission Control, an application specially designed to control and analyze recordings.
Note: You might have noticed the unlock_commercial_features flag in the list of available jcmd commands. It is important to be aware that JFR is not a commercial feature in OpenJDK. It is, however, a commercial feature in any Oracle JDK before JDK 11. We've kept the flag for compatibility reasons, but it does nothing, and you can safely ignore it.
Using JDK Flight Recorder with JDK Mission Control
OpenJDK contains a simple tool called jfr that allows you to read JFR recordings and get useful metrics from them. However, you will see the real benefits of JFR recordings when you combine them with JDK Mission Control (JMC). JMC is already available in Fedora and Red Hat Enterprise Linux (RHEL) 7 via Red Hat Software Collections (RHSCL), in RHEL 8 via the modules, and for Windows users from the OpenJDK developer portal. You can also obtain JDK Mission Control via a downstream distribution like AdoptOpenJDK.
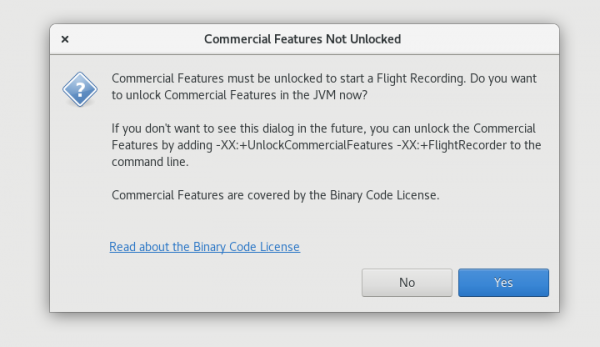
If you have an older installation of JMC, you might see a warning dialog when trying to access an OpenJDK 8u version with JDK Flight Recorder, asking if you are using a commercial feature. As I previously noted, you can ignore this message on OpenJDK (and on OpenJDK only). This bug has been fixed in later versions of JDK Mission Control. Figure 1 shows the commercial features warning.
Demo: Profiling GC allocation
JDK Mission Control Project Lead Marcus Hirt has prepared a fine set of tutorials and demos to explore using JFR and JMC together. Rather than creating a new demo, I will reference his code in this section. In particular, I will use his example of GC allocation behavior, 04_JFR_GC, to showcase JMC's ability to automatically analyze data and suggest improvements. JMC's analysis is based on a feature called the rules engine. The rules engine is currently being overhauled for JMC 8.0 in order to add more options for analysis, offer a better API for direct consumption via tooling, and improve overall performance.
The GC demo simply allocates a lot of data and stores it in a map. It then checks the contents of the map at every allocation cycle. Although a real-world program would do something more interesting with the data, the pattern represents a very typical use case with hash maps. In our case, the program seems to work fine, and we don't experience any out-of-memory errors or other types of errors. That makes the demo a perfect candidate for exploring hidden performance problems and checking for possible bottlenecks and optimizations.
Using templates
JMC and JFR have a handy feature called templates that allows you to start a recording with default settings and events. Those templates correspond to configurations that you can pass via the command-line interface (CLI) when retrieving recordings via jcmd, for example. However, the graphical user interface (GUI) makes it much easier to understand the settings. We will choose the profiling template and the default one-minute recording session for this experiment. That provides enough data for this demo.
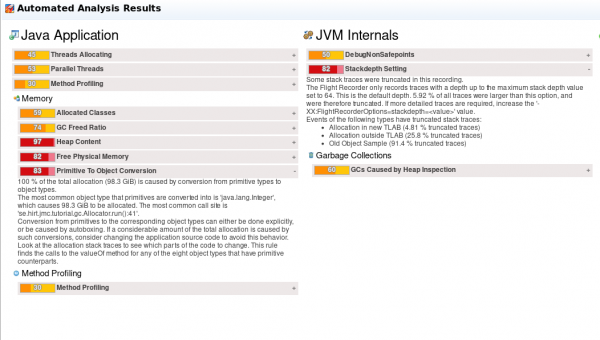
As shown in Figure 2, running the application and retrieving the recording gives us a direct answer to what we might want to optimize right away, without the need to research further. The application does a significant number of primitive-to-object conversions, and JMC tells you where those allocations occur.
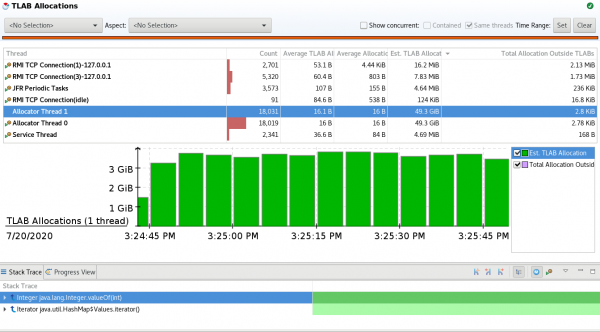
This demo was created for a hands-on session at Java One some years ago, and the JMC version at that time did not have an option for advanced analysis. Students in the session were encouraged to explore the Memory and the TLAB tabs to get a more detailed indication of the memory pressure, which you can see in Figure 3.
Note: The Analysis page in JMC 7 and later versions offers considerably more information, and is always improving with more rules and optimization strategies. JMC also provides the Analysis page as a standalone component exported as an HTML page. You can easily integrate JMC analysis into applications without using the full IDE. When used together with the JFR API, JMC's standalone analysis component lets you integrate robust monitoring and profiling solutions into your infrastructure while keeping memory overhead extremely low.
Memory profiling with JFR's Old Object Sample Event
Traditionally, for effective memory profiling, you would need to access and explore full heap dumps over time to check the GC roots and the allocation history. Another equally expensive option would be using methods like agents that sample object allocation via the Java Native Interface (JNI). That is not always possible, however, especially given the sensitive information contained in a full heap dump. JFR can help here, too, thanks to its Old Object Sample Event, which was backported to OpenJDK 8u.
Note: If you are interested in knowing more about JFR's Old Object Sample Event, I once again point you to a blog post by Marcus Hirt. You should really check out his blog. It's an incredible source of information, tricks, and details about profiling, JMC, and JFR.
We'll use another small and self-contained example to explore JFR's Old Object Sample Event. It's a rather obvious example when you read the code, but nevertheless very good for exploring our options.
public class Leaks {

   private static final Map<Object, Object> SESSION_DATA = new HashMap<>();

   public static class UserInformation {
      private byte[] data = new byte[10000];
   }

   public static void main(String[] args) {
       String userId = "user";
       while (true) {
           UserInformation user = (UserInformation) SESSION_DATA.get(userId);
           if (user == null) {
               user = findUserInformation(userId);
               // SESSION_DATA.put(userId, user); // Correct
               SESSION_DATA.put(user, user);      // Wrong
           }
           sleep();
       }
   }

   private static UserInformation findUserInformation(String userId) {
       sleep();
       return new UserInformation();
   }

   private static void sleep() {
       try {
           Thread.sleep(1);
       } catch (InterruptedException e) {}
   }
}
The mistake highlighted in the code is the sort of error quick testing catches before going to production, but for the sake of example, let's assume it's a bug in our code that found its way into production. Figure 4 shows a JFR session where we've turned on Old Object Sample Event profiling. (No heap dump was harmed during this session.)
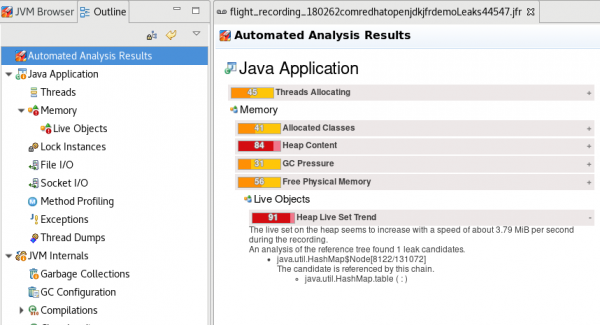
The analysis instantly tells us where to look: A hash map has been filled over and over, and not only contains an increasing number of objects, but the memory allocation is also high. Even without reading the code, you would expect this map to be filling objects in a loop without much control. As shown in Figure 5, the Memory tab reveals even more.
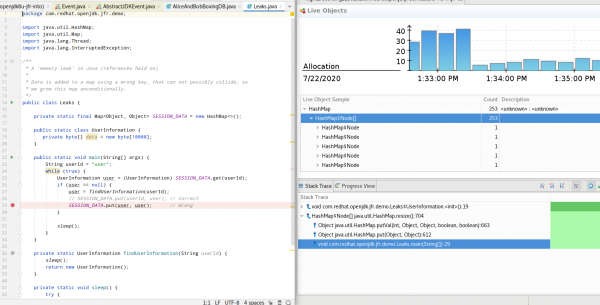
In this tab, we see the program code alongside the Live Object page. The stack trace with the line numbers points out exactly where the problem is.
A note about profiling
Being able to track object allocation and retention is one of the most critical tools when analyzing memory problems. I recall a bug that was challenging to fix because the number of created objects was huge, but only when running the application's UI via a remote X11 connection. In addition, objects were created every time the user moved the mouse or clicked a button, causing many methods to recalculate the position of the graphical interface, but only in some cases.
The two behaviors were linked because there was a bug in how we handled the remote connection: Calculating their position required knowing the relative position of objects on the screen. Because it was a remote connection, numerous X11 atoms were created and passed back and forth over the wire. If the user had multiple applications running, this would mean even more traffic. The Java code would end up intercepting those atoms, creating a Java representation, doing more calculations, and repeat.
At the time, we didn't have access to JMC, but to a similar tool called Thermostat. We used our integration with Byteman to create a script to analyze where those objects were created and why the code path that led to the creation of those objects was exercised differently. That is hard to do with regular method profilers because they tend to aggregate the results. Having this information handy directly from a JFR recording is incredibly important and would have saved us time. More so, when considering that a customer can simply send you the recording from their deployment rather than having you try to reproduce errors locally, install more tooling, open ports, start agents, and so on. In this case, the recording is all that is needed.
The JDK Flight Recorder API
Earlier, I mentioned that JFR comes with an internal API. The API resides under the jdk.jfr namespace and contains classes that allow you to manage recordings and create custom events for your application.
The most straightforward program that you can write is for checking whether JFR is available:
public class CheckJFR {
   public static void main(String[] args) {
       boolean isAvailable = FlightRecorder.isAvailable();
       System.err.println(isAvailable);
   }
}
You can then use the API to start and stop the recording programmatically from your application. For example, the following class is an abstraction to create a JFR manager:
import java.io.File;
import java.nio.file.Path;
import java.util.HashMap;
import java.util.Map;
import jdk.jfr.Configuration;
import jdk.jfr.Recording;

public class LocalJFR {
   private Map<Long, Recording> recordings = new HashMap<>();

   @Override
   public long startRecording(String configName) throws Exception {
       Configuration c = Configuration.getConfiguration(configName);
       return startRecording(new Recording(c), "jfr-recording");
   }

   @Override
   public long startRecording(String configName, String recordingName)
       throws Exception
   {
       Configuration c = Configuration.getConfiguration(configName);
       return startRecording(new Recording(c), recordingName);
   }

   @Override
   public long startRecording() throws Exception {
       return startRecording(new Recording(), "jfr-reopenjdk-jfr-2cording");
   }

   public long startRecording(Recording recording, String name)
       throws Exception
   {
       long id = recording.getId();
       Path destination = File.createTempFile(name + "-" + id,
                                              ".jfr").toPath();
       recording.setDestination(destination);
       recordings.put(id, recording);
       recording.start();
       return id;
   }

   public File endRecording(long id) throws Exception {
       Recording recording = recordings.remove(id);
       recording.stop();
       recording.close();
       return recording.getDestination().toFile();
   }
}
While this is the simplest event that you can define:
@Label("Basic Event")
@Description("An event with just a message as payload")
public class BasicEvent extends Event {
   @Label("Message")
   public String message;
}
Creating and monitoring JFR events programmatically
Eric Gahlin, one of the authors of JFR in OpenJDK, put together a comprehensive list of demos and smaller tests using the JFR API. The API is part of the Java specification starting from OpenJDK 11 but is not part of the specification in OpenJDK 8, so not all OpenJDK implementations will have access to it.
To facilitate porting and migration between versions, we created a simple compat-jfr with an empty implementation. This package allows users to instrument their code, create custom events, and use the API to manage recordings. The implementation is empty, however, so the methods don't do anything, events are not committed to memory or to disk, and when queried, JFR reports as not available and cannot be started. The application will function, compile, and run correctly, and is great for compatibility. You can use the compact-jfr either as a dependency on the command line or by adding it to your JDK's jre/lib/ext directory.
In addition to creating custom events via the Event API, you can also instrument your code after the fact to add events to a running application. JMC also has a convenient tool for this, with the brilliant name of Agent. The JMC Agent uses a set of configurations to define events and then instruments the running code with them. Once the session is over, the instrumentation is removed. If you are familiar with Byteman (and you should be), Agent is very similar, but instead of a full Turing complete language at your disposal, Agent focuses on JFR events alone. The reduction in scope allows us to focus specifically on the problem of instrumenting JFR with more fine-tuned tools, which also partially solves issues like security and permissions. We are also working on a JMC plugin to control and configure Agent, it's a work in progress but is already useful and you can find it here.
Using JFR with containers (Project Hamburg)
All of the tools described in this article are fantastic because they let you fine-tune JDK Flight Recorder for your specific deployment. However, we realized there is still a significant amount of work required from developers using JFR within containers. First and foremost, the receiving end of JFR needs to have an open connection via the Java Management Extensions (JMX). This connection can (and should) be secured, of course, but a container platform like Red Hat OpenShift Container Platform (OCP) could disallow or make it difficult to leave internal ports open to the external world. It is also complicated to track multiple processes at once without the use of higher-level tooling. OpenShift has the deployments console to help you with this task, but a more general solution is still needed.
For this reason, we created a project called Container JFR, also known as Project Hamburg. Container JFR is a simple three-tier application that contains a controller agent that connects via JMX within the container to the various applications and exposes a web services interface to the external world. The JMX connection can be hidden within the container—even in a non-container world, i.e. can be behind a firewall—while the web services interface is secured via authentication. The interface allows you to control multiple JVMs from the same endpoint, so it's great with multiple deployments.
The other component is a web UI that uses web services. It adds simplicity to the management, but above all integrates the automated analysis feature from JMC, so that you can see the application performance right away and only decide to download the recording if the analysis points to certain issues. The project also contains a Grafana data source that lets us create graphs within the browser (so that users can integrate recordings in their dashboards, for example); an experimental Prometheus exporter (which isn't the best way to consume the recordings but nevertheless can be useful); and last but not least, a comprehensive set of Operator APIs for OpenShift or Kubernetes. Using these Operator APIs allows you to install, run, and configure the project with a simple mouse click.
Note: Gunnar Morling has written a comprehensive blog post about using custom, application-specific JFR events to monitor a REST API. The post illustrates the streaming API and custom JFR events, so I'll point you there for further details. Gunnar is the best!
Conclusion
JDK Flight Recorder is the first monitoring and profiling tool available for OpenJDK that can expose such a high level of information without adding a tax on the runtime system. JFR offers that level of information because it is deeply integrated within the JVM. Being able to create custom events using either the Event API or the Agent tool lets you take advantage of JFR from an application perspective, too, and not just from the runtime.
OpenJDK was a massive contribution of code to the public, and JDK Flight Recorder is arguably the most significant contribution since OpenJDK was open sourced. When Oracle open sourced JDK Flight Recorder and JDK Mission Control, they did an incredible service to the Java community, which should be acknowledged. The backport to OpenJDK 8u is finally bringing this infrastructure to all of the actively maintained versions of the OpenJDK.
Although we hope that you have migrated to a later version of OpenJDK to benefit from all of the additional features and performance improvements, the addition of JFR in your toolbox will help your applications perform better, faster, and more trouble-free on any version of OpenJDK.
Acknowledgments
I would like to thank:
- Marcus Hirt for his work as a project lead for the JDK Mission Control project. He truly sets the standard high when it comes to community engagement, and his blog is an incredible source of inspiration and knowledge.
- Gunnar Morling for helping out and testing Container JFR early in its development and for his feedback and suggestions.
- Red Hat's JDK Mission Control team for their amazing contributions to JMC, and for their work on Agent, the JFR Compact, and Container JFR.
Finally, a huge thank you to the original JDK Flight Recorder team for this fantastic technology, and to Oracle for open sourcing it. Speaking of amazing, did you know that JMC won the best Java Feature contest in 2020?
Additional resources
Here are the resources mentioned in this article, as well as interesting additional links to presentations, articles, and source code that you can use to learn more about JDK Flight Recorder and JDK Mission Control:
- An introduction to middleware application monitoring with Java Mission Control and Flight Recorder (FOSDEM presentation, 2019)
- JMC & JFR—2020 vision (FOSDEM presentation, 2020)
- More about the JFR compatibility API for OpenJDK 8
- Low overhead method profiling with Java Mission Control (Marcus Hirt, 2013)
- Compressing flight recordings (Marcus Hirt, 2019)
- Using Java Flight Recorder with OpenJDK 11 (Laszlo Csontos, 2018)
- More about the Container JFR project
- More about JDK Mission Control
- Source code and examples for understanding how to create and use custom events with JDK Flight Recorder (Gunnar Morling, 2020)
- Flight Recorder samples: Code snippets illustrating how to use the JDK Flight Recorder API
- jmc-jshell: An easier way to experiment with the JDK Flight Recorder and the JMC core classes
- Introduction to JmFrX: a small utility to capture JMX data with JDK Flight Recorder (Gunnar Morling, 2020)
