The Vertical Pod Autoscaler (VPA) allows Red Hat OpenShift cluster administrators to automatically set Kubernetes CPU and memory requests and limits for their containers. The VPA is able to apply recommendations directly to your Kubernetes pods by reviewing past metrics history to apply up-to-date resources for each pod. In Red Hat OpenShift, you can install and configure the Vertical Pod Autoscaler Operator, which manages and deploys the necessary VPA components to autoscale your workloads.
However in the past, our team has noticed user issues with using the VPA on its default resource and API queries-per-second (QPS) settings. Users have found that the VPA components in larger clusters require more resources than the default settings provide. This raises an important question: what happens if you need to provide resource recommendations for the VPA components? What are the optimal resource settings for the VPA?
In this article, I will describe the benchmarking process I used to determine better resource configurations for the VPA components to help cluster administrators fine-tune their VPA settings. I will also explain how we arrived at our final recommendations.
Background
In the official Red Hat OpenShift documentation for the VPA operator, there is a new section in versions 4.15+ which contains a table with baseline recommendations for CPU/memory requests depending on the number of containers you estimate to be in your cluster. Cluster administrators who might not have a good idea of what to use for their container request and limit numbers can use that table as a baseline. Additionally, the table has recommendations on how to set their kube-api-qps and kube-api-burst numbers, which dictates how many requests each component can send to their cluster’s Kubernetes API to prevent API throttling.
Historically, the VPA has had limited documentation on performance. The official upstream VPA GitHub mentions, "VPA performance has not been tested in large clusters". While "large" is a somewhat vague term, it’s clear that there is little data on the resources the VPA components require and utilize. Additionally, our team was unsure of the exact workload metric that directly influences VPA resource usage—whether it’s tied to the number of pods, containers, or VPA custom resources (CRs).
Based on the clusters we’ve analyzed, what we observed was that resource usage in each VPA component seemed to scale upwards indefinitely. This implies that if you manage a "large" cluster, the VPA components could be throttled due to insufficient resource requests, as the VPA Operator’s default settings for each component may not be adequate. We also discovered that the kube-api-qps and kube-api-burst parameters for each component, which are parameters specifying API request limits to the Kubernetes API, may not be high enough to handle the volume of API requests generated by these components.
This required some benchmarking, experimentation, and code-diving in order to figure out roughly how much the VPA components use in terms of resources and API requests, and how someone might want to set these configurations to fit their specific cluster.
VPA core components
The following is a brief background on each of the VPA components:
Recommender
The VPA recommender is the heart of the VPA which computes the actual recommendations that are set for a Pod. The recommender retrieves all
VerticalPodAutoscalercustom resources and its associated workloads, inspects the historical and current resource usage of each workload container using the Metrics API, provides a recommendation based on its recommendation algorithm, and then sets the recommendation in the VPA CR object itself.Updater
The VPA updater is able to evict pods that are determined to be stale based on the current recommendations made by the recommender. It does not actually apply the recommendations. This is performed by the admission plug-in.
Admission plug-in
The VPA admission plug-in (also known as the "admission controller") is responsible for setting up a Kubernetes mutating webhook admission server. The webhook reacts to Pod creation events and checks for a matching
VerticalPodAutoscalercustom resource. If a VPA object exists and is valid, it will then set the recommendations for the pods configuration. Note that the Vertical Pod Autoscaler Operator only allows one admission pod as of OpenShift 4.18.Vertical Pod Autoscaler Operator
The VPA operator pod creates, manages, and ensures the above three core components. It does not scale with the cluster’s workloads and resources. Therefore, there were no notable results in benchmarking the operator.
Figure 1 depicts a simplified flow diagram of a single example showing how the VPA works.

The phases shown in Figure 1 are as follows:
- A pod managed by a controller (in this case, a deployment named
deployment-ex) is created. - A
VerticalPodAutoscalerCR object is created and references the deployment. - After a minute or so, the recommender fetches metrics for each container from the Kubernetes Metrics Server and recommends resources by updating the VPA object. In this example, there is one container in the pod.
- Then the updater notices the container resource requests/limits does not match the recommendation and evicts the entire pod.
- The Deployment (ReplicaSet) controller restarts the pod and the pod creation event is sent to the VPA webhook.
- The admission plug-in handles the webhook request, checks the associated VPA, and responds to the webhook request with the new recommended resource values.
Benchmark methodology
First, I created a reusable bash script that would set up all the necessary components needed to run the benchmark tests. In the script, I divided the test into multiple phases, depending on the type of workload I was trying to test. Then I further broke the phases into steps where workloads would slowly scale up to test the linear relationships between each VPA component and the benchmarking test workloads.
Metrics
In order to perform any benchmarking, I had to figure out exactly what metrics I wanted to track during the course of a VPA benchmarking test. Of course I wanted to know the average amount of CPU and memory that each component was using, but I also wanted to track the overall health of the cluster and the Kubernetes API Server. Therefore, I split the metrics into three main categories: CPU, memory, and API performance.
I used OpenShift’s built-in monitoring stack and queried the Thanos Querier component which aggregates core OpenShift metrics including metrics collected by Prometheus. I used various PromQL queries to obtain metrics served through the Thanos Querier service.
Details on the metrics are provided below:
CPU:
- The benchmark queries the instantaneous rate of the
container_cpu_usage_seconds_totalmetric. This effectively gives the per-second rate of increase of CPU usage in seconds. I then average over the last 5 minutes. In terms of PromQL, I used irate instead of rate since CPU usage changes very fast. - In each test step, I obtained the median, max, min, and mean of this metric over the last 5 minutes. I used mean when graphing the data for the results, but the other statistics can be found in the raw benchmark logs in the GitHub repository that I linked later in the article.
Note:
In the original benchmark, I used the following query:
sum by (pod)(avg_over_time(irate(container_cpu_usage_seconds_total{namespace="vpa-benchmark",container!="",image=~".*vertical-pod-autoscaler.*",pod=~"vpa-COMPONENT-PODHASH"}[5m])[5m:])).However, the query I should have used is:
sum by (pod)(rate(container_cpu_usage_seconds_total{namespace="openshift-vertical-pod-autoscaler",container!="",image=~".vertical-pod-autoscaler."}[5m])).The original query retrieves the last 5 minutes of data, takes the last 2 data points every 30 seconds, and averages those 10 instantaneous rates to get the final value. What I actually intended was to simply get the average usage over the past 5 minutes. However, this difference should not significantly affect the results.
Memory:
- The benchmark queries the
container_memory_working_set_byteswhich is an estimate of how much memory cannot be evicted from the container in bytes. Again, I get the average of this metric over the last 5 minutes and use that in the results. - As with CPU, I obtained median, max, min, and mean. But I only use mean in results.
For example:
sum by (pod)(avg_over_time(container_memory_working_set_bytes{namespace="vpa-benchmark",container!="",image=~".*vertical-pod-autoscaler.*",pod=~"vpa-COMPONENT-PODHASH"}[5m:]))
- The benchmark queries the
API Performance:
The benchmark queries multiple metrics for this category:
- Average number of API Requests per second.
- Average VPA webhook admission duration.
- Average API Server request latency.
Test phases
In the benchmark, there were four main test phases:
Deployments:
In this phase, I started with 64 deployments (with 1 pod and 1 container), and 64 VPA CRs in the first step. After sleeping for 5 minutes and obtaining benchmarking data, I scaled to 256 deployments with the same ratio of pods and containers. Then I scaled to 1024 deployments and 1024 VPAs and gathered our data.
Deployment with increased Pods:
This phase is identical to the Deployments phase, except for the fact that I tried 2 replicas and 4 replicas per deployment for each step.
Deployments with increased containers:
This phase is also identical to the deployments phase, except for the fact that I tried 2 containers and 4 containers per pod for each step.
Rate limiters:
The last test phase is focused on testing the effect of different
kube-api-qpsandkube-api-burstconfigurations on each VPA component under the same heavy load. I tested with a rate limit QPS/Burst of 40/80 for each VPA operand component separately, then with a rate limit QPS/Burst of 80/160. Finally, I tested with increased QPS/Burst for all components at once, and again with memory-saver for the recommender enabled.
Test workloads
For each test step, I used a deployment and an associated VPA CR for each singular workload. The deployment had initial requests and limits for the VPA recommender to recommend limits as well. Each VPA CR was specified with a maximum allowed resource cap of 10m and 50Mi for CPU and memory respectively, and a minReplicas of 1 so that the VPA could evict deployments with 1 replica.
The low resource limits were put in place to test more workloads on our test infrastructure. Since our maximum workload size is 1024 deployments with 4 containers, this equals 4096 containers which will request ~200Gi and ~40.96 cores from the entire cluster.
Results
After running the benchmark over a large enough cluster, I was able to gather the results into multiple CSV files, and use a Python script to generate graphs for each test phase. These are only a few of the generated graphs for each benchmark. You can find the full results and the benchmark script in the GitHub repository linked at the end of this article.
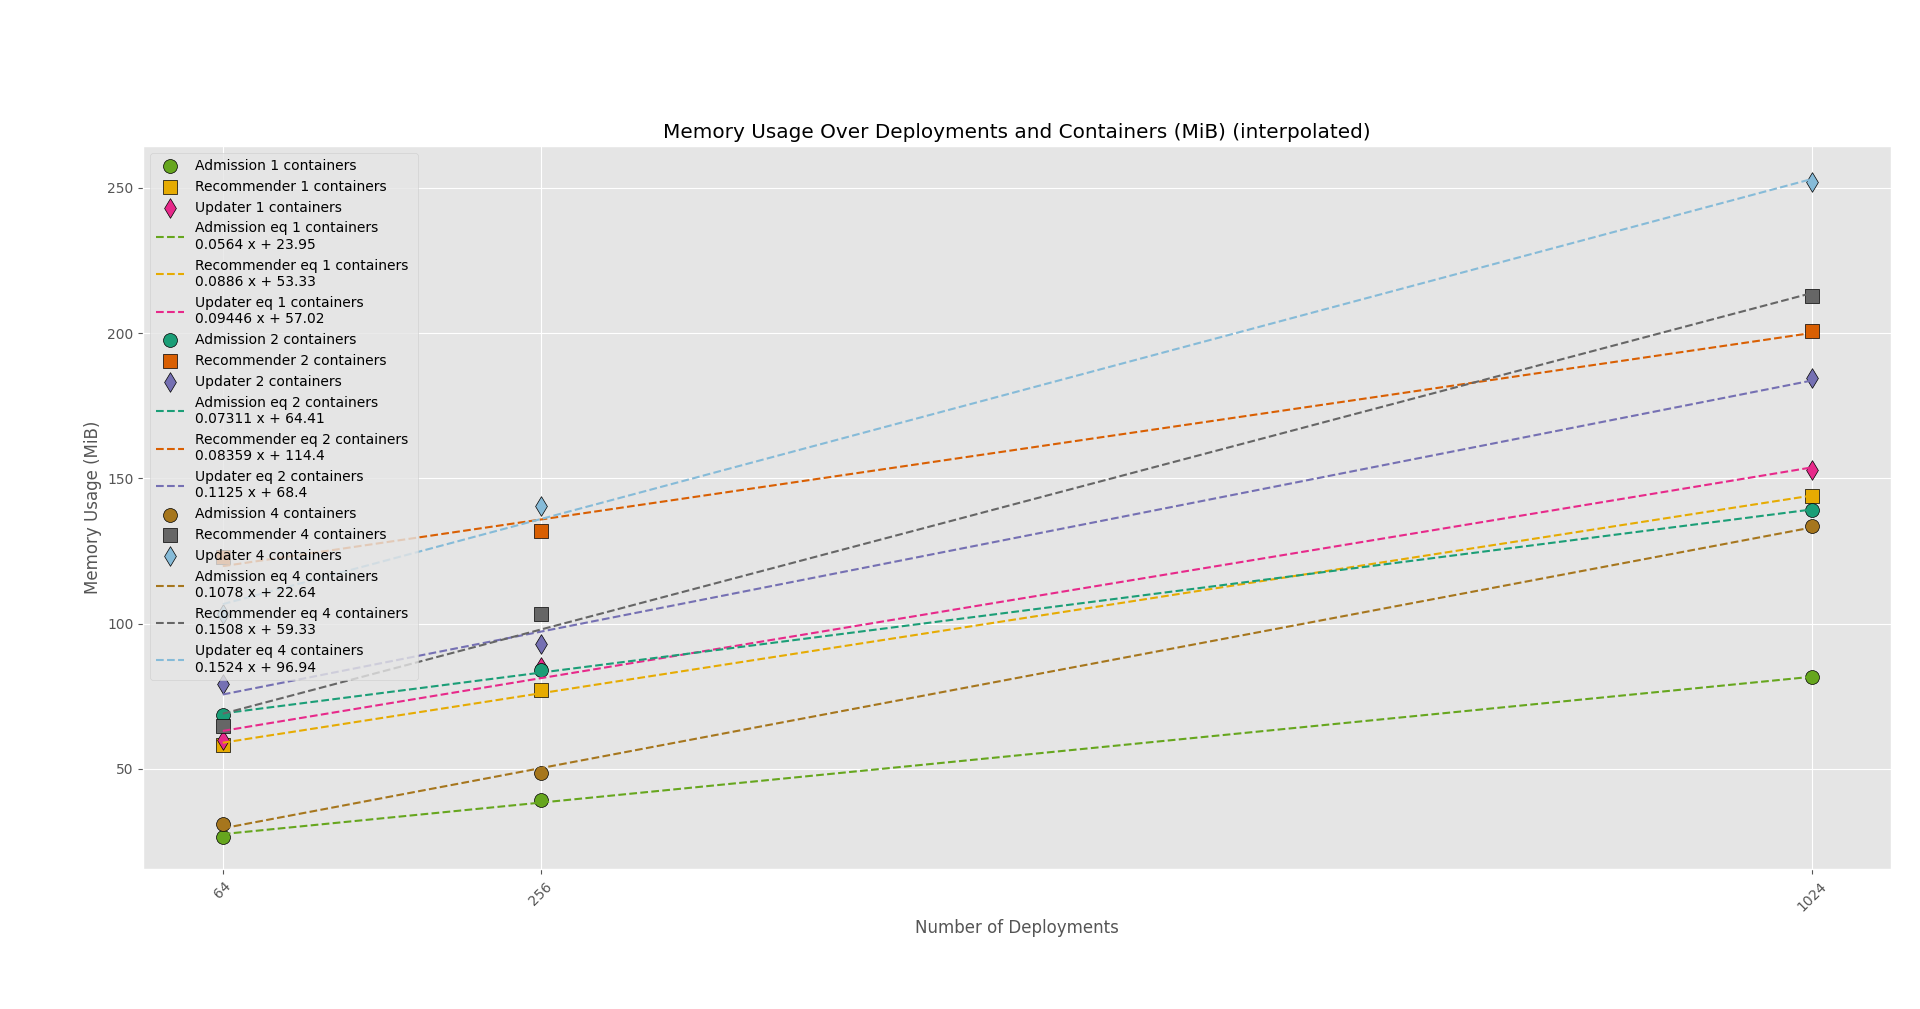
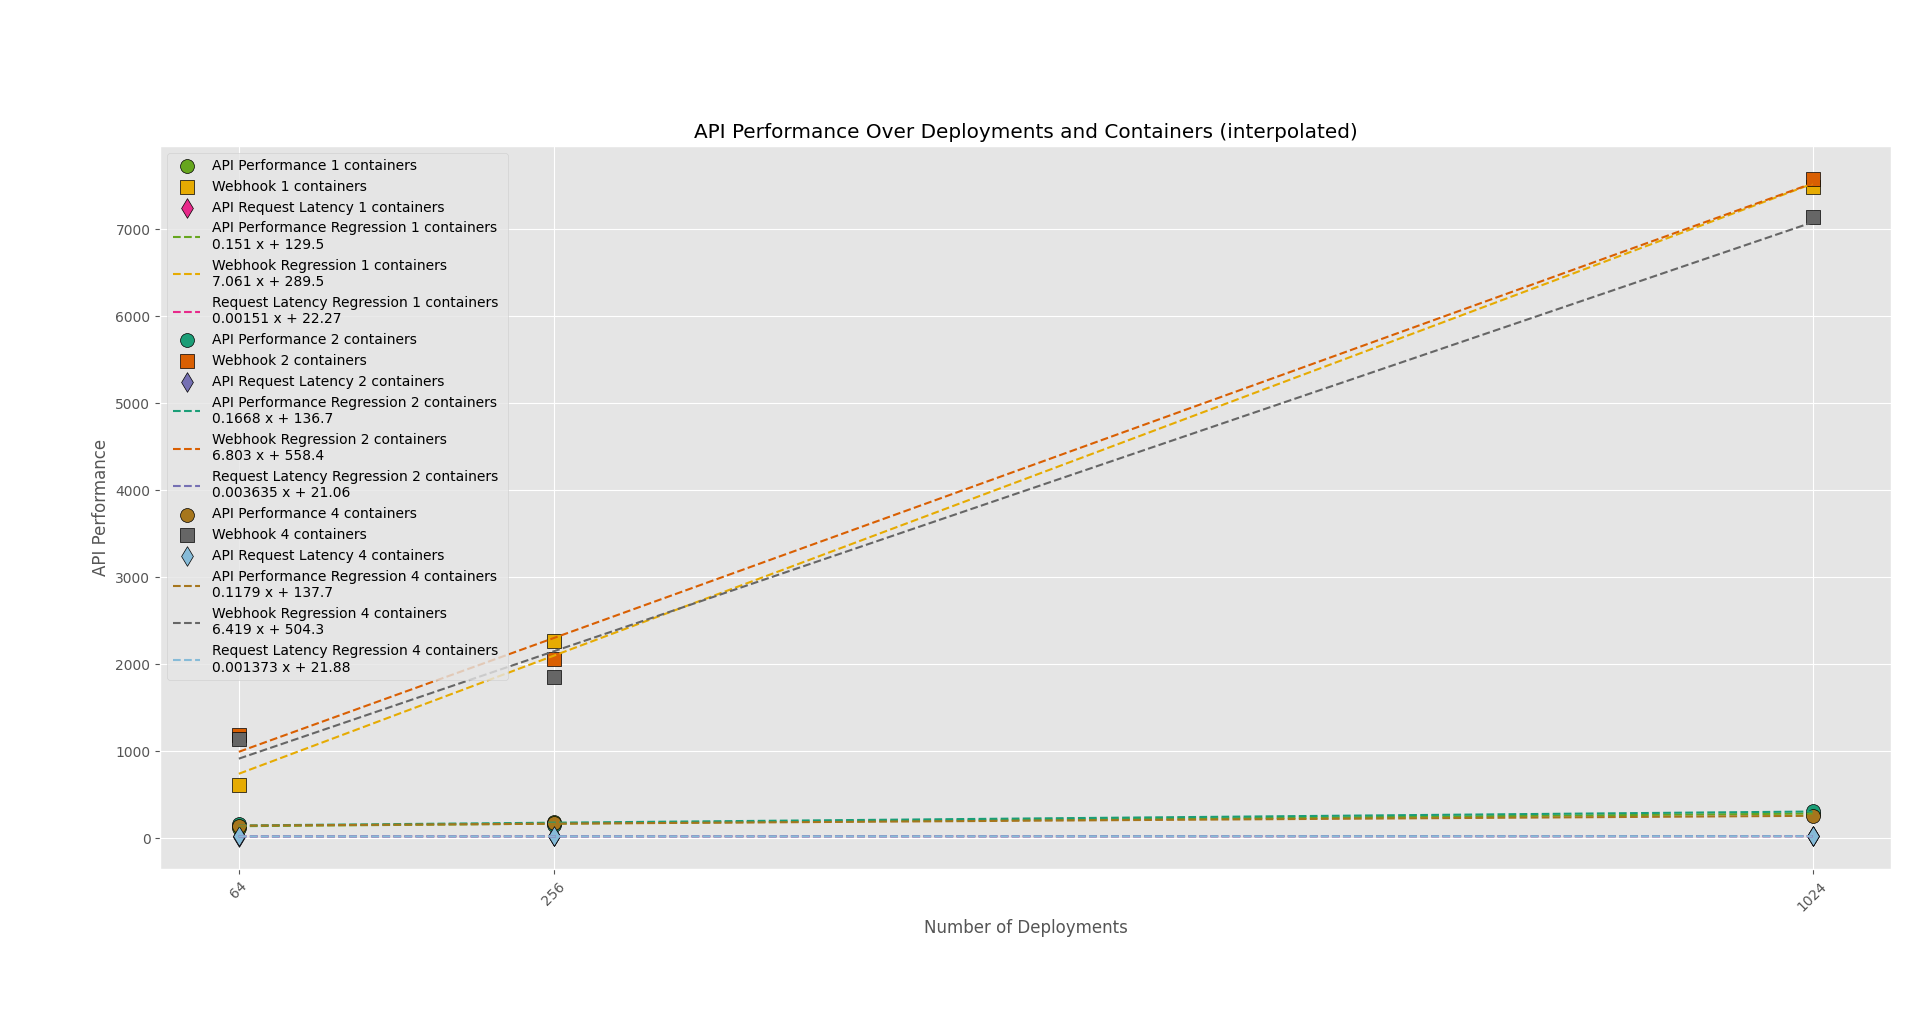
Deployment scaled CPU, memory, and API benchmarks
The following CPU/Memory/API benchmark graphs (Figures 2-4) show the effect of increasing the number of deployments on each VPA component pod’s CPU and memory usage as well as the effect on some API performance metrics. The graphs also include data for deployments with increased containers per pod, or deployments with increased pods, to show how an increased number of pods/containers per deployment affects resource usage. Note that I only display the graphs of the "deployments with increased containers" phase in Figure 2.

API rate configured CPU, memory, and API benchmarks
The following tables (Figures 5-7) show how VPA component QPS rate limit/burst configurations affect CPU, memory, and API performance metrics. The first few columns record the data from specifying different QPS/Burst for each VPA component individually. Then I tested increasing QPS/Burst for all components at once, from 40/80 QPS/Burst to 80/160 QPS/Burst. Lastly, I tested the effect of the recommender memory-saver feature on 80/160 QPS/Burst for all components.
Step (640 deployments, 1 container) | Admission | Recommender | Updater |
|---|---|---|---|
Admission 40/80 QPS/Burst | 42.53m | 35.10m | 57.63m |
Recommender 40/80 QPS/Burst | 36.54m | 67.55m | 42.06m |
Updater 40/80 QPS/Burst | 38.52m | 44.05m | 60.81m |
All 40/80 QPS/Burst | 30.59m | 54.94m | 41.23m |
All 80/160 QPS/Burst | 29.76m | 53.69m | 67.24m |
All 80/160 QPS/Burst w/ memory-saver | 33.34m | 43.57m | 34.52m |
Step (640 deployments, 1 container) | Admission | Recommender | Updater |
|---|---|---|---|
Admission 40/80 QPS/Burst | 60.68MiB | 113.04MiB | 115.11MiB |
Recommender 40/80 QPS/Burst | 62.34MiB | 121.93MiB | 121.42MiB |
Updater 40/80 QPS/Burst | 61.20MiB | 117.56MiB | 122.75MiB |
All 40/80 QPS/Burst | 62.11MiB | 133.36MiB | 128.22MiB |
All 80/160 QPS/Burst | 60.93MiB | 127.77MiB | 130.83MiB |
All 80/160 QPS/Burst w/ memory-saver | 64.71MiB | 127.90MiB | 131.18MiB |
Step (640 deployments, 1 container) | API Request Rate | VPA Admission Webhook Latency | API Request Latency |
|---|---|---|---|
Admission 40/80 QPS/Burst | 220.99req/s | 4991.98ms/req | 24.65ms/req |
Recommender 40/80 QPS/Burst | 241.14req/s | 4977.72ms/req | 23.97ms/req |
Updater 40/80 QPS/Burst | 253.62req/s | 5395.56ms/req | 35.29ms/req |
All 40/80 QPS/Burst | 252.97req/s | 5613.33ms/req | 40.41ms/req |
All 80/160 QPS/Burst | 262.34req/s; | 5551.15ms/req | 42.25ms/req |
All 80/160 QPS/Burst w/ memory-saver | 257.05req/s | 5585.93ms/req | 32.47ms/req |
Requests and limits
This benchmark was able to determine that containers are the driver for increased resource usage in the VPA components. Overall, the benchmark results suggest that the VPA updater pod consumed the most resources, while the VPA admission plug-in pod consumed the least. This makes sense considering that the admission webhook server reacts to webhook requests, while the recommender and updater are constantly doing work in a loop.
To derive the resource request numbers that are present in the documentation, I first generated the graphs seen in the Results section using Python. It was also able to generate a linear regression equation for each test step, and I refitted and used those equations to calculate the resource request numbers.
Kubernetes API QPS and burst limits
Benchmarking the QPS/burst yielded surprising results. Overall, it didn’t seem like the QPS/burst changes affected each component’s resource usage very much. It also did not seem to affect the overall cluster health much as well, however, enabling memory-saver did seem to reduce API request latency.
So, since it was still unclear to me how one might adjust their QPS and burst limits, I instead elected to do some digging into each component’s algorithms and use math to derive the estimates from the table.
Note:
The memory saver feature is able to save memory by ignoring pods in the cluster that lack a corresponding VPA and by not storing any recommendation history for them. Since there were not many pods in the cluster compared to the benchmarked generated pods, it makes sense as to why there wasn't a noticeable result here.
Admission
Initially, I assumed that there would be at least one API request per pod creation since the pod might need to fetch an associated VPA or controller. But because the admission controller uses Kubernetes client-go informers, it doesn't need to send extra API requests. Instead, it watches important resources such as VerticalPodAutoscalers, Deployments, DaemonSets, and other well-known controllers that manage pods.
However, if you're using the Vertical Pod Autoscaler on custom resources in VPA Operator 4.18, the admission server must send explicit API requests to fetch information on these custom resources.
Therefore, the QPS and burst settings for the admission controller depend on how it handles custom resource pod creation events. During each pod creation, the admission server searches for an associated VPA object. If the VPA object exists and references a custom resource target that implements the /scale subresource (with the labelSelector field), the admission server will issue queries to the /scale subresource per pod creation. During my experiments and code digging, I noticed that each pod creation event issued two of these kube-api queries.
If you're a cluster admin and do not use the VPA on custom resources, the default QPS and burst settings should usually be enough on a mid-sized cluster. However, if you do use the VPA on custom resources, you need to account for the highest possible surge of custom resource pod creations in your cluster.
For example, let’s say you have a QPS of 10 and a burst of 10, and you apply 10 custom resource pods at once. The first 10 API requests will go through immediately because the burst allows them. After that, any additional requests will be throttled, with the next 10 requests spread over the following second. If we assume t=0 at the completion of the 10th request, the 11th request will be sent at t=100ms, the 12th request at t=200ms, and so on, until the 20th request is completed. This is because 10 queries per second means in a second (1000 milliseconds), throttling would schedule each query to be sent 100ms apart. We want to avoid throttling altogether, hence the burst should be set to custom resource Pod Creation Surge * 2 (since there are 2 API queries per creation), and the QPS limit should equal the custom resource Pod Creation Surge.
Note:
These benchmark results were conducted using the Vertical Pod Autoscaler version 1.2.0. Results may vary for other versions due to code changes.
Recommender
The recommender runs in a loop that runs every minute and watches VPA CRs and associated pods in the cluster. It builds an in-memory model of the resources and then fetches real-time metrics using the Metrics API from each container. After calculating recommendations, the recommender configures the associated VPA CRs, maintains any VPA checkpoints, and performs garbage collection on its in-memory state.
Let’s consider a scenario with 500 VPA objects managing 500 pods, and a default QPS of 5 for the recommender. The recommender needs to fetch metrics for each pod, but that’s typically a single query to the Metrics API. However, the VPA configuration step might require updating all 500 VPAs. With a QPS of 5, this would take 100 seconds to complete the updates (500 / 5 = 100).
To ensure the loop completes within 60 seconds, we want the VPA configuration step to at least finish in half the time (30 seconds), leaving time for checkpoint writing and garbage collection. This means the QPS should be set to 16.67 (500 / 30 ≈ 16.67), and the burst should be roughly double the QPS to handle spikes. (Figure 8).

Alternative approach:
Instead of increasing the QPS, you could extend the recommender's recommender-interval configuration to match the time it takes to complete the loop, which would also provide additional time for checkpoint writing. For instance, with a QPS of 5, updating 500 VPAs would take at least 100 seconds (500 / 5 = 100). In this case, you could set the recommender-interval and checkpoints-timeout to 200 seconds. The tradeoff is that recommendations and checkpoint updates would occur less frequently, which could delay scaling adjustments if resource usage changes rapidly. Although the recommender-interval and checkpoints-timeout configurations are not officially documented by Red Hat for the Vertical Pod Autoscaler Operator, it is one possible approach to reduce VPA load by distributing it over time.
Updater
The updater runs in a 60-second loop by default, watching all VPAs and their managed pods. It compares the pods’ resource limits and requests with the recommendations in the corresponding VPA objects. If the resource allocations are incorrect (based on configured ratios), the updater evicts the pods to apply the new resource limits.
For instance, with 500 VPAs and 500 pods, if all require updates, the updater could need to evict up to 500 pods per loop. With a default QPS of 5, this would take 100 seconds. Like the recommender, setting the QPS to 16.67 would allow the updater to complete this task within half the time. Again, we can apply the set the Burst to twice the QPS, ensuring it can handle potential spikes.
Note:
The recommender and updater components also use Kubernetes client-go informers to watch well known controllers, VPAs, and other important resources, and hence also suffer the same problem as the admission plug-in where it must send additional external API requests if working on a custom resource attached with a VPA object. We did not include the same tables for those components as the admission controller because the bottlenecks are instead "updating VPA objects for the recommender" or "evicting pods for the updater".
What does this mean for you?
This purpose of this article is to provide transparency about how our team benchmarked and came up with those numbers in our documentation. If you are new to the Vertical Pod Autoscaler, you may find those numbers useful to set as initial resource requests and kube-api-qps/burst, depending on the size and configuration of your cluster. Note that we tested the benchmark on our internal clusters, so they may not be representative of a real-life cluster. These values merely serve as a good starting point.
You might be wondering: wait, can’t I just try using the Vertical Pod Autoscaler on the VPA component pods themselves? What is stopping me?
Using the VPA on itself
As of OpenShift 4.18, attempting to use the Vertical Pod Autoscaler (VPA) on itself (i.e., creating a VerticalPodAutoscaler CR object for the admission plug-in, recommender, updater, and operator pods), using the default updateMode can lead to issues. Specifically, you may observe that your VPA pods are continuously restarting every updater interval (which is one minute by default).
Why? The problem arises from the interaction between the VPA components:
- First, the recommender provides resource recommendations for the VPA components.
- After one recommender interval, these recommendations are patched into the corresponding
VerticalPodAutoscalerCR objects for each VPA component. - The updater detects that the VPA component pods need to be recreated to apply the new recommendations, and it evicts the existing pods.
The race condition
The issue happens when the singular admission pod, which is required to handle webhook requests that update pod requests and limits, is evicted. This creates a race condition.
Two scenarios can happen:
- The admission controller is able to serve the pod creation request of itself (its replacement), and then subsequently is evicted. The admission pod revives with updated resource request numbers.
- The admission pod is deleted before serving its replacement’s pod creation webhook event. So the admission pod restarts without being updated.
As you can see, the admission pod might never get updated with the correct recommendations. This can lead to problems, including potential downtime for the VPA components if they are restarted every minute.
Additionally, even if the admission pod is successfully updated, as your cluster scales and accommodates more containers, new resource recommendations could trigger further evictions, restarting the admission race condition. Unfortunately, this is also due to the fact that the admission pod runs as a singleton.
If you want to safely self-scale the VPA components, it's best to turn VPA scaling mode for these components to Initial and manually apply the recommendations generated in the VPA CRs. To promote high availability for the VPA, we are planning to add the ability to configure the number of admission replicas in the cluster.
Summary
As workloads increase, resource usage increases linearly. Try the Vertical Pod Autoscaler Operator on Red Hat OpenShift to auto scale your workloads without touching your requests and limits. Development for InPlaceVerticalScaling is underway which would remove the need to evict pods, eliminating restart downtime for all autoscaled workloads and allowing fluid VPA self-scaling. Read more...
If you have questions, go to my GitHub where you can find the benchmark scripts and results.