The developer experience in Red Hat OpenShift Container Platform 4.4's web console now includes a metrics-based dashboard. With this dashboard, you can access insights into your application metrics instead of relying on external tools. This Tech Preview feature is available in the Developer perspective’s Monitoring section, providing access to the dashboard, metrics, and events. Monitoring information is also available on the resource side panel, accessible within the Topology and Workloads views.
Monitoring Dashboard
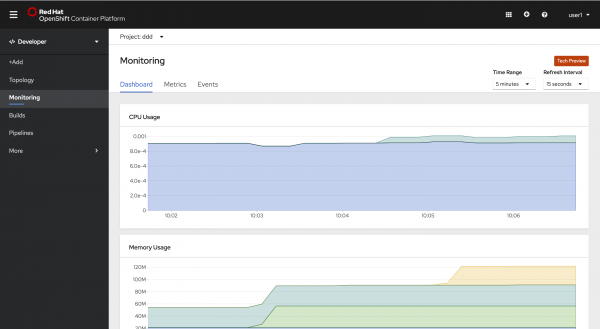
The Monitoring -> Dashboard page can be found under the Monitoring section of the Developer perspective, as shown in Figure 1. The dashboard features 10 metrics charts that display metrics for the project in context. The charts provide insight into various metrics including CPU Usage, Memory Usage, Receive Bandwidth, Transmit Bandwidth, Rate of Received Packets, Rate of Transmitted Packets, Rate of Received Packets Dropped and Rate of Transmitted Packets Dropped.
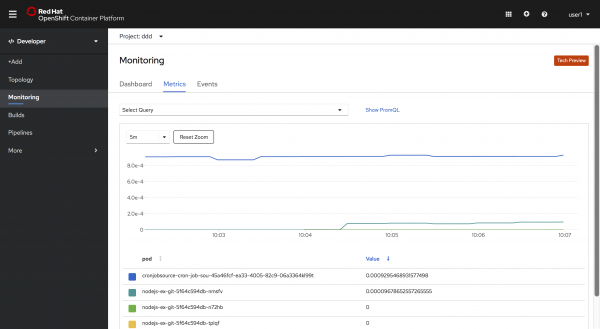
Clicking on a chart allows you to gain more insight into the metrics, including a list of all pods and associated metrics values, as shown in Figure 2.
Monitoring Metrics
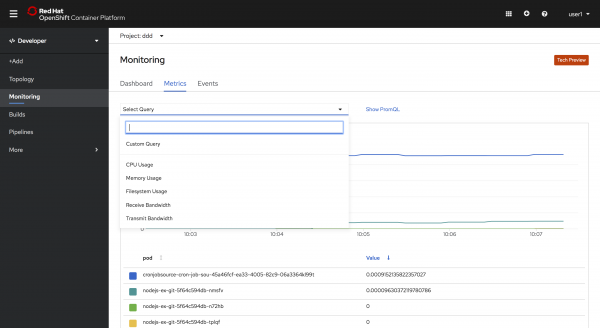
The Metrics page is now available in the Monitoring section, as shown in Figure 3. This page includes five out-of-the-box queries while retaining the ability to perform custom queries.
Monitoring Events
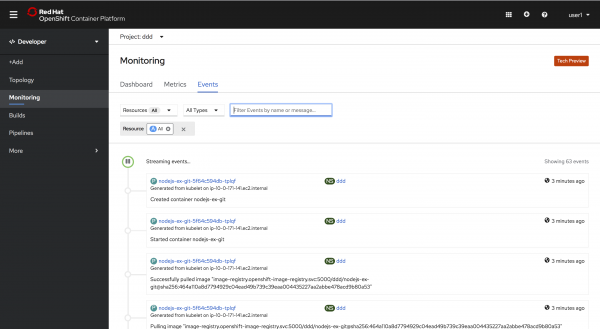
You can view events associated with your project on the Events page in the Monitoring section, as shown in Figure 4.
Monitoring with Topology
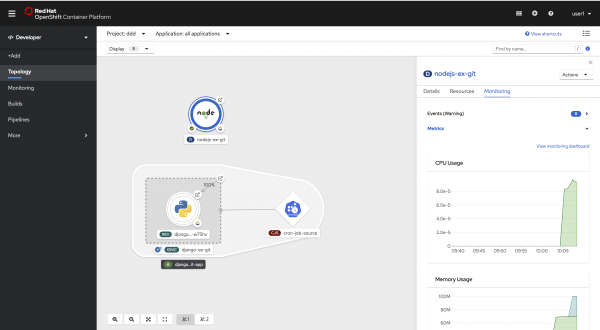
A new Monitoring tab is available on the side panel of the Topology page. This tab displays associated events and metrics associated with the selected workload and is only displayed when a workload is selected. The Metrics section includes CPU Usage, Memory Usage, and Receive Bandwidth charts, and a link to view the monitoring dashboard with the selected resource in context, as shown in Figure 5.
The Monitoring section is our first step in providing an application monitoring solution for the developer, allowing them to troubleshoot problems with their applications. We are already thinking about what’s coming in future releases like saving custom queries, additional out-of-the-box queries, adding alerts, and the addition of a notification drawer.
Ready to get started?
Provide your feedback
Share your thoughts here and give us your feedback or ideas for improving the application monitoring experience. Join our OpenShift Developer Experience Google Group to participate in discussions and learn about our Office Hours session where you can collaborate with us and provide feedback.
Learn more
If you’re interested in learning more about application development with OpenShift, learn more from Application development on OpenShift.
Last updated: June 29, 2020
