Last year, I wrote a blog post how to remotely debug your ASP.NET Core container on OpenShift with Visual Studio Code. Today I introduce how to remotely debug a pod using Visual Studio from your Windows computer. Sometimes you encounter an issue that happens only in the production environment. Remotely debugging a pod enables you to investigate such an issue.
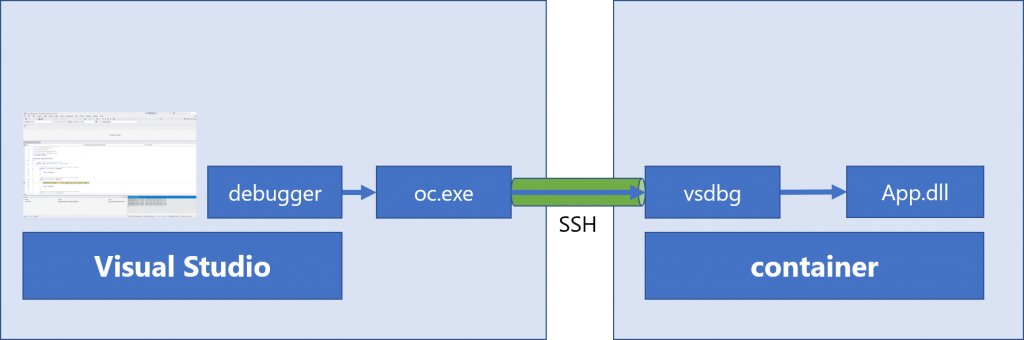
Visual Studio and Visual Studio Code now support SSH as a transport protocol for remote debugging. If a remote host accepts an SSH connection, Visual Studio can do remote debugging using Visual Studio's default feature. However, you need to use the oc command instead of an SSH client such as putty since Red Hat OpenShift pods don't allow direct connections via SSH. The MIEngine debugger enables you to use any command for SSH connection.
Note:
All the steps below have been confirmed using a combination of Visual Studio 2017 (versions 15.7.2 and 15.8 preview2) on Windows 10 and OpenShift 3.9.
Set Up Your ASP.NET Core Pod
The procedure for setting up the ASP.NET Core pod is almost same as what I wrote before for Visual Studio Code. Here is a summary.
Debug Build
A debug build works fine for remotely debugging. If you use the .NET Core s2i image, the build is a release build by default. You can change to a debug build by specifying the DOTNET_CONFIGURATION build environment variable, as shown below:
$ oc set env bc DOTNET_CONFIGURATION=Debug
Disable Health Check
Disabling health check is not mandatory but it is recommended because a pod could be restarted while the process is paused during remote debugging. You can remove the readiness check to prevent an unintended restart.
Install the vsdbg Binary in the Pod
The vsdbg binary is a product from MIEnginer by Microsoft. You can install vsdbg in a pod as follows:
$ oc rsh
# curl -sSL https://aka.ms/getvsdbgsh | bash /dev/stdin -v vs2017u5 -l ~/vsdbg
Start a Remote Debugging Session
The detailed steps are described in the MIEngine wiki. I describe some of the points here.
First, you need to create a launch configuration file. This is similar to the launch.json file for Visual Studio Code but not exactly the same. Here is an example. Please replace the path to the oc.exe file and the name of the pod so they are appropriate for your environment.
{
  "version": "0.2.0",
  "adapter": "c:\\path\\to\\oc.exe",
  "adapterArgs": "exec -i  -- /opt/app-root/vsdbg/vsdbg --interpreter=vscode",
  "languageMappings": {
    "C#": {
      "languageId": "3F5162F8-07C6-11D3-9053-00C04FA302A1",
      "extensions": [ "*" ]
    }
  },
  "exceptionCategoryMappings": {
    "CLR": "449EC4CC-30D2-4032-9256-EE18EB41B62B",
    "MDA": "6ECE07A9-0EDE-45C4-8296-818D8FC401D4"
  },
  "configurations": [
    {
      "name": ".NET Core Attach",
      "type": "coreclr",
      "cwd": "/opt/app-root/app",
      "processId": "1",
      "request": "attach",
      "justMyCode": false,
      "sourceFileMap": { "/opt/app-root/src/": "${workspaceRoot}" }
    }
  ]
}
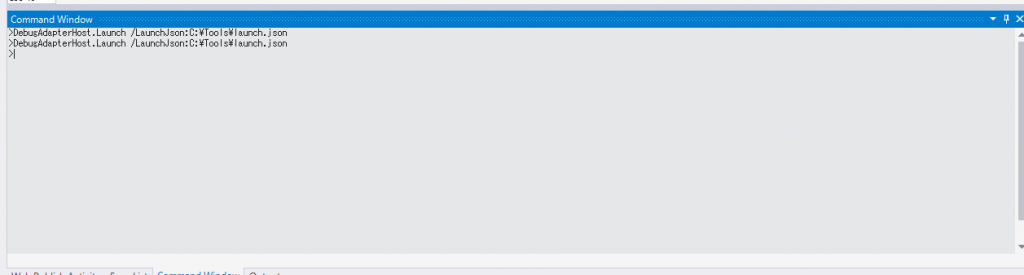
Then, open the project which has already synced with the running application in Visual Studio. Select View->Other Windows->Command Window in Visual Studio. You can start the remote debugging session by executing the command DebugAdapterHost.Launch /LaunchJson:"" in Command Window.
You can put in a breakpoint so the process will be paused at that point.
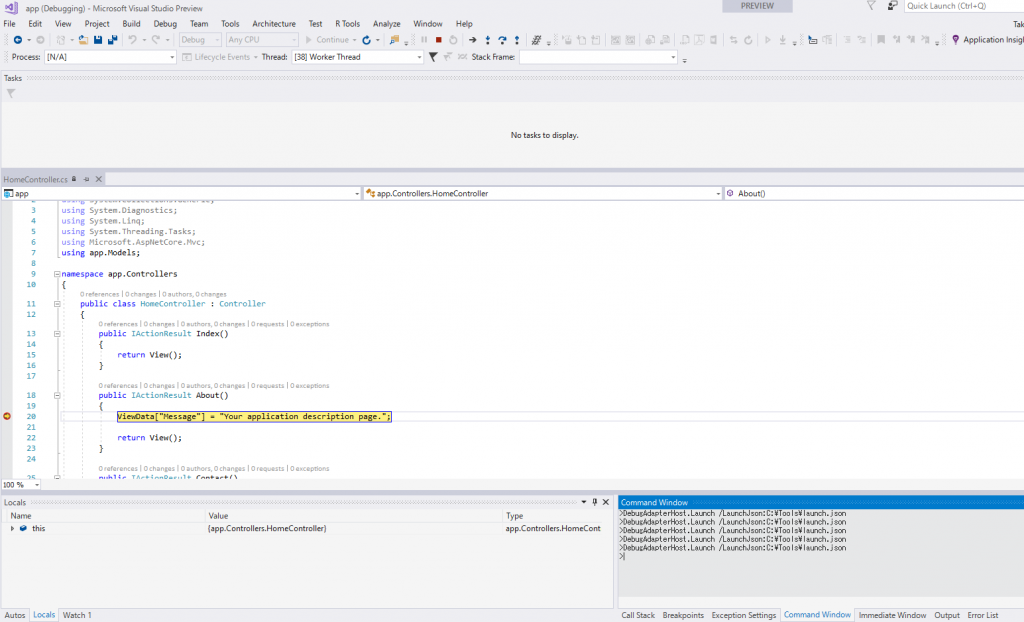
Now you can see the actual values of variables in the source code. Your favorite Visual Studio debugging feature is available for ASP.NET Core on OpenShift. You can execute your code line by line with the step execution feature.
Last updated: September 19, 2023