Do you want to speed up your debugging process? This blog post is designed to help you do just that by empowering you with the knowledge of how to debug RHMAP Cloud Apps and MBaaS services locally using VS Code. For an introduction to running RHMAP client apps locally, see How to Setup your Apps to Target Locally on Device.
Why VS Code?
- Interactive Debugger allows you to step through source code, inspect variables, view call stacks, and execute commands in the console. (This is the reason I switched)
- Lightning fast source code editor
- Git integration
- 1000s of extensions that are effortlessly installable
- Helps you be instantly productive with syntax highlighting, bracket matching, auto-indentation, box-selection, snippets...
- Available on MacOS, Linux, and Windows
Prerequisites
- VS Code (https://code.visualstudio.com/download)
- Cloned the RHMAP source code repos locally
Set up VS Code
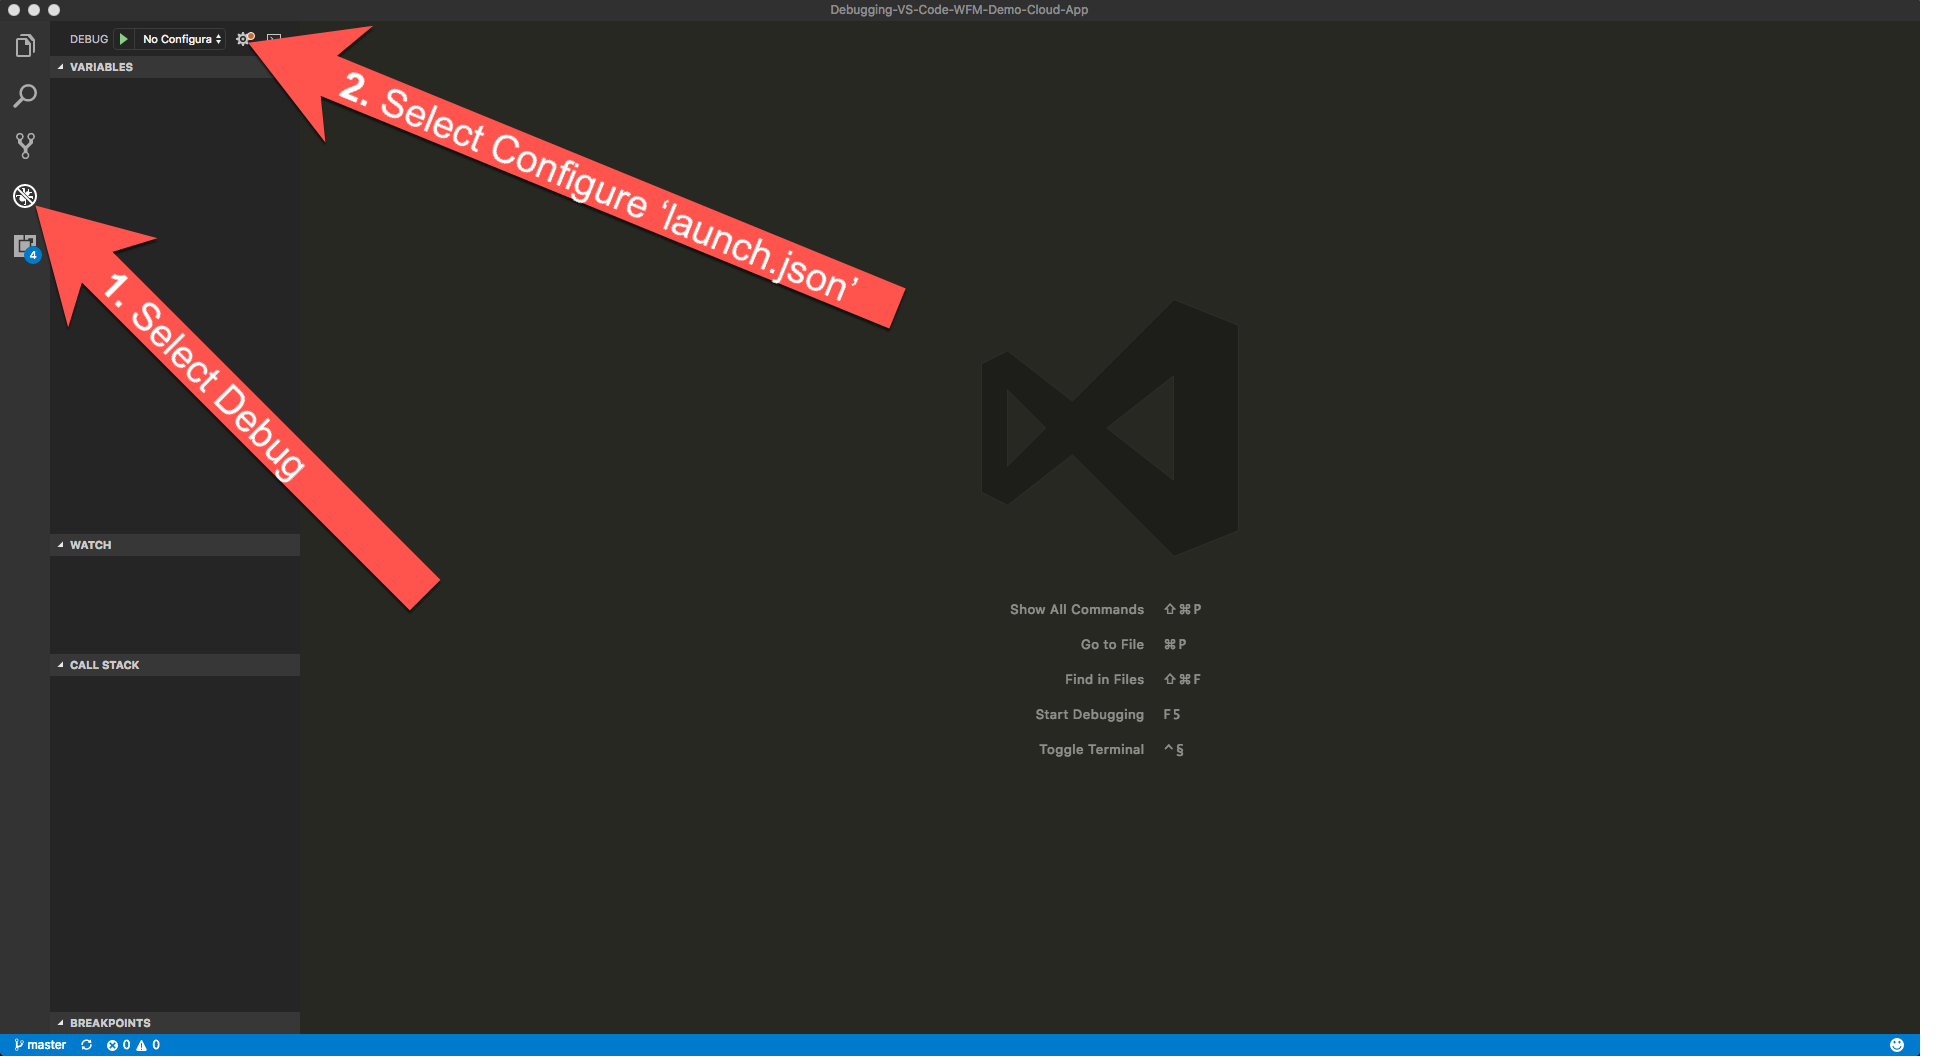
Step 1 - Create VS Code Launch Configuration for your RHMAP App
- Click the Debug option on the Activity Bar.
- Click the Configure “gear icon” on the Debug view top bar and VS Code will generate a
launch.jsonfile under your workspace's.vscodefolder. - Select
Node.jsas the environment.
Step 2 - Set up the Launch Configuration for your RHMAP App
Launch configurations are where the magic happens. These can and will differ for different apps but for our RHMAP apps, there shouldn’t be much to change.
The main change is mapping your local env variables from your Gruntfile.js or other env variables that exist.

Inside your launch.json replace the following code:
Before:
{
  "type": "node",
  "request": "launch",
  "name": "Launch Program",
  "program": "${workspaceRoot}/application.js"
}
After:
{
  "type": "node",
  "request": "launch",
  "name": "Launch Program",
  "program": "${workspaceRoot}/application.js",
  "cwd": "${workspaceRoot}",
  "env": {
    "FH_USE_LOCAL_DB": "true",
    "WFM_AUTH_GUID": "iidn3tvprs62asdebat5m3eg",
    "FH_SERVICE_MAP": "{\"iidn3tvprs62asdebat5m3eg\":\"http://localhost:8002\"}"
  }
}
NOTE - FH_SERVICE_MAP:
FH_SERVICE_MAP defines the mappings from your cloud app to your services. You will notice how the structure of FH_SERVICE_MAP is different from the rest of the Gruntfile. A function cannot be specified in a launch configuration; therefore, you need to set the value as a stringified object. The object key is the service id and the object value is either a locally running instance of the service or a remote instance using the services current host. Details for these are found on the services details page in RHMAP.
List of Launch configuration attributes: https://code.visualstudio.com/docs/nodejs/nodejs-debugging#_launch-configuration-attributes
More debugging information: https://code.visualstudio.com/docs/editor/debugging
Debugging
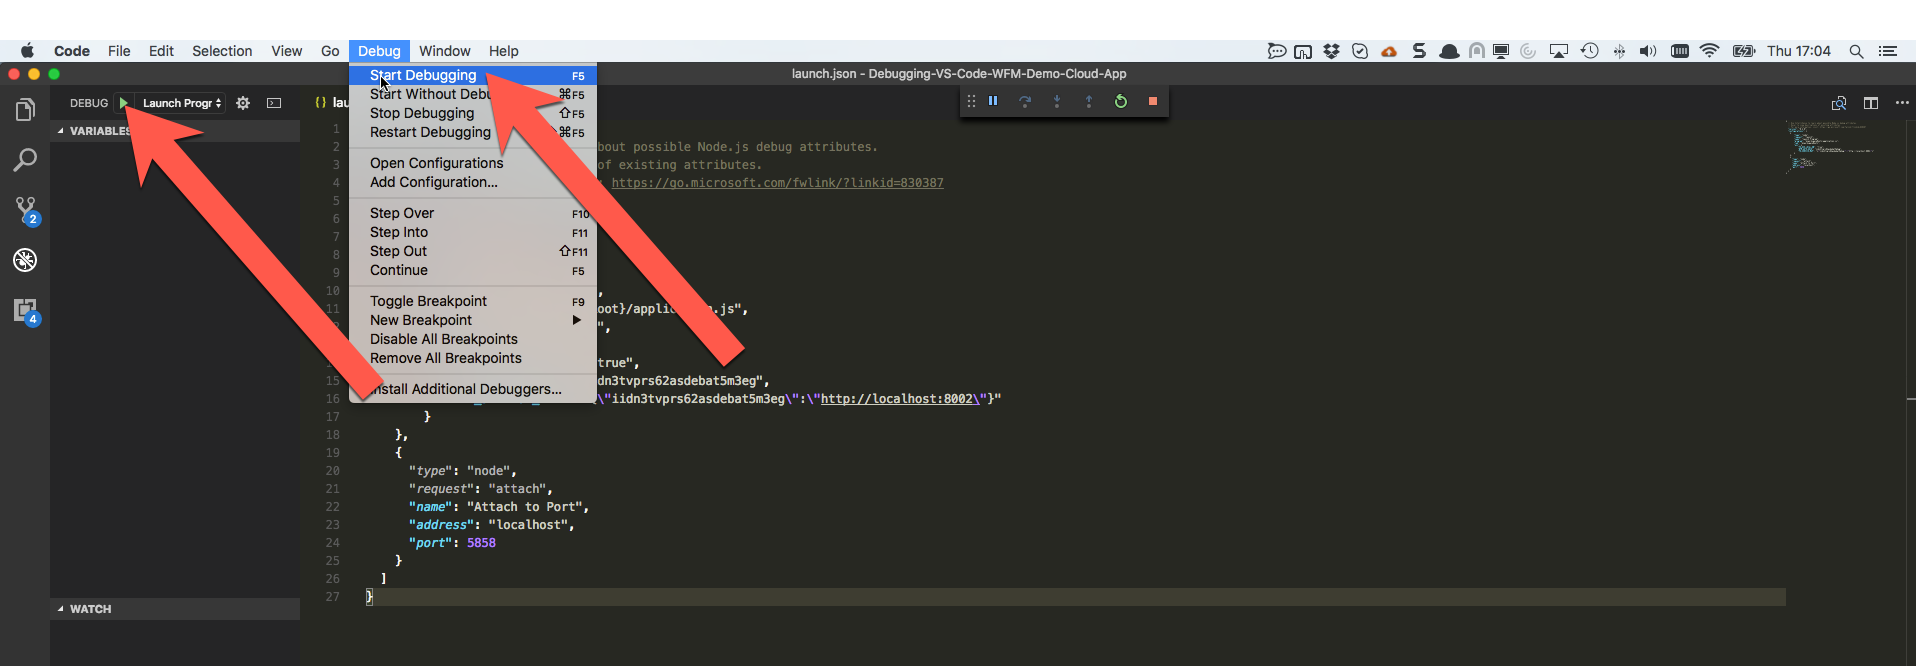
Starting Debugging
F5 or Debug menu or Green Play button
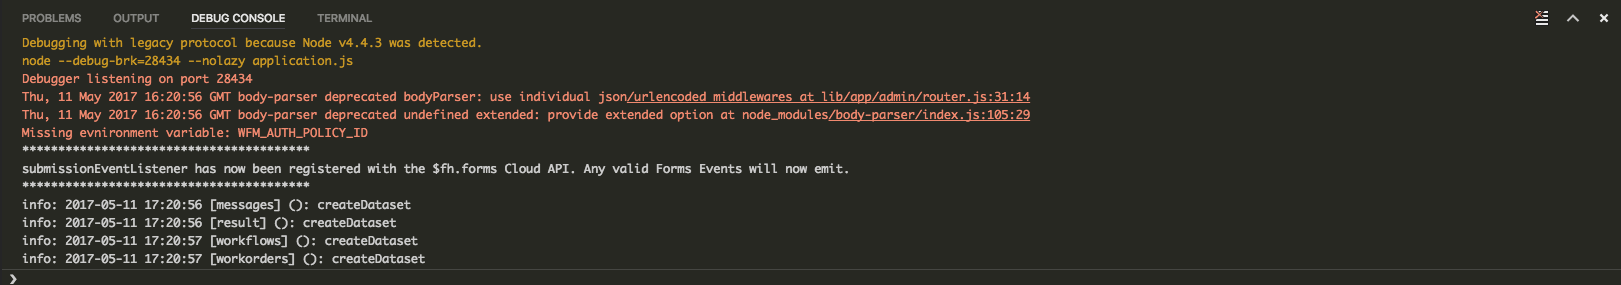
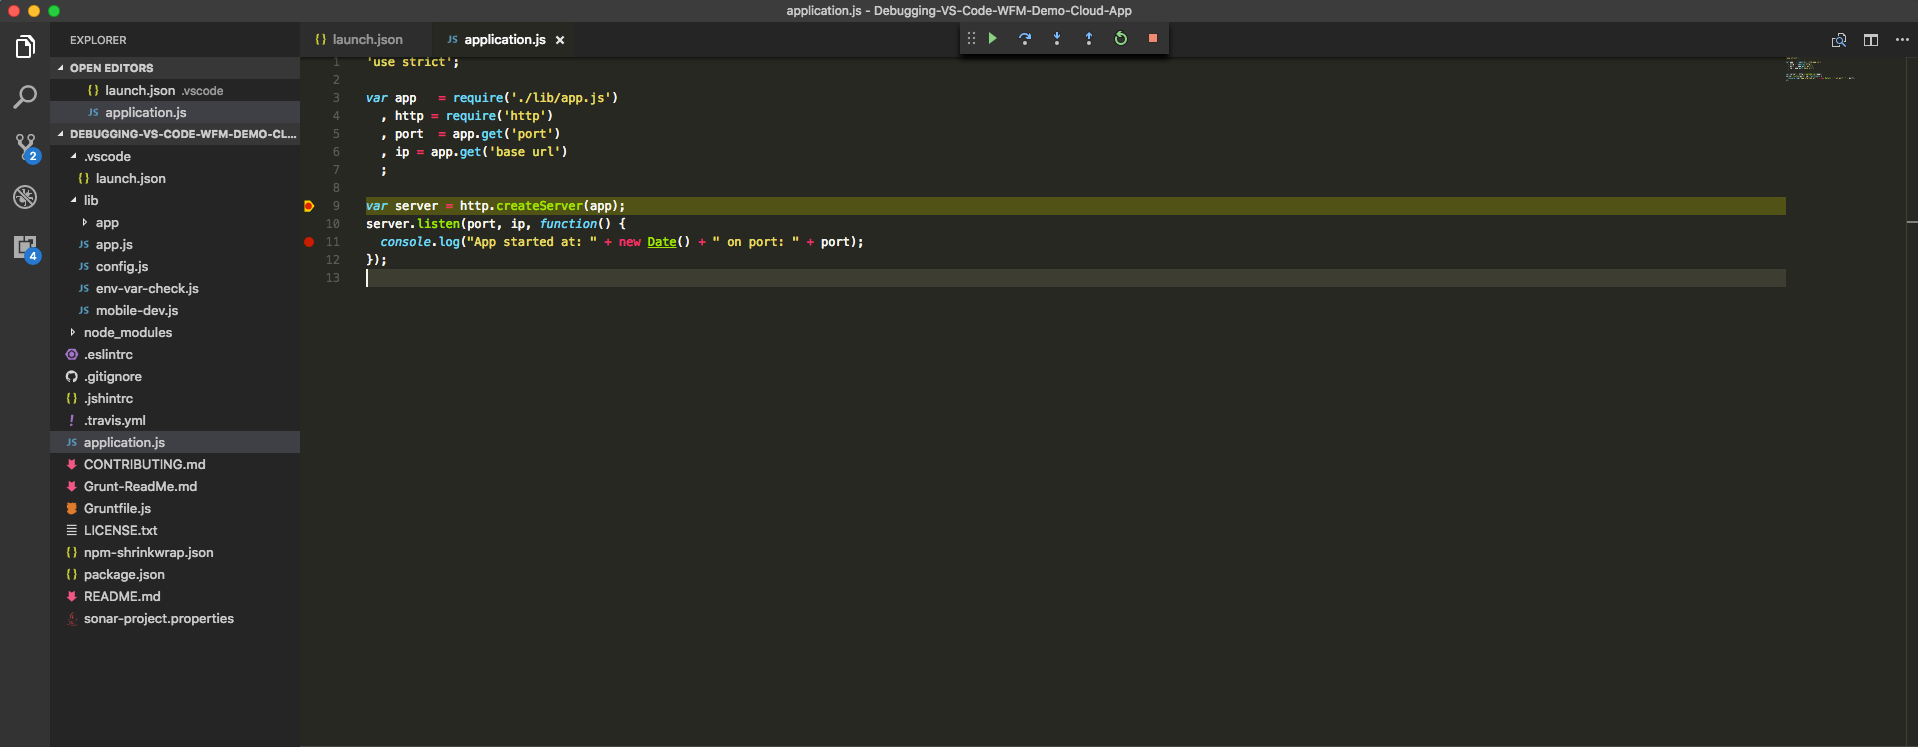
Verify local debugging is working as expected by checking the DEBUG CONSOLE (⇧⌘Y or View > Debug Console).
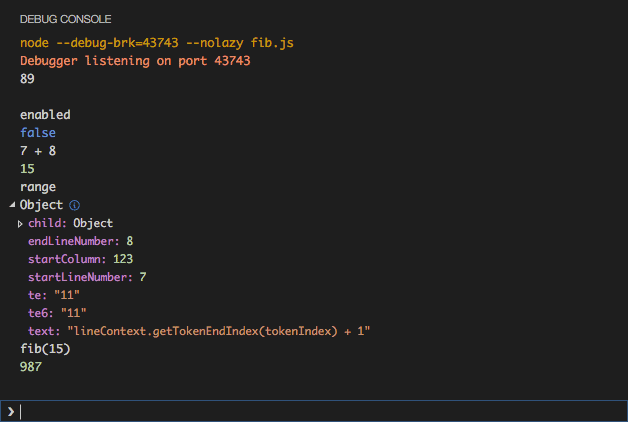
If the variable name is typed in the debug console, from there we can inspect the value tree.
Debug actions
Once a debug session starts, the Debug actions pane will appear on the top of the editor.

- Continue / Pause
F5 - Step Over
F10 - Step Into
F11 - Step Out
⇧F11 - Restart
⇧⌘F5 - Stop
⇧F5
Breakpoints
Clicking on the editor margin can toggle Breakpoints:
- Breakpoints - red filled circles in the editor margin
- Disabled breakpoints - gray filled circles in the editor margin
- Column breakpoints - shown inline in the editor
When a debugging session starts, breakpoints that cannot be registered with the debugger will change to gray hollow circles. The same might happen if the source is edited while a debug session is running without live-edit support.
Breakpoints can be setup as expression breakpoints; the debugger will stop in that line if the expression matches the given pattern.
Add the breakpoint, click on the red circle, click+right, and select the Edit breakpoint value.
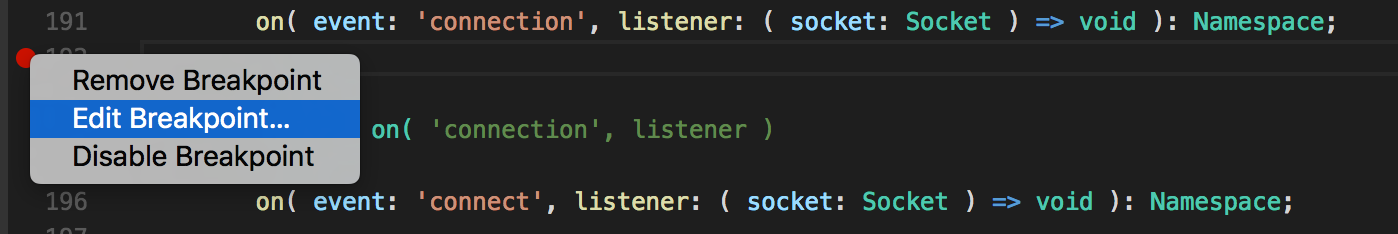
Add the desired expression.

More Information: https://code.visualstudio.com/docs/editor/debugging#_breakpoints
More Information on Node.js Debugging: https://code.visualstudio.com/docs/nodejs/nodejs-debugging
Red Hat Mobile Application Platform is available for download, and you can read more at Red Hat Mobile Application Platform.
Last updated: October 31, 2023