Deploying machine learning models in a production environment presents a unique set of challenges, and one of the most critical is ensuring that your inference service can handle varying levels of traffic with efficiency and reliability. The unpredictable nature of AI workloads, where traffic can spike dramatically and resource needs can fluctuate based on factors like varying input sequence lengths, token generation lengths or the number of concurrent requests, often means that traditional autoscaling methods fall short.
Relying solely on CPU or memory usage can lead to either overprovisioning and wasted resources, or underprovisioning and poor user experience. Similarly, a high GPU utilization might indicate efficient usage of accelerators or it can also signify reaching a saturated state, therefore industry best practices for LLM autoscaling have shifted towards more workload-related specific metrics.
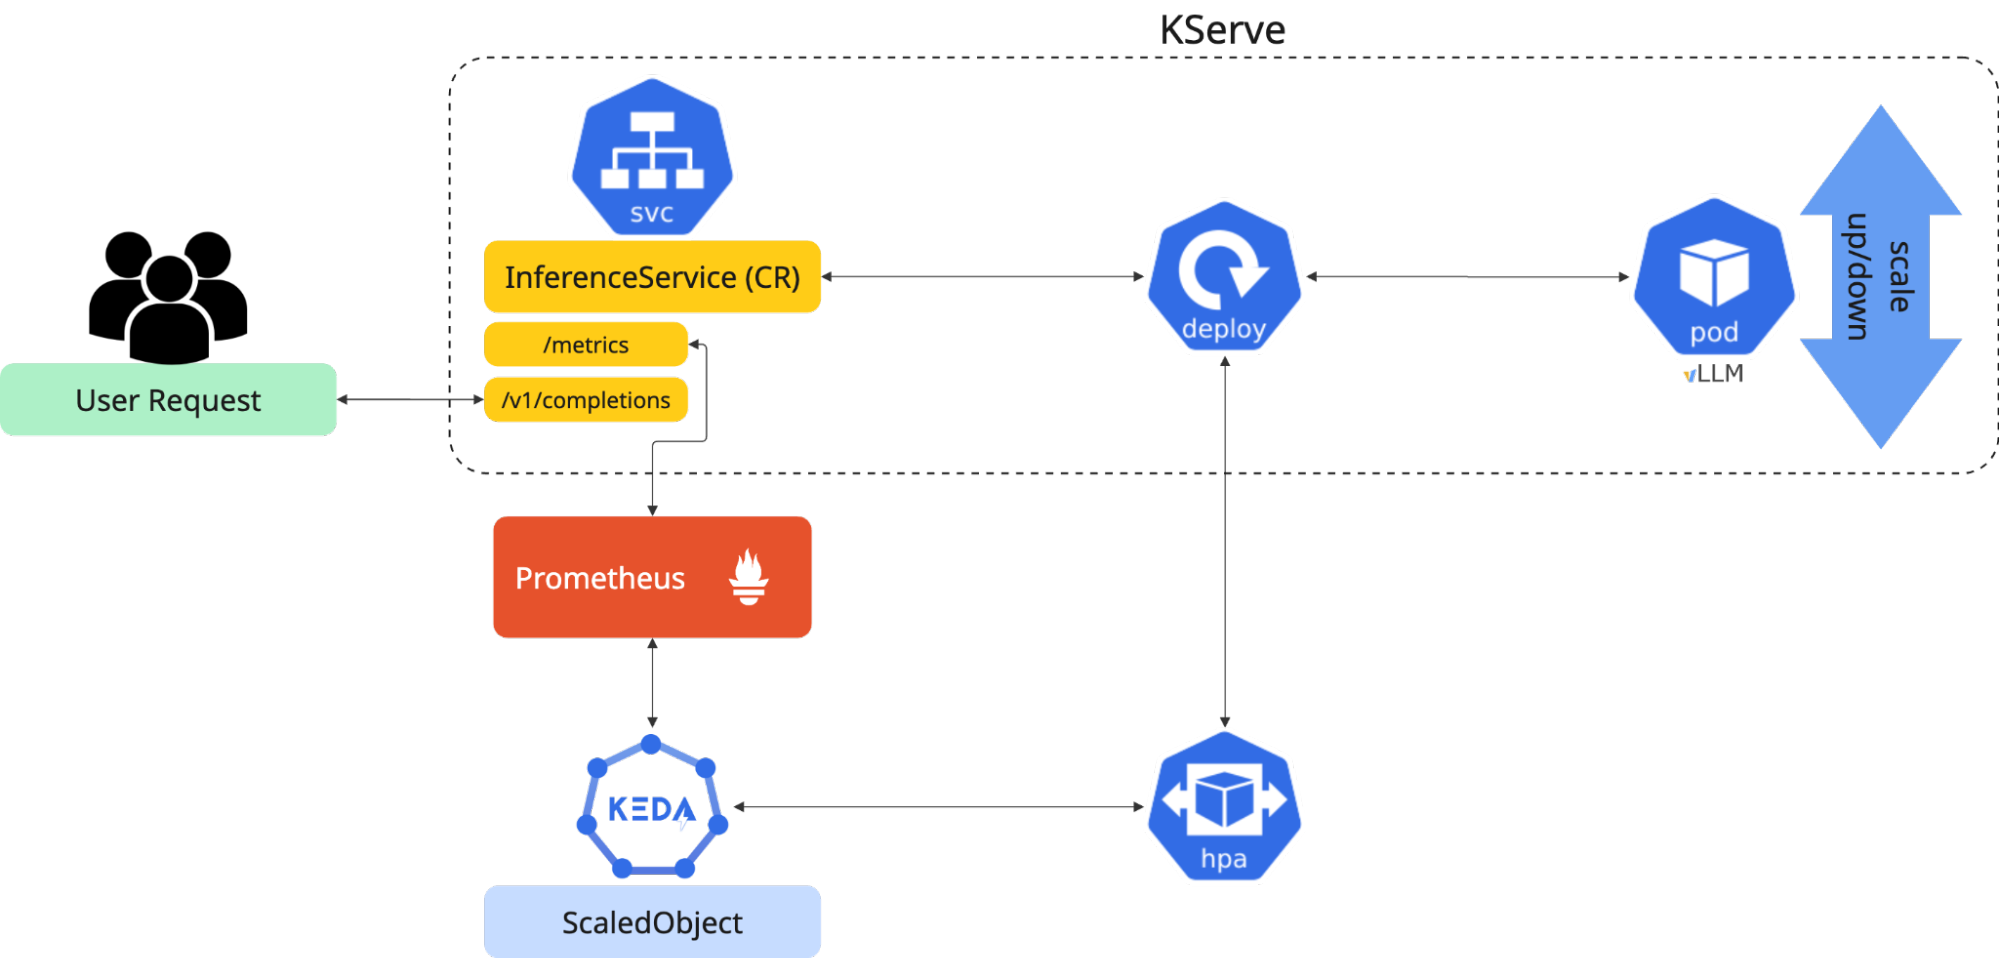
In this blog post, we will introduce a more sophisticated and flexible solution. We will walk through the process of setting up KServe autoscaling by leveraging the power of vLLM, KEDA (Kubernetes Event-driven Autoscaling, illustrated in Figure 1), and the custom metrics autoscaler operator in Open Data Hub (ODH). This powerful combination allows us to scale our vLLM services on a wide range of custom, application-specific signals, not just generic metrics. This provides a level of control and efficiency that is tailored to the specific demands of your AI workloads.

Why KEDA in the first place?
Understanding inference workloads requires acknowledging their fundamental difference from traditional web application patterns. Unlike conventional web requests that typically follow predictable response times, AI inference requests can be inherently heterogeneous and computationally intensive processes. These requests carry an element of uncertainty, because the processing time varies dramatically based on input sequence length, model architecture, and output sequence length, just to name a few.
It's like the difference between a simple database lookup and solving a complex mathematical proof. A standard web request might complete in milliseconds with predictable resource consumption, but an inference request could require seconds or even minutes with unpredictable resources needs, which are based on the cognitive complexity of the task at hand, among other variables. This fundamental distinction demands autoscaling strategies that look beyond simple data and instead focus on GPU load, request queues, processing latency patterns, and other metrics unique to inference workloads.
The traditional OpenShift horizontal pod autoscaler is primarily designed to work with CPU and memory metrics through the built-in metrics server. For scaling based on model serving metrics, an additional component must expose those metrics in a format that the horizontal pod autoscaler can understand. That is precisely when KEDA comes into play.
KEDA is a game-changer for scaling applications. KEDA extends the functionality of the standard OpenShift horizontal pod autoscaler, allowing it to scale applications from zero to N instances and back down based on a variety of event sources, including Prometheus triggers. While KServe already provides its own built-in autoscaling capabilities, KEDA introduces an open and extensible framework. This framework allows KServe to scale based on virtually any event, whether it's the length of a message queue, the number of tasks in a job, or any other custom metric exposed by vLLM that is directly relevant to the performance of our AI model.
The custom metrics autoscaler operator is the key to unlocking this flexibility. It acts as a crucial intermediary, simplifying the process of exposing metrics from your services and making them consumable by KEDA. The custom metrics autoscaler operator bridges the gap between the specific performance indicators your application generates and KEDA's scaling logic. With the custom metrics autoscaler operator, we can define highly tailored scaling rules that react precisely to the load on our vLLM services, ensuring optimal performance and cost-effectiveness.
Enabling vLLM metrics for autoscaling in Open Data Hub
In this guide, we are using the meta-llama/Llama-3.2-3B model served on Open Data Hub version 2.33.0 using vLLM and a KServe RawDeployment. It is assumed that ODH is correctly installed and the requirements met.
To effectively autoscale your vLLM-served models on ODH, you need to ensure their performance metrics are collected. This involves making vLLM metrics available to the cluster's internal Prometheus instance, which the custom metrics autoscaler operator will then consume. The following steps walk you through this process.
1. Expose vLLM metrics to OpenShift with annotations
First, you need a way for the cluster to discover and connect your vLLM inference service's metrics endpoint. Luckily, there is a standard way to do so by adding annotations to your InferenceService. These annotations expose the metrics port (typically 8000 or 8080) of your vLLM pods. Your InferenceService should look like this:
---
apiVersion: serving.kserve.io/v1beta1
kind: InferenceService
metadata:
  annotations:
    opendatahub.io/hardware-profile-namespace: opendatahub
    opendatahub.io/legacy-hardware-profile-name: migrated-gpu-mglzi-serving
    openshift.io/display-name: llama-3.1-8b
    serving.kserve.io/autoscalerClass: external
    serving.kserve.io/deploymentMode: RawDeployment
    prometheus.io/scrape: "true"  # enable Prometheus scraping
    prometheus.io/path: "/metrics"  # specify the endpoint
    prometheus.io/port: "8000"  # specify the port
  creationTimestamp: "2025-09-01T14:09:17Z"
# Rest of your InferenceService...
2. Enabling user-defined project monitoring
To ensure Prometheus discovers and scrapes metrics from your annotated InferenceService, you must enable user-defined project monitoring. This is a cluster-wide setting configured in a ConfigMap.
---
apiVersion: v1
kind: ConfigMap
metadata:
  name: cluster-monitoring-config
  namespace: openshift-monitoring
data:
  config.yaml: |
    enableUserWorkload: true
By setting enableUserWorkload: true, you're telling the OpenShift monitoring stack to monitor and scrape metrics from user-defined workloads in different namespaces, making your vLLM metrics visible to the cluster's Prometheus.
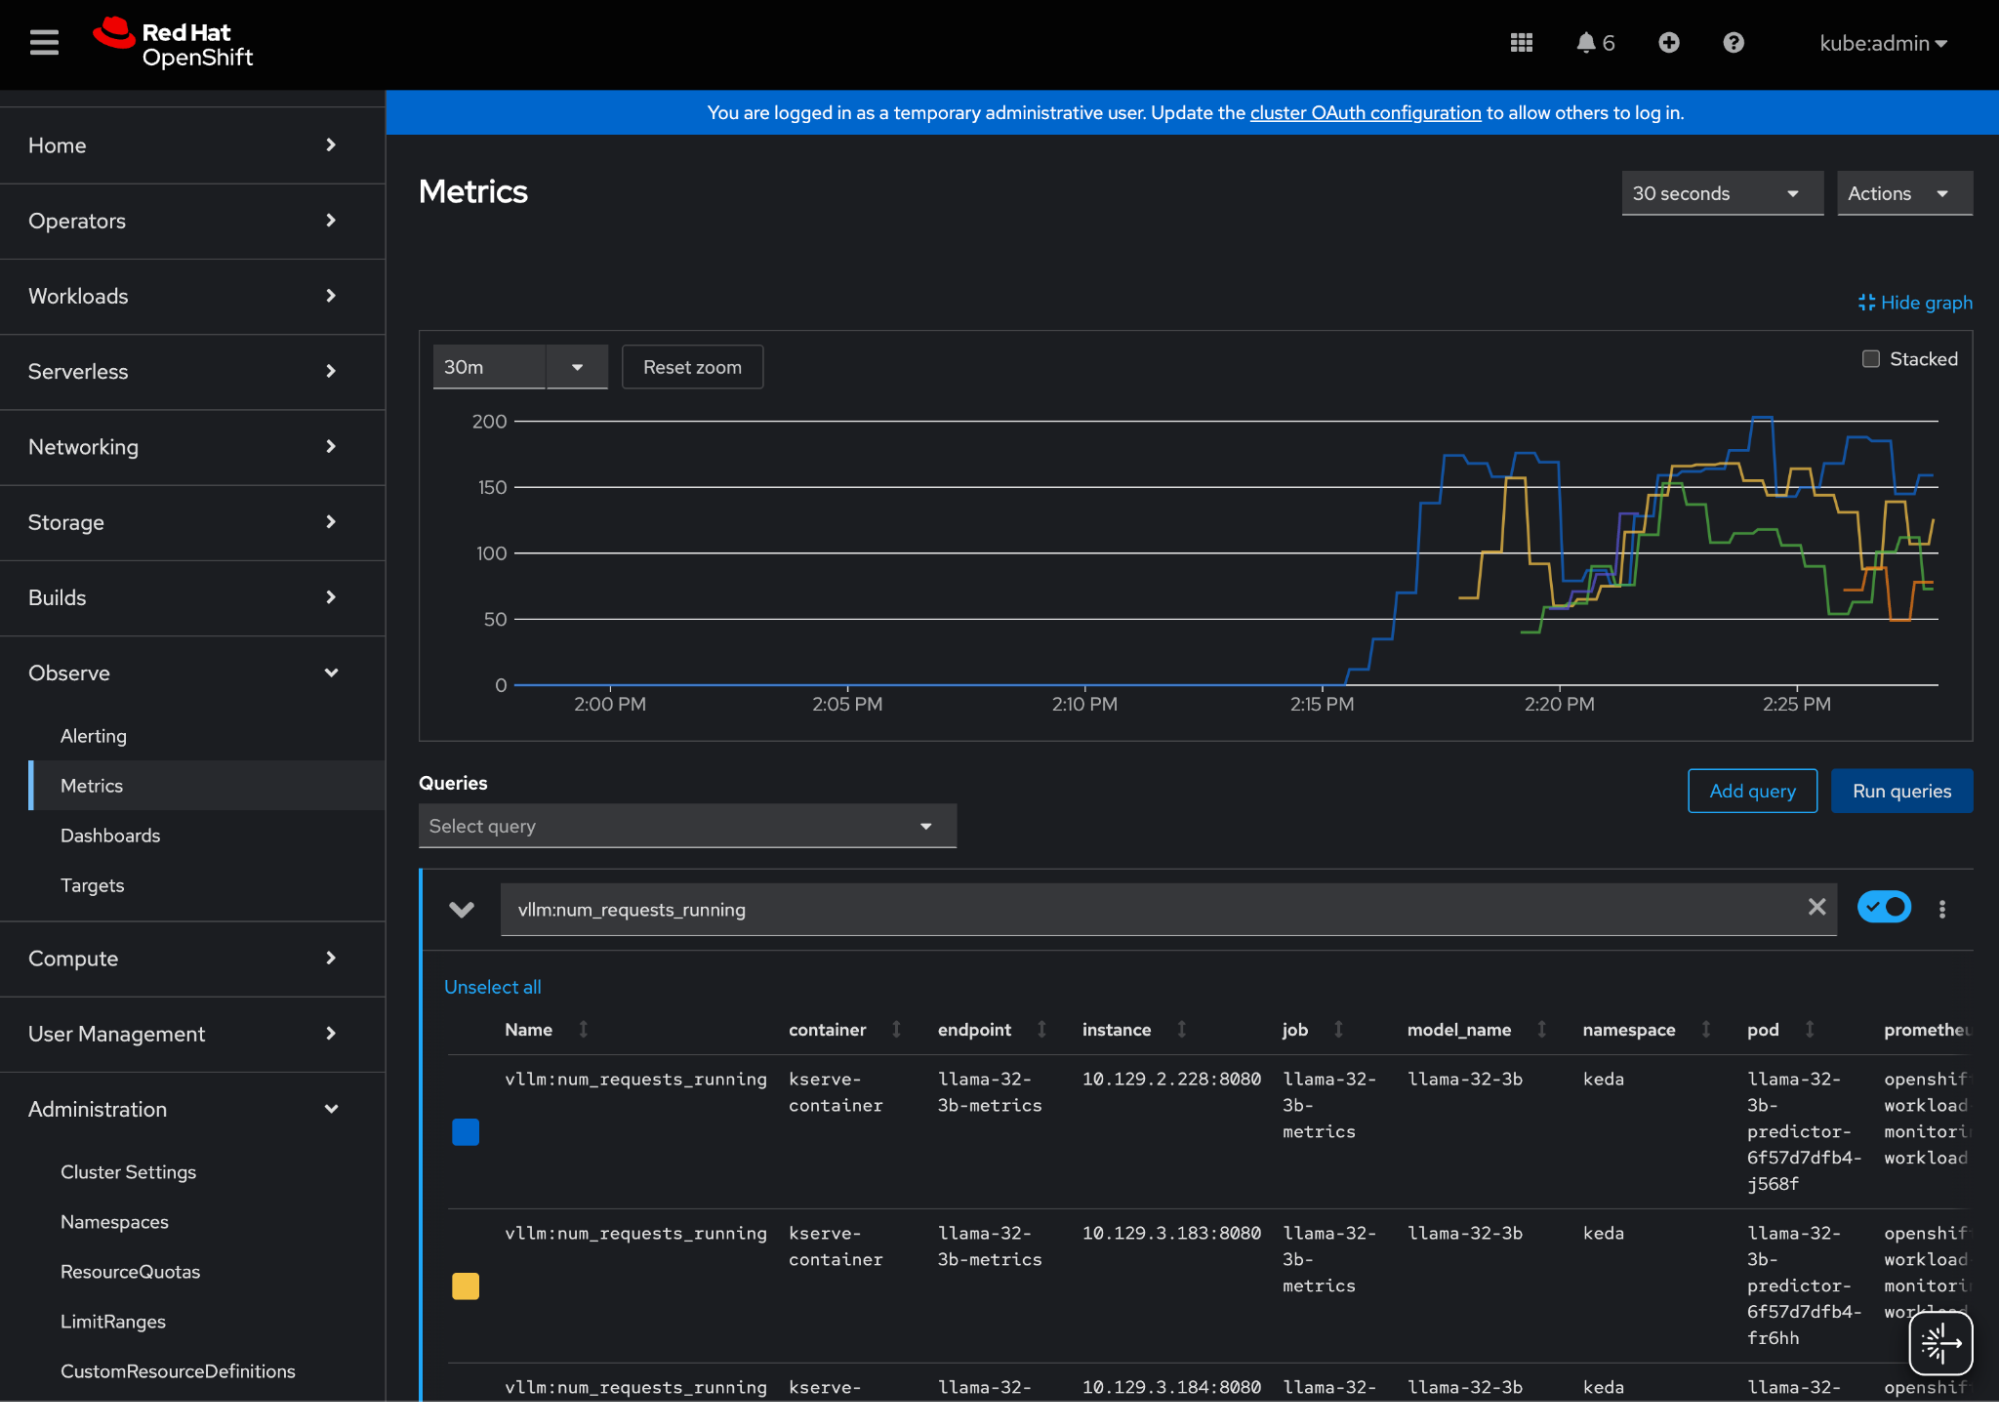
Once these steps are complete, your vLLM metrics will be available for use with the custom metrics autoscaler. You can go to the OpenShift console → Observe → Metrics and query any of the vLLM metrics to make sure that it is working properly (see Figure 2).

Set up KServe autoscaling with the custom metrics autoscaler operator
With your vLLM metrics now successfully being scrapped by Prometheus, the next step is to configure KEDA to use these metrics to autoscale your vLLM service. In the following steps, we will set up the custom metrics autoscaler operator to scale your workloads based on your vLLM metrics from Prometheus. For specific steps on how to install the custom metrics autoscaler operator and create the kedaController instance, you can check out the blog posts Custom Metrics Autoscaler on OpenShift and Boost AI efficiency with GPU autoscaling on OpenShift.
A quick but important note: When using a KServe RawDeployment, you must disable the default KServe horizontal pod autoscaler. You can do this by adding the following annotation to your InferenceService manifest:
serving.kserve.io/autoscalerClass: externalWe use the label selector app: isvc.llama-32-3b-predictor and the keda namespace. Be sure to replace these with the appropriate label and namespace for your own InferenceService.
1. Prepare the environment and access control
To allow KEDA to communicate securely with the internal cluster Prometheus, we need to create a dedicated ServiceAccount and configure role-based access control (RBAC). This ensures KEDA has the necessary permissions to read the metrics it needs to make scaling decisions.
---
apiVersion: v1
kind: ServiceAccount
metadata:
  name: keda-prometheus-sa
  namespace: keda
---
apiVersion: rbac.authorization.k8s.io/v1
kind: Role
metadata:
  namespace: keda
  name: keda-prometheus-role
rules:
- apiGroups: ["metrics.k8s.io", "custom.metrics.k8s.io", "external.metrics.k8s.io"]
  resources: ["*"]
  verbs: ["get", "list", "watch"]
---
apiVersion: rbac.authorization.k8s.io/v1
kind: RoleBinding
metadata:
  name: keda-prometheus-rolebinding
  namespace: keda
subjects:
- kind: ServiceAccount
  name: keda-prometheus-sa
  namespace: keda
roleRef:
  kind: Role
  name: keda-prometheus-role
  apiGroup: rbac.authorization.k8s.io
After applying this YAML, you must also grant the keda-prometheus-sa service account the cluster-monitoring-view role. This is a critical step that allows it to access data from OpenShift’s central monitoring stack. You can do this with the following command:
oc adm policy add-cluster-role-to-user cluster-monitoring-view -z keda-prometheus-sa -n keda2. Create a TriggerAuthentication for secure access
KEDA needs a way to securely authenticate with Prometheus. This is done with a TriggerAuthentication object, which uses a bearer token. The token is automatically generated when you create a Secret tied to your service account.
First, create the Secret:
---
apiVersion: v1
kind: Secret
metadata:
  name: keda-prometheus-token
  namespace: keda
  annotations:
    kubernetes.io/service-account.name: keda-prometheus-sa
type: kubernetes.io/service-account-token
Next, create the TriggerAuthentication custom resource. This object references the secret we just created to provide KEDA with the necessary credentials.
---
apiVersion: keda.sh/v1alpha1
kind: TriggerAuthentication
metadata:
  name: keda-trigger-auth-prometheus
  namespace: keda
spec:
  secretTargetRef:
    - parameter: bearerToken
      name: keda-prometheus-token
      key: token
    - parameter: ca
      name: keda-prometheus-token
      key: ca.crt
The TriggerAuthentication acts as a reusable authentication configuration that can be referenced by any ScaledObject that needs to query Prometheus.
3. Define your Prometheus query
This is arguably the most crucial and nuanced part of the setup. You must craft a Prometheus query that returns a single numeric value that accurately reflects the load on your model. vLLM exposes various useful metrics:
vllm:time_per_output_token_seconds_bucket: Inter-Token Latency or Time Per Output Token (TPOT).vllm:e2e_request_latency_seconds_bucket: End-to-end request latency.vllm:gpu_cache_usage_perc: The percentage of GPU KV cache utilization.vllm:num_requests_waiting: The number of requests waiting to be processed.
For our example, let's say we want to scale based on waiting requests. We'll use the sum() aggregation function to ensure the query returns a single value across all pods of our deployment.
sum(vllm:num_requests_waiting{namespace="keda", pod=~"llama-32-3b-predictor.*"})This query sums up all pending requests for pods within the keda namespace that belong to our llama-32-3b-predictor deployment.
4. Creating the ScaledObject
Now, let's bring everything together in a ScaledObject. This KEDA custom resource is the core of our autoscaling configuration. It defines the target deployment, the minimum and maximum replica counts, and the scaling triggers.
---
apiVersion: keda.sh/v1alpha1
kind: ScaledObject
metadata:
  name: llama-32-3b-predictor
  namespace: keda
spec:
  scaleTargetRef:
    apiVersion: apps/v1
    kind: Deployment
    name: llama-32-3b-predictor
  minReplicaCount: 1
  maxReplicaCount: 5
  pollingInterval: 5
  triggers:
  - type: prometheus
    authenticationRef:
      name: keda-trigger-auth-prometheus
    metadata:
      serverAddress: https://thanos-querier.openshift-monitoring.svc.cluster.local:9092
      query: 'sum(vllm:num_requests_waiting{namespace="keda", pod=~"llama-32-3b-predictor.*"})'
      threshold: '2'
      authModes: "bearer"
      namespace: keda
In this ScaledObject, we tell KEDA to scale the llama-32-3b-predictor deployment. The triggers section specifies that we'll use a Prometheus source, referencing our TriggerAuthentication. We set a threshold of 2, meaning KEDA will add new pods if the total number of waiting requests exceeds this value. We also define a minReplicaCount of 1 to ensure a pod is always available and a maxReplicaCount of 5 to prevent runaway scaling.
5. Monitoring and verification
Once you apply the ScaledObject, KEDA will automatically create a horizontal pod autoscaler for you, as shown in Figure 3. You can monitor its status to confirm that everything is working as expected.

The horizontal pod autoscaler's output will show the current metric value, the scaling threshold, and the current and desired number of replicas. As traffic to your service increases, you should see the TARGETS value rise, and the REPLICAS will automatically scale up to meet demand. This confirms that your event-driven autoscaling pipeline is now fully operational.
What's next? Setting the stage for performance validation
This post has focused on the foundational steps of setting up KServe autoscaling with KEDA and the Custom Metrics Autoscaler operator. We've established the architecture for a highly flexible and efficient scaling solution.
In our next blog post, we will move from setup to validation. We will share the results of a series of performance and load tests designed to put this autoscaling architecture through its paces. We'll analyze key performance inference indicators and how they impact or drive the performance of the autoscaling, and, therefore, our service. The goal is to provide a data-driven understanding of the significant benefits of this autoscaling strategy for inference workloads. Be sure to stay tuned for the results!
