During deployment of a new server, I noticed a stark performance gap between workloads running on bare metal and those running in a virtual machine (VM) on the same machine. After deep investigation, I uncovered a series of tuning changes—some obvious, some surprising—that dramatically narrowed the gap.
In this article, I’ll walk through the most impactful optimizations, from adjusting system profiles and enabling modern CPU scaling drivers to improving network performance and understanding idle power behavior. You’ll learn how small, targeted changes can yield big gains and why some assumptions about performance tuning don’t hold up in practice.
The workload
For my work, I frequently build and test the GNU project debugger (GDB), so it’s important to me that GDB builds quickly. The commands used for building GDB look like this:
mkdir -p /path/to/build/directory ; cd /path/to/build/directory
/path/to/gdb/sources/configure
time make -j32
It is not customary to time the make command, but, for this study, I timed the critical part of the workload. For each of the scenarios where I timed the GDB build workload, I ran the workload at least five times, deleting the build directory before each run. When the standard deviation remained relatively high after just five runs, I ran the test some number of times more in order to make the standard error (and hence margin of error) somewhat smaller, which also provided a more accurate mean.
Note
The make option -j32 (which sets the number of parallel jobs) is not suitable for all machines. A rule of thumb is to set the -j number to be the same as the number of cores on the machine. I typically use -j$(nproc) instead, which does this. But for this performance study, I wanted both the host and the VM to run only up to 32 processes in parallel, which is why I explicitly specify it as 32.
For those not familiar with Makefiles for the GDB project, each subdirectory in the project runs its own configure script, and then runs (in parallel, due to use of the -j switch) various compilers or other tools to turn source code into object code, followed by a linking step to turn object files into either executables or libraries. Running the various configure scripts can sometimes occur in parallel, provided that there are no dependencies, but these do tend to serialize the build process.
Likewise, when reaching a step that combines various objects (i.e., running the linker), the build process needs to wait for all dependent compilation steps to complete. When using a top type tool to monitor a build, it’s rare to see 32 cores in use. It does sometimes happen, but only a few times during the build process.
To rule out network bottlenecks, I also ran iperf3 to test network performance between the VM and the host and the VM and another machine. I’ll discuss iperf3 results for one optimization that significantly improved network performance, though it had little impact on GDB build times. I ran each iperf3 workload at least 5 times also, but because the standard deviations were uncomfortably large, I use error bars when presenting those data.
System configuration and test environment
The host machine used for this study is an AMD EPYC 9354P, a 32-core processor with simultaneous multithreading (SMT), which Linux exposes as 64 logical cores. It has ample memory—more than sufficient to run the GDB build workload and the guest VM without swapping—and is large enough for the OS to cache all files used during the build process.
The virtual machine was configured with 32 virtual CPUs, 16 GiB of RAM, and over 80 GiB of disk space, backed by an OpenZFS (a derivative of ZFS) volume on the host. Disk and network I/O use virtio drivers for high-performance virtualization.
For the GDB build, both the source and build directories were mounted via the Network Filesystem Protocol (NFS) from a separate machine connected over a 10 Gbps Ethernet link. Additional tests using local storage on the host revealed that NFS had negligible impact on build performance—a result that surprised me, given the I/O-heavy nature of the workload.
However, with 10 Gbps network bandwidth and optimized OpenZFS storage, the I/O subsystem was already more than sufficient. This suggests that the workload is now CPU- and memory-bound—not I/O-bound—which explains why network and storage changes had little effect.
Both the host and guest systems ran Fedora 42, so I could be confident that performance differences were due to tuning, not software variation.
Cumulative impact of tuning on host VM performance
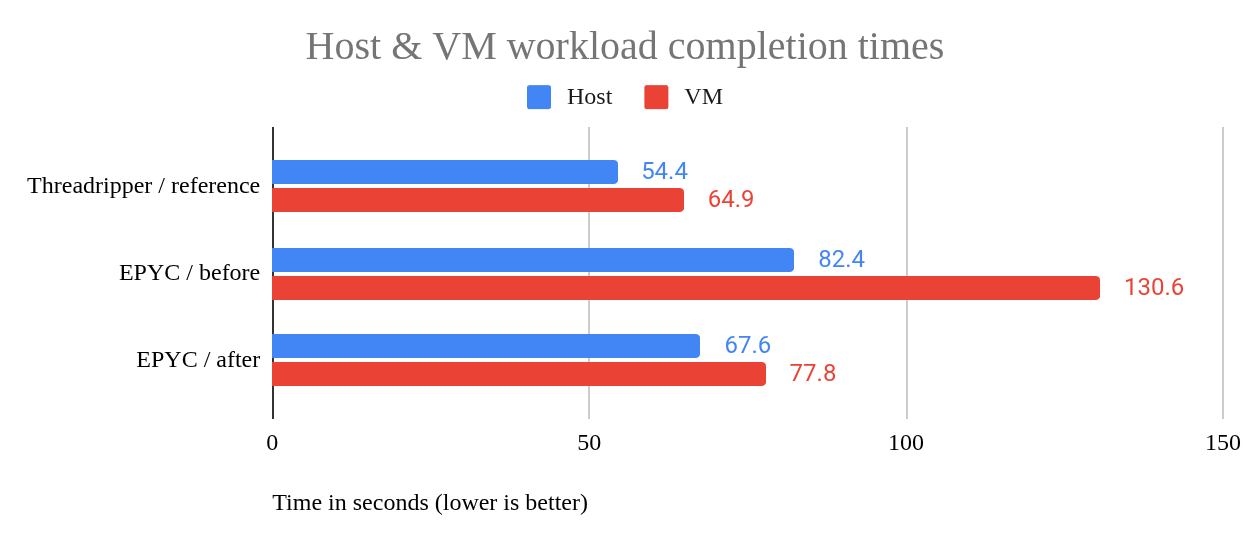
On bare metal, the workload averaged 82.4 seconds, while the VM took 130.6 seconds—a 48-second (58%) difference. For comparison, a heavily loaded AMD Ryzen Threadripper 7970X completed the workload in 54.4 seconds, and its hosted VM took 64.9 seconds—a much smaller 10.5-second (19%) gap.
After several tuning optimizations, the EPYC host completed the workload in 67.6 seconds, and its VM in 77.8 seconds—a 10.2-second (15%) difference. Even more surprising: the tuned VM now runs faster than the original bare-metal host configuration, which took 82.4 seconds—a 4.6-second difference. See Figure 1.
I tracked every change during tuning, but I've chosen to present them based on their impact, starting with the optimizations that yielded the biggest performance gains. This approach reflects the reality of performance tuning, where the most impactful improvements aren't always the first ones tried, and some changes have little to no effect.
Biggest payoff: Changing the host’s tuning profile
Changing the host’s tuned profile from balanced to alternatives such as virtual-host or throughput-performance resulted in a whopping 45% improvement in VM performance. I know, from other testing, that this is not always the case, as the balanced profile usually provides good performance—in fact, on one machine, the NFS server mentioned earlier, testing the workload in a VM hosted by that machine had the balanced profile slightly outperforming the throughput-performance profile.
The tuned-adm list command shows profiles along with a brief description of what each does. Since we’re running a workload on a VM, the obvious profile to use is the virtual-host profile and, indeed, this is what I tried first. After performing initial trials using most of the available profiles, I settled on the list below for my benchmarking. The profile’s description provided by the tuned-adm list command is shown in italics.
balanced: General non-specialized tuned profile. This is the default profile.balanced-performance: A custom profile for experimenting withtunedconfiguration file settings. It’s now nearly identical tobalanced, though with a few tweaks.throughput-performance: Broadly applicable tuning that provides excellent performance across a variety of common server workloads. My testing found that this is an excellent profile for performance and, surprisingly, has low idle power usage as well.virtual-host: Optimize for running KVM guests. This seemed like the obvious choice for running VMs, but I found a serious drawback.powersave: Optimize for low power consumption. At the start of this tuning journey, I hypothesized that thebalancedprofile on the EPYC platform was effectively the same aspowersave. Testing found that (lack of) performance was very close, withpowersavebeing only 5.5% slower. Thebalancedprofile’s configuration file specifies that thebalancedprofile’s governor will fall back to using thepowersavegovernor if both theschedutilandondemandgovernors are unavailable, perhaps partially explaining why performance was initially so terrible.
On several AMD machines, the tuned-adm verify command reports a failure for the balanced profile, indicating, via its log file, that the cpufreq_conservative module is not loaded. It turns out that it’s not a loadable module—it is built into the kernel! This means that the error is not due to a missing component, but rather a mismatch between the profile’s expectations and the system’s CPU scaling configuration.
To resolve the verification failure and explore the potential for better performance with lower idle power consumption, I created a custom balanced-performance profile. I tried a number of different settings, but, ultimately, it now does just two things:
- It removes the
balancedprofile’s reference to thecpufreq_conservativemodule. - It changed the
energy_performance_preferencesetting toperformance. This latter setting will be further discussed in theamd-pstatediscussion.
Even after switching to the amd-pstate driver, the balanced-performance profile performed about the same as the balanced profile from which it was derived. The chart in Figure 2 shows minor differences between the two, within the margin of error.
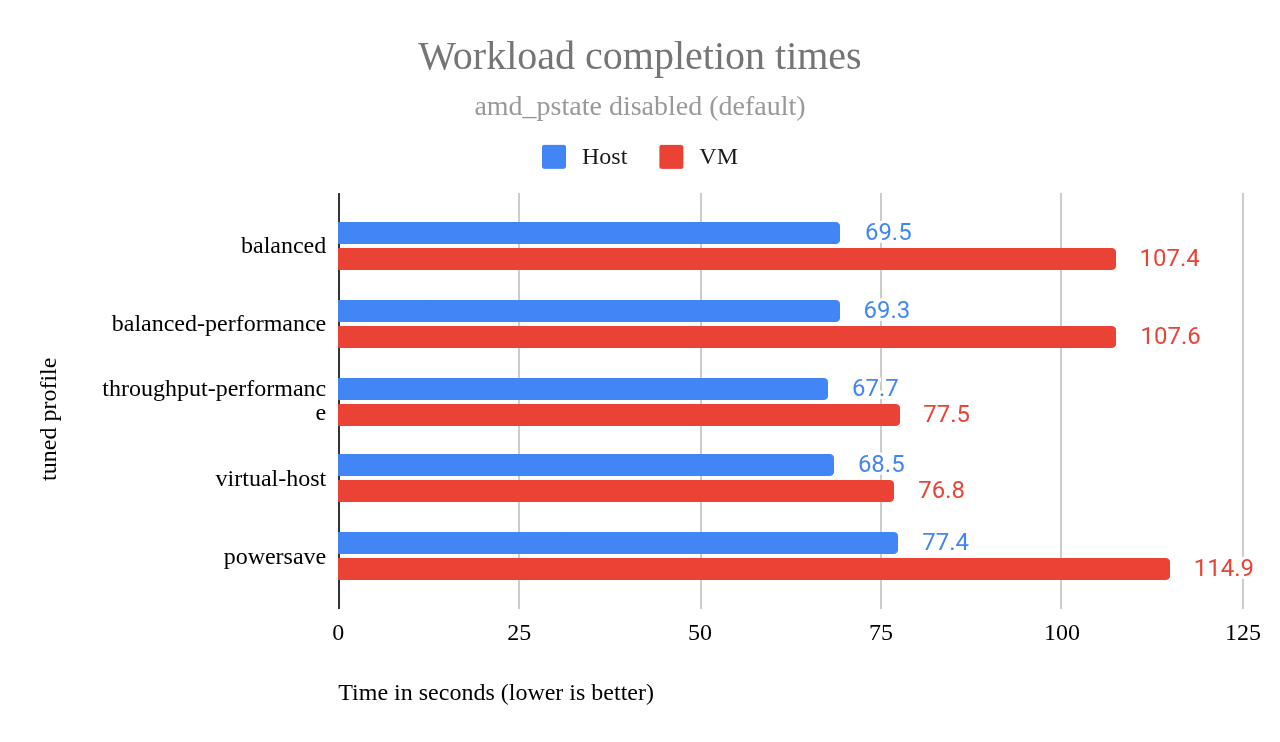
This chart shows that the virtual-host profile delivers strong VM performance—so should we adopt it?
After performing each set of workload tests (typically 5, but up to 16 runs per profile), I measured idle power consumption using a TP-Link Tapo P115 smart plug connected to the server’s power supply. After a two-minute interval, I recorded the lowest power reading observed. During this period, readings fluctuated by as much as 20 watts, probably due to background system activity.
I found that, at idle, the virtual-host profile consumed 89 watts more than the balanced profile and 75 watts more than throughput-performance—a substantial difference that cannot be explained by the occasional 20-watt fluctuations at idle.
Even more concerning, when I switched from virtual-host to throughput-performance, idle power usage did not drop—it remained at the higher level observed under virtual-host.
After further testing, I confirmed that to reliably measure the true idle power consumption of a tuned profile, a reboot is required between profile changes. This is because some tuning settings, possibly those affecting CPU frequency scaling and power management, are not fully reverted by tuned-adm alone.
The chart in Figure 3 shows idle power usage across each profile, including different amd-pstate operation modes: off, passive, active, and guided.
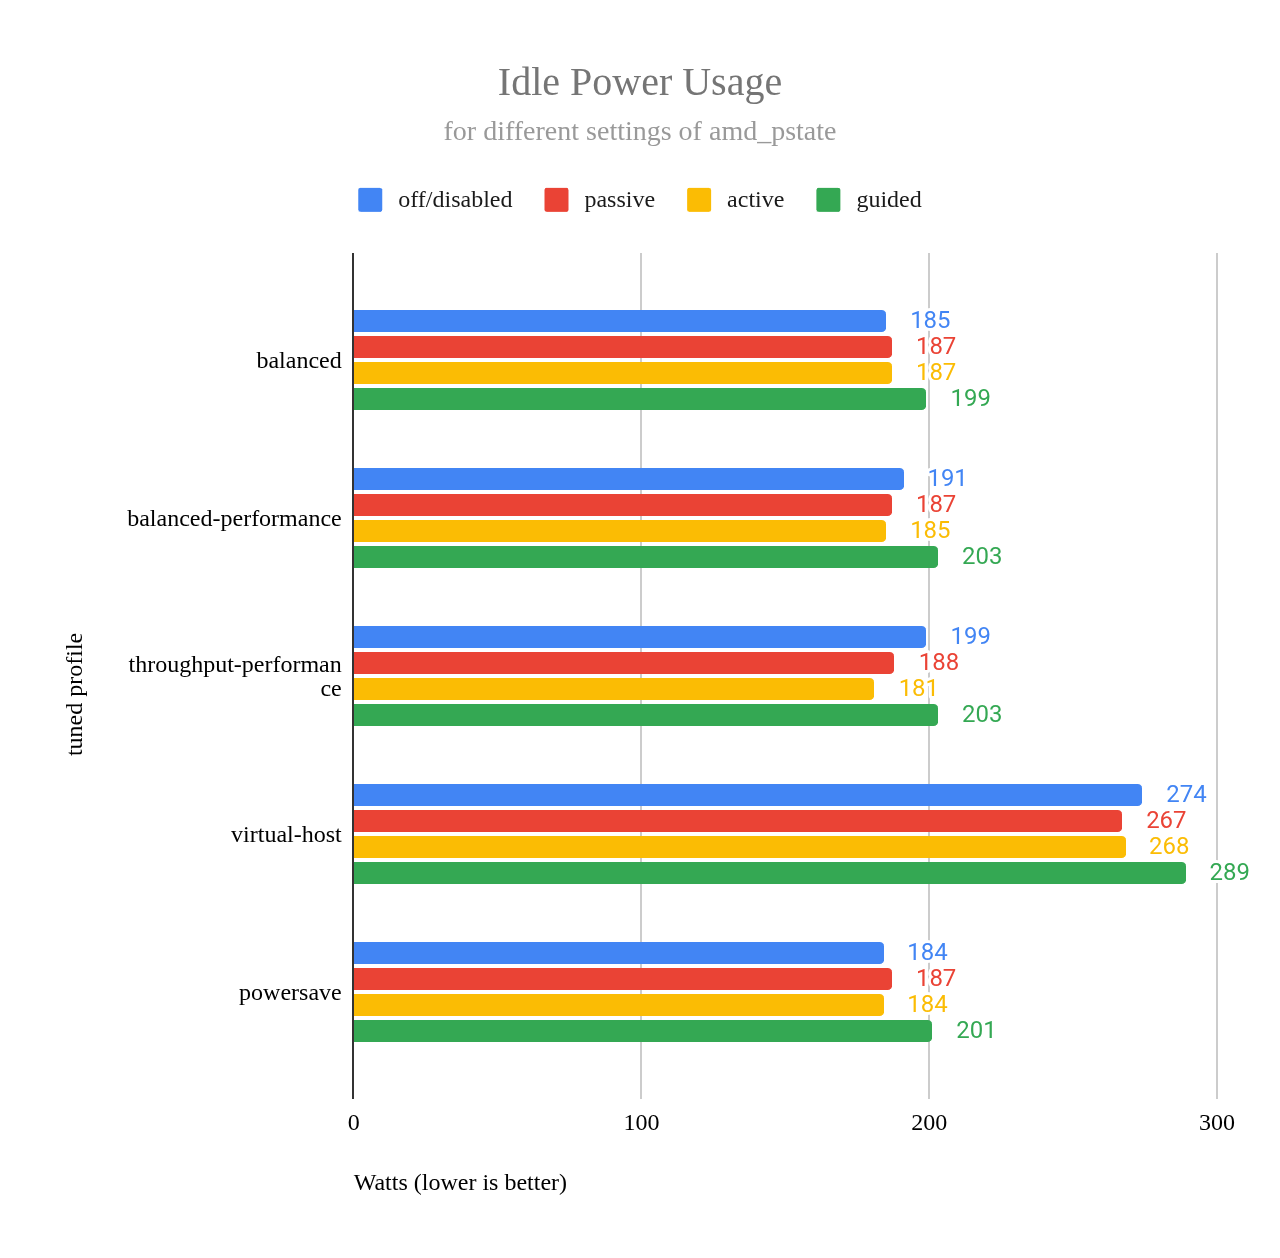
One takeaway from this chart is that idle power usage is very good when using profile throughput-performance with amd_pstate=active. The chart shows that idle power usage is even lower than with powersave, though the difference falls within the margin of error.
While tuned-adm profiles set high-level performance/power policies, the actual execution depends on the underlying CPU driver, e.g., amd_pstate or acpi-cpufreq, as well as the scaling governors available for a particular driver. This interplay explains why some tuned-adm settings had minimal impact when amd_pstate was disabled. To understand the driver's role in these outcomes, we'll now explore the amd-pstate driver's operation modes in detail.
Balancing power and performance: amd-pstate in action
As described earlier, my attempt to write a custom tuned profile to balance power and performance did not appear to be successful. While researching the matter, I learned about the amd-pstate driver, described in detail by Huang Rui in amd-pstate CPU Performance Scaling Driver. This Linux kernel driver manages CPU performance states (P-states) on modern AMD processors.
Depending on the selected operation mode (configured via the amd_pstate=active, passive, or guided kernel command line parameters, the driver can allow the CPU to autonomously scale frequency and voltage in real time. I experimented with all three, but found active and guided most useful for my hardware. So, what do these options mean, and how are they enabled?
amd-pstatedisabled: This was the default on my Fedora 42 install for my EPYC system. On the other hand, on my Threadripper 7970X system, it is enabled to beactiveby default. A BIOS setting might cause my EPYC system to also place amd-pstate in theactivemode by default, but I haven’t yet found it.amd_pstate=active: When this option is passed to the kernel via its command line, amd-pstate is in fully autonomous mode. The OS is able to provide hints to the hardware regarding whether to favor performance, energy efficiency, or some balance, but otherwise, the OS doesn't have much control over what the CPU does. These hints can be provided by setting atunedprofile. Hints are specified by theenergy_performance_preferencesetting in a profile's configuration file, however not all profiles (latency-performance, for example) provide this setting.amd_pstate=guided: Similar toamd_pstate=active, but allows the OS to define minimum and maximum performance boundaries. The hardware then autonomously selects a frequency within these bounds, attempting to prioritize the OS’s guidance when thermal and power conditions allow.amd_pstate=passive: When this option is passed to the kernel via its command line,amd_pstateis in non-autonomous mode. Here, the OS specifies a precise performance target (e.g., 60% of nominal performance), and the hardware attempts to meet this target while respecting thermal and power constraints. Unlike active mode (which uses OS hints like energy vs. performance preferences) or guided mode (which sets min/max boundaries), passive mode focuses on hitting a specific, OS-defined performance level whenever possible.My experiments showed that this option sometimes provided better performance than with amd-pstate disabled, but sometimes it did not, particularly when the
tunedprofilevirtual-hostwas used.
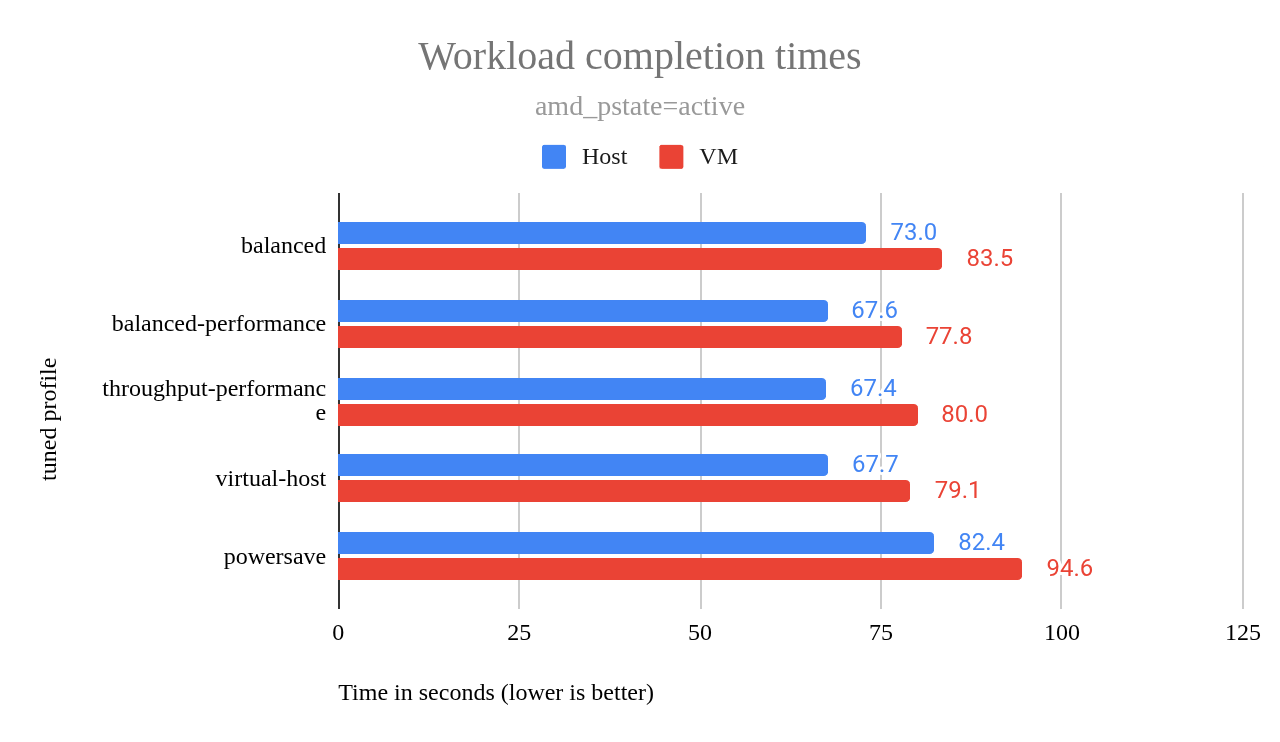
I will deploy the server with amd_pstate=active (Figure 4). While amd_pstate=guided showed slightly better performance during testing (Figure 5), active mode offers better idle power efficiency, which is crucial for a server spending significant time in low-activity states. The performance difference was negligible in typical workloads, making the potential power savings a worthwhile trade-off.
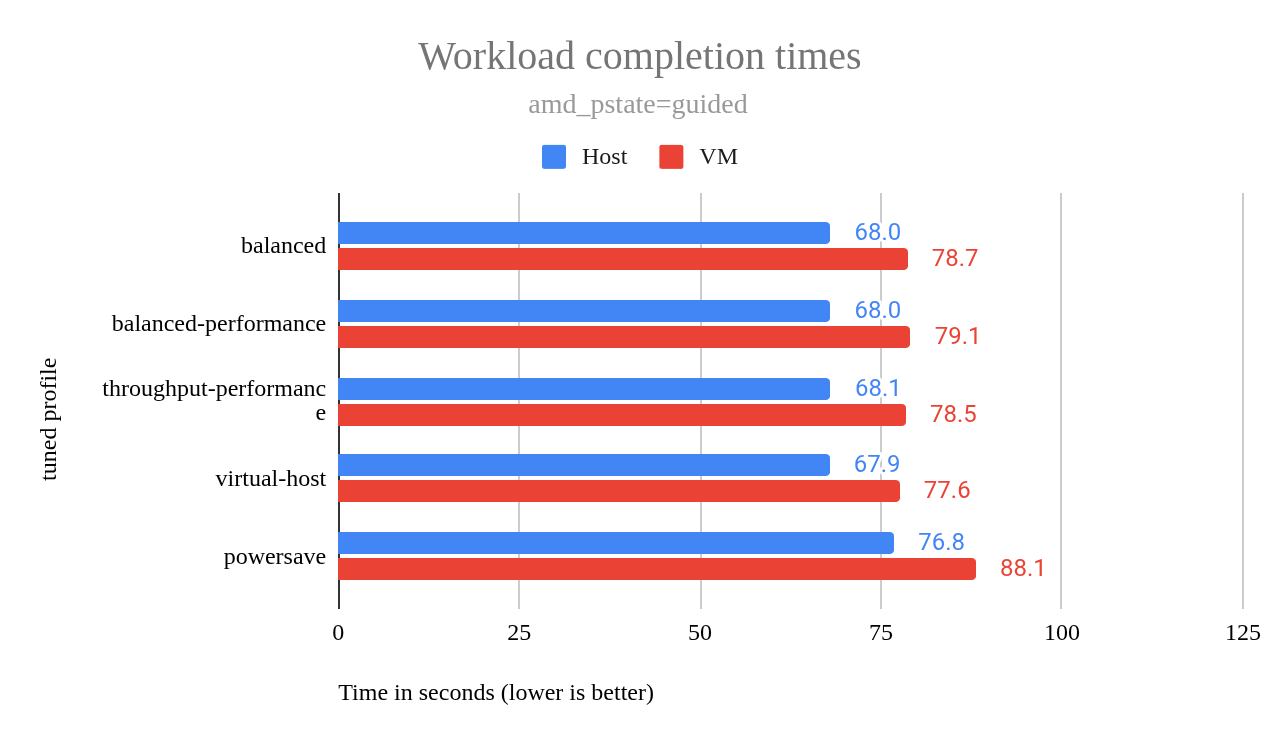
Like the amd_pstate=active chart, the amd_pstate=guided chart showed that all profiles except powersave delivered roughly the same performance, with one exception. In the amd_pstate=active chart in Figure 4, the balanced profile performed notably worse than all except powersave, while in the amd_pstate=guided chart in Figure 5, all profiles (excluding powersave) exhibited virtually identical performance, almost as if the results for each profile were simply copied down the chart.
This suggests that amd_pstate=guided effectively eliminates the performance variations observed with most of the different tuned profiles than when using amd_pstate=active. The virtual-host profile exhibited higher idle power consumption compared to the other profiles, as shown in the earlier power usage chart.
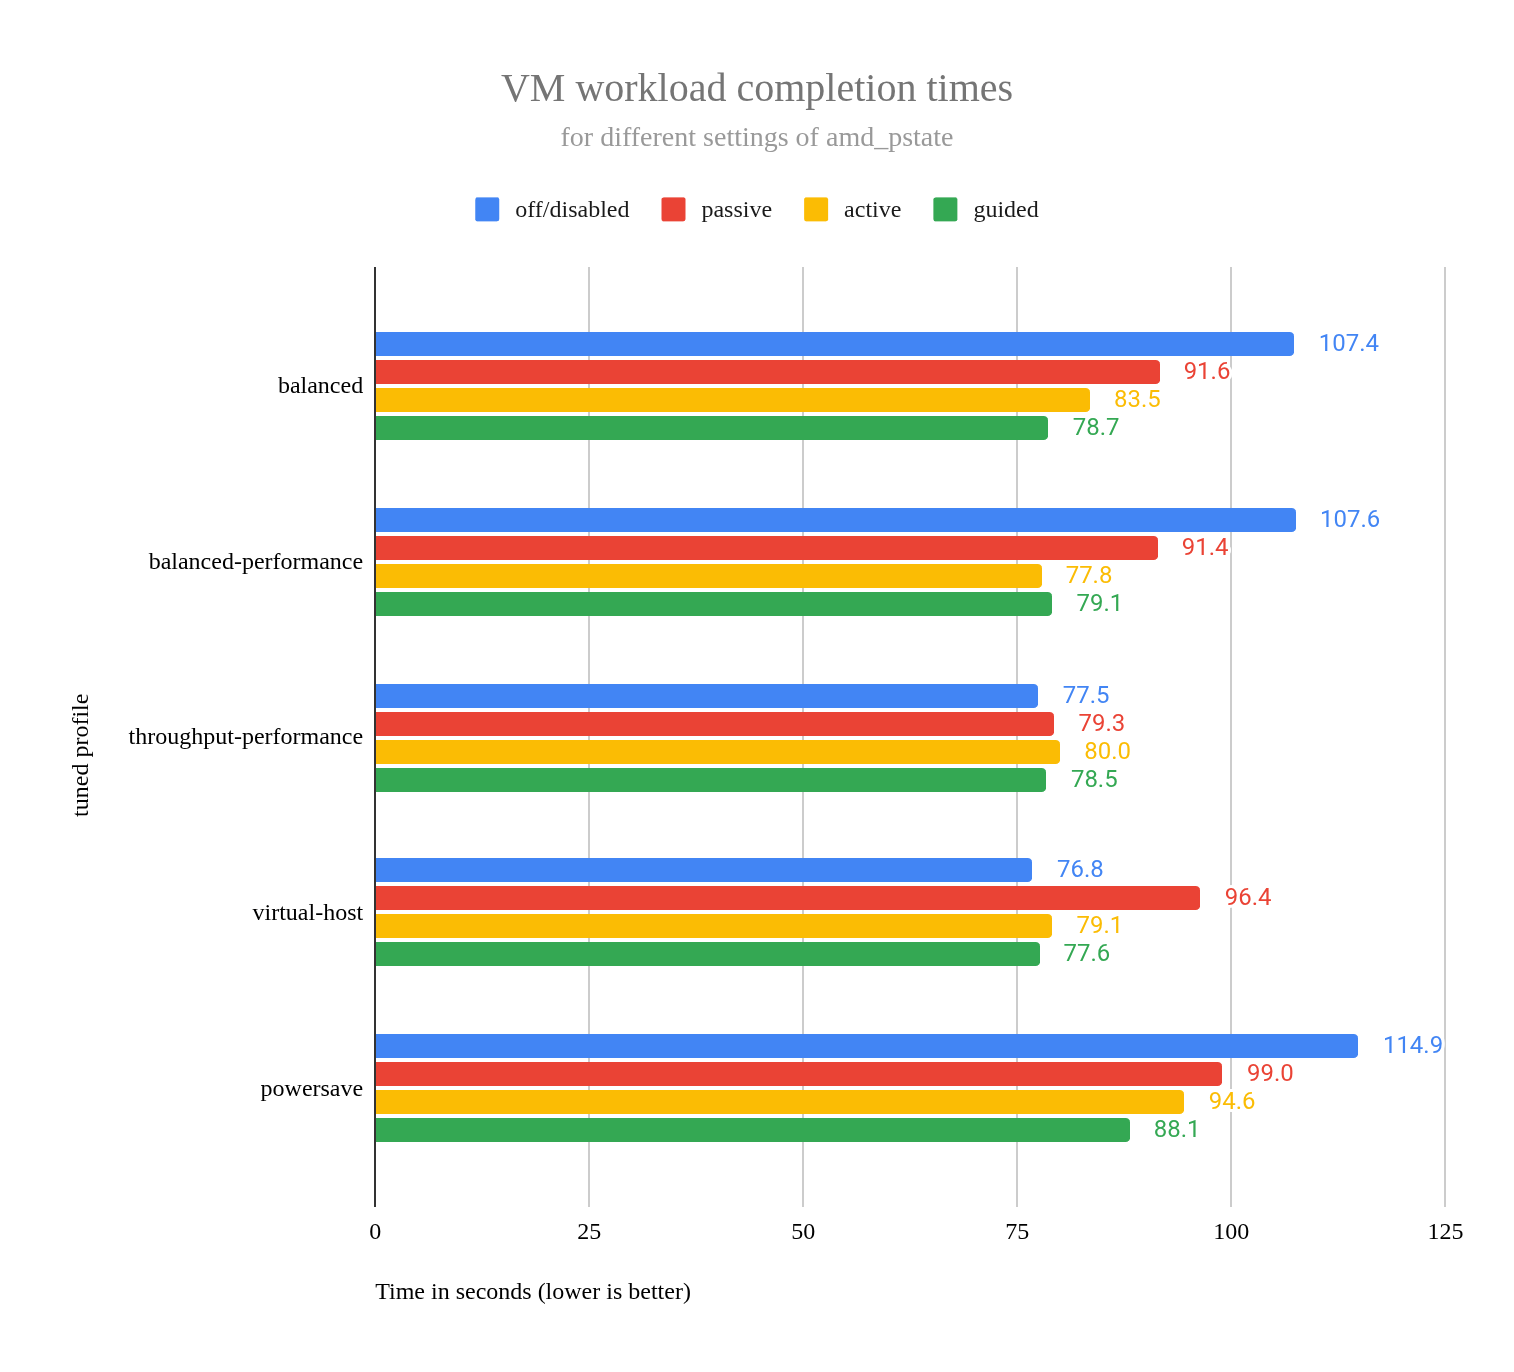
To further analyze the interplay between amd-pstate modes and tuned profiles, I created a chart comparing VM workload completion times across all combinations of amd-pstate settings (disabled, passive, active, guided) and the tuned profiles. See Figure 6.
Disabling mitigations: Performance gains versus security risks
The mitigations=off kernel command-line parameter disables all optional CPU mitigations for hardware vulnerabilities that can lead to unauthorized data access, such as Spectre, Meltdown, and related speculative execution vulnerabilities. These mitigations are enabled by default on vulnerable processors and are inactive on unaffected hardware. Note that some protections are hardware-mandated, microcode-enforced, or built into the kernel and cannot be disabled via this parameter.
Disabling mitigations can improve performance, as shown in this case study that tested the GDB build workload on an AMD EPYC 9354P CPU. However, performance gains vary widely depending on workload and CPU generation.
Warning
Disabling mitigations removes protections against speculative execution and other side-channel attacks, which can leak sensitive data (e.g., passwords, encryption keys). In networked environments, a compromised system could serve as a foothold for attackers to target other devices. While the security risk is particularly acute in multi-tenant environments (e.g., cloud setups), all deployments should carefully weigh these risks against potential performance benefits.
Impact on host performance
Using mitigations=off on the host, caused the workload, run on the host, to finish 10.6 seconds (15.5%) faster than not using it.
| machine tested | host mitigations | n | mean | std dev | marg err |
|---|---|---|---|---|---|
| host | on | 16 | 78.6 | 0.183 | 0.09 |
| host | off | 16 | 68.0 | 0.342 | 0.168 |
Impact on VM performance when disabling host mitigations
- Mitigations enabled on VM: Disabling mitigations on the host caused the VM workloads to finish an average of 1.2 seconds (1.3%) faster than with host mitigations enabled. This is just outside the margin of error, so there may be a slight benefit in VM performance from disabling mitigations on the host.
- Mitigations disabled on VM: Disabling mitigations on the host caused the VM workloads to finish an average of 0.2 seconds slower (0.27%) than with host mitigations enabled. While this result is surprising, it’s well within the margin of error and is therefore not statistically significant.
| machine tested | host mitigations | VM mitigations | n | mean | std dev | marg err |
|---|---|---|---|---|---|---|
| VM | on | off | 16 | 79.6 | 1.966 | 0.963 |
| VM | off | off | 16 | 79.8 | 3.066 | 1.502 |
| VM | on | on | 16 | 90.9 | 1.732 | 0.849 |
| VM | off | on | 16 | 89.7 | 1.94 | 0.951 |
Impact of disabling mitigations on the VM
- Mitigations disabled on host: Disabling mitigations on the VM caused the VM workloads to finish an average of 9.9 seconds (12%) faster than with mitigations enabled.
- Mitigations enabled on host: Disabling mitigations on the VM caused the VM workloads to finish an average of 11.3 seconds (14.2%) faster than with mitigations enabled.
| machine tested | host mitigations | VM mitigations | n | mean | std dev | marg err |
|---|---|---|---|---|---|---|
| VM | off | on | 16 | 89.7 | 1.94 | 0.951 |
| VM | off | off | 16 | 79.8 | 3.066 | 1.502 |
| VM | on | on | 16 | 90.9 | 1.732 | 0.849 |
| VM | on | off | 16 | 79.6 | 1.966 | 0.963 |
Speculative execution vulnerabilities discussion
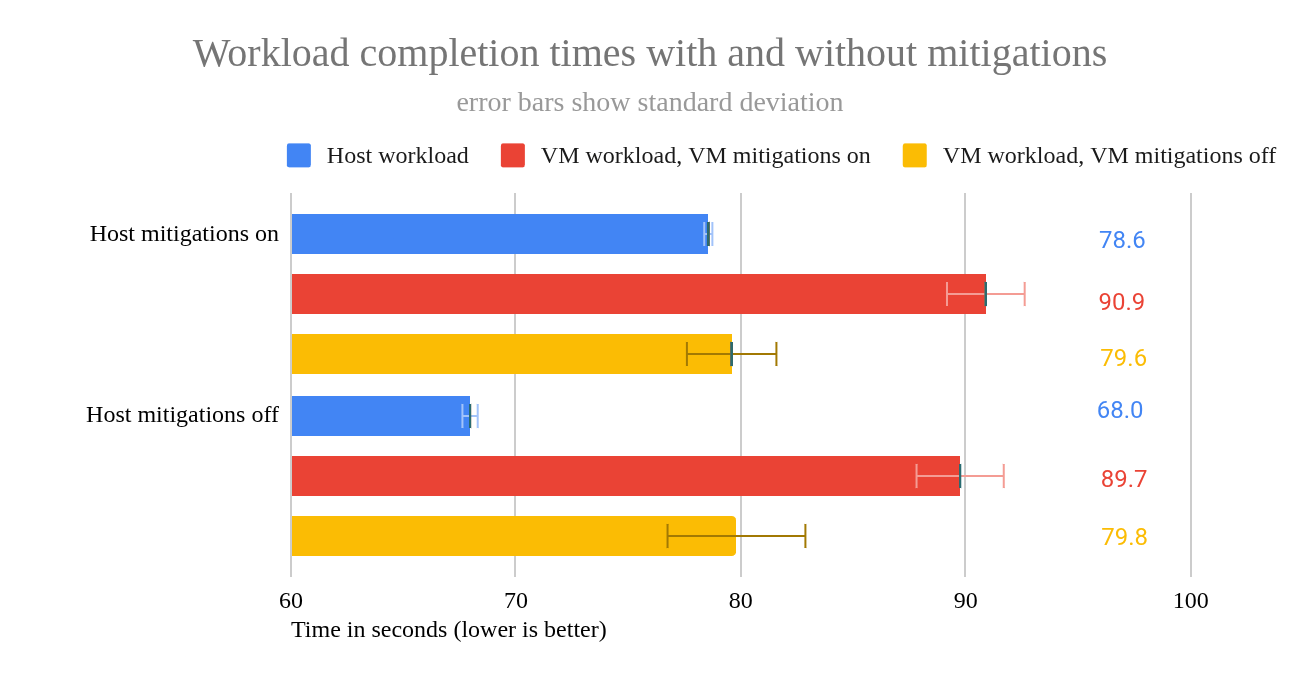
These data show that disabling mitigations on the host provides a clear 15.5% performance boost for host workloads. But disabling mitigations on the host provides almost no benefit for VM workloads.
On the other hand, disabling mitigations on VMs do provide a clear 12% or 14% performance benefit, depending on whether mitigations on the host were disabled or enabled. I’ll close this section by showing these results in a chart (Figure 7).
VM NIC queues and CPU pinning
The libvirt framework allows virtual network interface cards (NIC) queues to be configured, distributing network traffic workload across CPU cores. This is accomplished by adding <driver name="vhost" queues="16"/> to the XML description of the NIC. This is what it looks like in my test VM:
<interface type="bridge">
  <mac address="52:54:00:19:0a:b5"/>
  <source bridge="br0"/>
  <model type="virtio"/>
  <driver name="vhost" queues="16"/>
  <link state="up"/>
  <address type="pci" domain="0x0000" bus="0x01" slot="0x00" function="0x0"/>
</interface>
This adds 16 queues to the VM’s NIC. I experimented with several values for the number of queues, just one, which is what you get when that XML element is absent, but also 4, 8, 16, 20, 28, and 32. When testing with 32 queues, I had to pin virtual CPUs to host CPUs - if I did not do this, the VM would hang while booting.
Testing the GDB build workload shows no statistically significant difference when comparing the mean completion times between the various queue sizes. However, for smaller queue sizes, I saw a greater standard deviation with only 5 samples. With a queue size of 1, after running 5 tests, the standard deviation was 4.2 and the margin of error (with a 95% confidence interval) was 3.7. So, the fact that I get more consistent results with a larger number of queues is of some benefit.
In addition to the GDB workload, I also tested using iperf3, a tool commonly used for network testing. While I do sometimes use it to check for problems with physical NICs, I more frequently use it to check network bandwidth between a VM and its host. To measure network performance, I ran iperf3 -s on the host (server) and iperf3 -P 16 -c name-of-host on the VM (client), using 16 parallel streams to simulate concurrent connections.
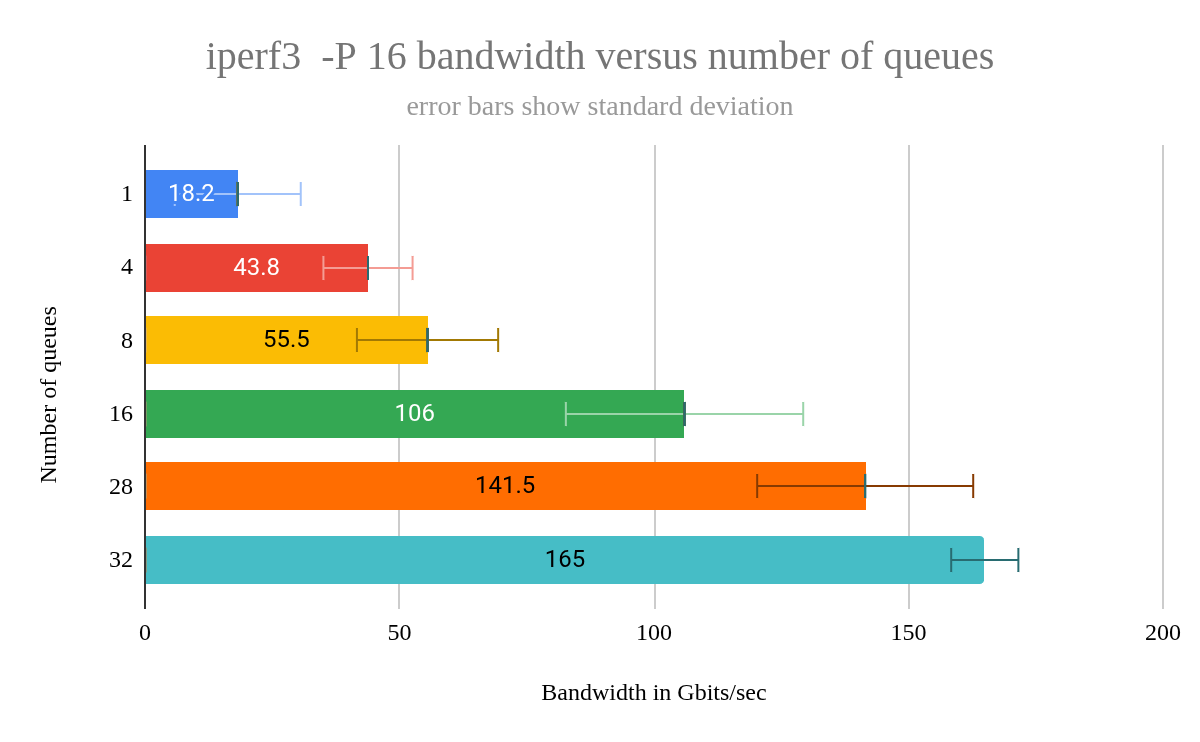
The standard deviation was the lowest, at just 4.3, for queues=32. But, as noted earlier, in order to get the machine to boot, I had to utilize CPU pinning. I arranged for each VM cpu to be pinned (assigned to) a host cpu (core) such that no cores would be shared due to hyperthreading. I suspect that CPU pinning had a greater impact on reducing standard deviation than queue count. So, if you want more deterministic performance in your VM, consider using CPU pinning.
CPU pinning is accomplished by using the following XML—this example is what I used for assigning 32 cores on my VM to 32 cores on the host:
<cputune>
  <vcpupin vcpu="0" cpuset="0"/>
  <vcpupin vcpu="1" cpuset="1"/>
...
  <vcpupin vcpu="31" cpuset="31"/>
</cputune>
Changes that had no significant impact
The following changes showed no measurable performance difference:
- Kernel command line options
amd_iommu=on iommu=pt:amd_iommu=onenables the AMD IOMMU (Input/Output Memory Management Unit), which provides hardware-level memory protection and address translation for devices assigned to VMs.iommu=pt(passthrough mode) allows direct access to physical devices without virtualization overhead. Together, they are required for efficient GPU or NIC passthrough to VMs. I found that these options do not harm workload performance when used. - NFS server on the host: I expected a small performance gain due to reduced network latency between VM and host, but no difference was observed.
- Sharing the host filesystem via
virtiofs:virtiofsis a high-performance, low-overhead filesystem sharing mechanism for virtualized environments. It uses the virtio framework to provide direct access to the host’s filesystem from the VM, reducing virtualization overhead compared to traditional methods like NFS. On the EPYC machine, it performed worse than NFS. On another system, it was slightly faster. - Using single root I/O virtualization (SR-IOV) to assign a physical NIC to a VM: SR-IOV allows a single physical NIC to appear as multiple virtual NICs, each with direct hardware access. This reduces virtualization overhead and improves network performance. In my tests, it improved
iperf3results between the VM and the NFS server but had no effect on GDB build performance. - Changing the
tunedprofile on the VM: No significant performance change was observed.
Action items
If you manage AMD systems and are wondering if your VM performance might be suffering from either not using one of the amd-pstate operation modes or from using a less than optimal tuned profile, a quick way to check is to run this command:
cat /sys/devices/system/cpu/cpu0/cpufreq/scaling_driverThis command will likely show one of the following:
acpi-cpufreq: Your VM performance might not be as good as it could be.acpi-pstate-epp: Your system is using theamd-pstatedriver inactivemode. It’s probably performing pretty well.acpi-pstate: Your system is using theamd-pstatedriver in eitherpassiveorguidedmode. If it’s inpassivemode, you should find out why and then try to switch to eitherguidedoractivemode.- There are other possibilities too, but those are beyond the scope of this article.
If the amd-pstate driver is in use, you can find out which mode it’s in via this command:
cat /sys/devices/system/cpu/amd_pstate/statusIf the amd-pstate driver is not in use, this file will not exist. But if it is, passive, guided, and active are the possible outputs with the obvious meanings.
If your AMD system is using the acpi-cpufreq scaling driver, then you can try two things, either individually or in combination:
- Install the
tunedpackage and then use thetuned-adm profilecommand to change the profile. The command,tuned-adm activecan be used to see the current profile. If thebalancedprofile is in use, you might try changing the profile tothroughput-performance. Try to forcibly switch to using the
amd-pstatedriver. This can be accomplished by passing, e.g.,amd_pstate=activeon the kernel command line. On systems using the GRUB bootloader, edit/etc/default/gruband addamd_pstate=activeto theGRUB_CMDLINE_LINUXsetting. Once this is done, on Fedora or RHEL systems, dosudo grub2-mkconfig -o /etc/grub2-efi.cfg. (Instructions for updating GRUB on other systems are readily available elsewhere.)Once this is done, reboot and then use the commands shown earlier in this section to verify that the
amd-pstatedriver is in use and using the expected operation mode.
Final thoughts
Changing the tuned profile to virtual-host delivered an immediate performance boost for the GDB build workload—but at a steep cost: idle power consumption skyrocketed. This trade-off led me to investigate amd-pstate, where I discovered that even with amd-pstate=active, the virtual-host profile still consumes significantly more power than balanced-performance or throughput-performance.
For my system, the virtual-host profile is not ideal. Instead, I’ll use either the balanced-performance profile I created or throughput-performance, which delivers excellent performance and maintains low idle power.
This experience taught me that performance tuning isn’t just about speed, it’s about balancing trade-offs. The best profile isn’t always the fastest—it’s the one that fits your workload and power constraints.
Key takeaways from this study
- Changing the
tunedprofile can have a surprising impact, but check that it doesn’t negatively impact idle power consumption. amd-pstateis essential for modern AMD systems, andactiveorguidedmodes offer the best balance of performance and power efficiency.- Using
mitigations=offcan improve performance, but do not use it unless you fully understand the security risks. - Small changes, like enabling
amd-pstateor changing thetunedprofile, can close the gap between bare metal and VM performance.
This exploration of VM performance demonstrates that significant gains are achievable through targeted tuning. While the initial performance gap between bare metal and the VM was substantial, careful adjustments to system profiles, CPU scaling drivers, and a focus on power efficiency narrowed that gap considerably. The experience underscored a crucial principle: performance tuning isn’t simply about maximizing speed, but about finding the optimal balance between performance and power consumption.
By embracing experimentation, meticulous measurement, and a willingness to challenge assumptions, you can unlock the full potential of your systems—whether you’re building debuggers or tackling any other demanding task.
Last updated: September 5, 2025