Disclaimer
This blog explores a proof of concept demonstrating the value of combining Kueue and KEDA/the custom metrics autoscaler to greatly enhance GPU utilization. This integration is not officially supported or available out of the box. However, by following the steps in this blog, you will be able to see a working example of Kueue and the custom metrics autoscaler in action.
As the AI industry grows, GPU resources are becoming harder to obtain and more expensive. Most well-known cloud services charge based on allocated resources, not by actual usage, so you're often paying even when your GPUs are sitting idle. This is like leaving the lights on in an empty stadium or owning a sports car that just sits in your driveway. Wasted resources quickly drive up costs, so it is essential to maximize GPU resource consumption to get the best value for your investment.
From idle to ideal
Red Hat OpenShift AI is a unified, enterprise-ready platform built on open source projects designed for building, training, fine-tuning, and deploying AI/ML models on OpenShift. It also includes capabilities for managing compute resource quotas efficiently. This all-in-one solution brings together tools and components such as Kueue and KubeRay.
Kueue orchestrates and manages AI workloads, such as Ray clusters, while enforcing resource quotas. This ensures optimal utilization of resources across teams and workloads, leading to greater throughput, efficiency, and reduced operational costs.
If data scientists don't scale down their long-running AI workloads (like Ray clusters) when they're not in use, they can cause huge operational costs by holding onto idling GPUs. This also blocks other workloads waiting for resources in the queue. This is where the custom metrics autoscaler and Kueue come together to provide the ability to scale any deployment, StatefulSet, and custom resource to zero, which enhances cost efficiency and throughput.
What is Kueue?
Kueue is a Kubernetes-native job queuing system designed to orchestrate, manage, and schedule AI/ML workloads. It allows you to define resource quotas to arbitrate how a cluster's compute capacity is distributed and shared between different workloads.
This judicious arbitration leads to greater efficiency, as resources are shared according to predetermined rules. In most cases, a resource quota is shared across a team, and Kueue’s queuing system ensures fairness and prioritization when handling workloads. In short, Kueue will check the queue and admit a workload only if it fits the defined quota and if enough resources are available. After the workload is admitted, pods are created. Kueue also provides preemption based on priority, all-or-nothing scheduling, and many more configurable features.
What is the custom metrics autoscaler?
The custom metrics autoscaler is the OpenShift equivalent of the Kubernetes event-driven autoscaler (KEDA) community operator, which simplifies application autoscaling. The custom metrics autoscaler can scale any deployment, StatefulSet, custom resource, or AI/ML workload to meet demand and perform scale-to-zero. In addition to the CPU and memory metrics provided by OpenShift, the custom metrics autoscaler can provide custom metrics from Prometheus or any metrics adapter. You can use custom metrics to trigger scaling of your workloads based on your specific criteria. Let's have a look at the custom metrics autoscaler architecture, as shown in Figure 1.
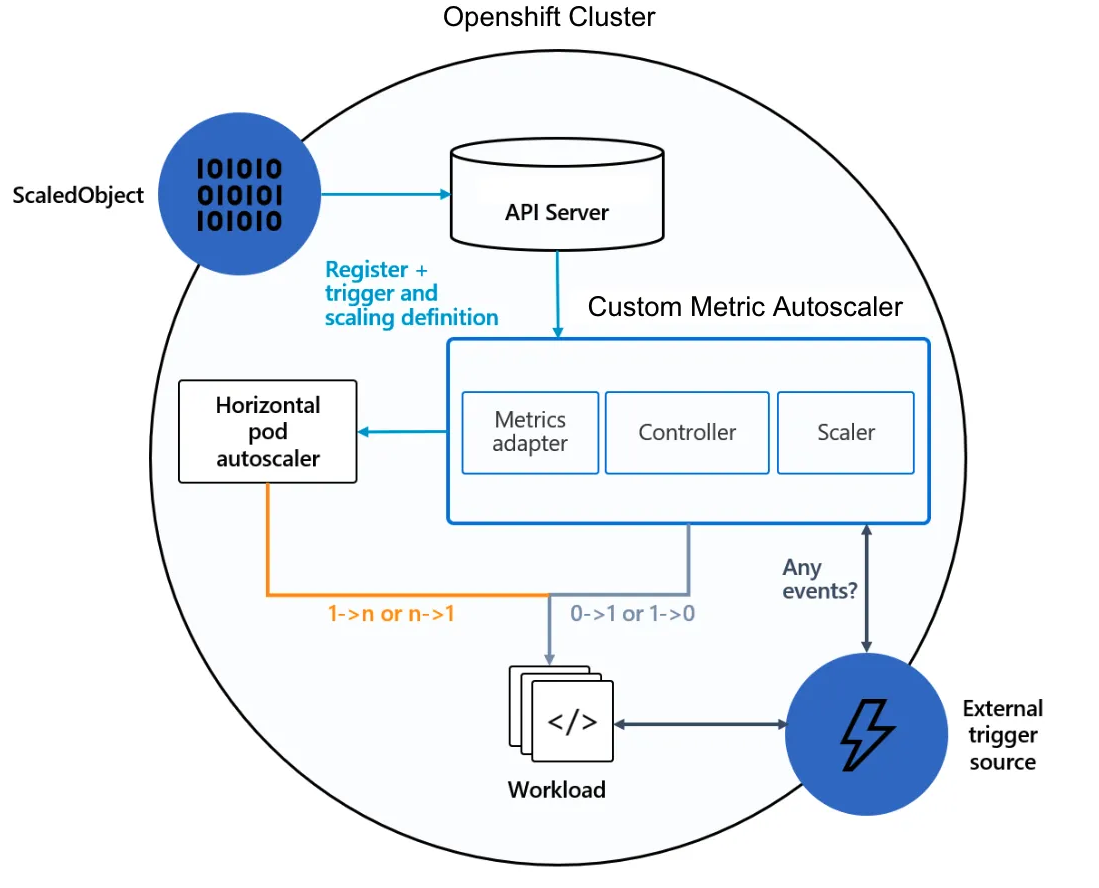
To briefly explain Figure 1, let’s assume we have already created an AI workload. We start with a ScaledObject resource, which is where we define how to scale our workload based on the metrics and query we provided. Then, the Kubernetes API Server receives the ScaledObject and its definitions. We can then see the custom metrics autoscaler components, which are made of a metrics adapter (used to expose custom metrics to the Kubernetes Horizontal Pod Autoscaler, HPA), a controller to manage the lifecycle of the scaled objects, and a scaler (used to check the external source for events and metrics).
We can observe that the HPA takes care of scaling the workload from 1 to n replicas, and from n to 1 replicas. What makes KEDA and the custom metrics autoscaler unique is their ability to scale workloads from 1 to 0 replicas and from 0 to 1 replicas based on our custom metrics. We aim to integrate these specific capabilities with Kueue to maximize the GPU utilization.
Efficient AI workload management with KEDA and the custom metrics autoscaler alongside Kueue on OpenShift AI
In this demonstration, we have two allocatable GPU resources available. We are going to create two Ray clusters, each requesting 2 GPUs, which are our long-running AI workloads. We configure the custom metrics autoscaler to retrieve GPU utilization metrics from Prometheus and check if usage remains at 0 for over 2 minutes. If so, the custom metrics autoscaler will scale the workload resource down to zero, which will cause Kueue’s workload controller to terminate the Ray cluster pods.
We will first set up our OpenShift cluster before we get to see the custom metrics autoscaler and Kueue in action. Without further ado, let’s get started!
Note
For the purposes of this demo, the cooldown period before scaling down is set intentionally low to showcase scale-to-zero in action faster. In a real-world scenario, it’s recommended to set this to at least an hour to avoid prematurely shutting down workloads.
Prerequisites
To follow the demo, you need access to a Red Hat OpenShift cluster (version 4.14 or higher) with the following components installed:
- The Red Hat OpenShift AI Operator (version 2.13 or higher) with the
ray,dashboard,workbenches, andcodeflarecomponents enabled. Ensure the Kueue component is disabled. - A custom version of Kueue modified specifically for this PoC. This version contains the necessary changes to integrate with the custom metrics autoscaler. Installation instructions are included in the provided link.
- Enough worker nodes with at least 2 allocatable GPUs. For this demo, we are using
g4dn.xlargeNVIDIA GPU nodes (1 GPU, 4 vCPU, 16 GB RAM). - The Node Feature Discovery Operator, which detects hardware features and advertises them on the nodes.
- The NVIDIA GPU Operator with the appropriate
ClusterPolicyresource. - The custom metrics autoscaler, which integrates KEDA to OpenShift.
- Enable monitoring for user-defined projects in the cluster monitoring ConfigMap.
Note: Most Operators can be found and installed from the OperatorHub.
Relabel the metric labels provided by dcgmExporter
By default, the NVIDIA GPU Operator enables the dcgmExporter to expose GPU metrics. These metrics are used to trigger scale-to-zero on workloads based on GPU utilization. However, it uses non-standard label names like exported_pod, and exported_namespace. The Prometheus instance for user workload monitoring resolves queries to namespace as opposed to exported_namespace, causing such queries to return no data points.
We can update the ServiceMonitor named nvidia-dcgm-exporter to relabel the metrics, mapping them to the expected label names so that queries return the correct results. If the configuration is being reconciled, similar relabling can be applied in the ClusterPolicy named gpu-cluster-policy to ensure the changes persist.
ServiceMonitor snippet:
apiVersion: monitoring.coreos.com/v1
kind: ServiceMonitor
metadata:
  name: nvidia-dcgm-exporter
  ...
spec:
  endpoints:
    - path: /metrics
      port: gpu-metrics
      relabelings:
        - action: replace
          replacement: '${1}'
          sourceLabels:
            - exported_namespace
          targetLabel: namespace
        - action: replace
          replacement: '${1}'
          sourceLabels:
            - exported_pod
          targetLabel: pod
Create a data science project
Now, we create a data science project named demo, which also serves as the namespace where we will apply our resources.
You can access the Red Hat OpenShift AI dashboard from the navigation menu at the top of the Red Hat OpenShift web console.
After logging into the dashboard using your credentials, navigate to Data Science Projects and click Create project to create a new project named demo.
Tip: Applying a YAML in the OpenShift console
In the next few steps, we are going to apply a number of resources to the cluster. The best way to do this is through the OpenShift console: click on the plus sign button on the top-right corner, paste in the YAML definition, and click Create to apply the resource.
Create the RBAC and TriggerAuthentication resources
In this step, we’ll set up the necessary permissions and authentication for the custom metrics autoscaler to query Prometheus for GPU utilization metrics. To do this, we’ll create several resources: a ServiceAccount, Secret, Role, and a RoleBinding.
RBAC YAML to apply:
apiVersion: v1
kind: ServiceAccount
metadata:
  name: thanos
  namespace: demo
---
apiVersion: v1
kind: Secret
metadata:
  annotations:
    kubernetes.io/service-account.name: thanos
  name: thanos-token
  namespace: demo
type: kubernetes.io/service-account-token
---
apiVersion: rbac.authorization.k8s.io/v1
kind: Role
metadata:
  name: thanos-metrics-reader
  namespace: demo
rules:
- apiGroups:
  - ""
  resources:
  - pods
  verbs:
  - get
- apiGroups:
  - metrics.k8s.io
  resources:
  - pods
  - nodes
  verbs:
  - get
  - list
  - watch
---
apiVersion: rbac.authorization.k8s.io/v1
kind: RoleBinding
metadata:
  name: thanos-metrics-reader
  namespace: demo
roleRef:
  apiGroup: rbac.authorization.k8s.io
  kind: Role
  name: thanos-metrics-reader
subjects:
- kind: ServiceAccount
  name: thanos
  namespace: demo
---
Moreover, these resources collectively allow us to create a TriggerAuthentication resource where we reference the token secret from the created ServiceAccount. This TriggerAuthentication object should be in the same namespace as the workload we want to scale. This is used by the custom metrics autoscaler to define how to authenticate to Prometheus and read metrics such as GPU utilization.
TriggerAuthentication YAML to apply:
apiVersion: keda.sh/v1alpha1
kind: TriggerAuthentication
metadata:
  name: keda-trigger-auth-prometheus
  namespace: demo
spec:
  secretTargetRef:
  - parameter: bearerToken
    name: thanos-token
    key: token
  - parameter: ca
    name: thanos-token
    key: ca.crt
Create a ClusterQueue, ResourceFlavor, and LocalQueue
Kueue uses a core set of 3 resources to manage cluster quotas and schedule AI/ML workloads effectively. We’ll now apply each of these resources to our cluster.
ClusterQueue
The first is the ClusterQueue, which is a cluster-scoped object that governs a pool of resources such as pods, CPU, memory, and hardware accelerators, such as NVIDIA GPUs. The ClusterQueue defines quotas for each ResourceFlavor that the ClusterQueue manages, including usage limits and order of consumption. We are going to create a ClusterQueue resource with enough resources, and set the quota to 2 NVIDIA GPUs.
ClusterQueue to apply:
apiVersion: kueue.x-k8s.io/v1beta1
kind: ClusterQueue
metadata:
  name: "cluster-queue"
spec:
  namespaceSelector: {}
  resourceGroups:
  - coveredResources: ["cpu", "memory", "pods", "nvidia.com/gpu"]
    flavors:
    - name: "default-flavor"
      resources:
      - name: "cpu"
        nominalQuota: 9
      - name: "memory"
        nominalQuota: 36Gi
      - name: "pods"
        nominalQuota: 5
      - name: "nvidia.com/gpu"
        nominalQuota: 2
ResourceFlavor
The second is the ResourceFlavor, which is an object that defines available compute resources in a cluster and enables fine-grained resource management by associating workloads with specific node types. Because our cluster consists of homogeneous nodes, we’ll use a generic, empty ResourceFlavor for this demo.
ResourceFlavor to apply:
apiVersion: kueue.x-k8s.io/v1beta1
kind: ResourceFlavor
metadata:
  name: default-flavor
LocalQueue
Lastly, the LocalQueue is a namespaced object that groups closely related workloads that belong to a single namespace. A namespace is typically assigned to a user or a team of the organization. A LocalQueue points to one ClusterQueue from which resources are allocated to run its workloads. For the demo, we’ll use the LocalQueue to submit Ray clusters, allowing Kueue to manage their scheduling.
LocalQueue to apply:
apiVersion: kueue.x-k8s.io/v1beta1
kind: LocalQueue
metadata:
  namespace: demo
  name: user-queue
spec:
  clusterQueue: cluster-queue
Create a workbench
Let’s now create a workbench. This is a Jupyter notebook that's hosted on OpenShift, and you'll conveniently run everything from there after it's created.
Navigate back to Data Science Projects, click the demo project we previously created, and then click the Create a workbench button.
In the Notebook Image section of the Create workbench page, select PyTorch (for NVIDIA GPU), and the default settings should suffice. Then, click Create workbench.
From the Workbenches tab, click the external link icon when the new workbench is ready.
Clone the example notebooks
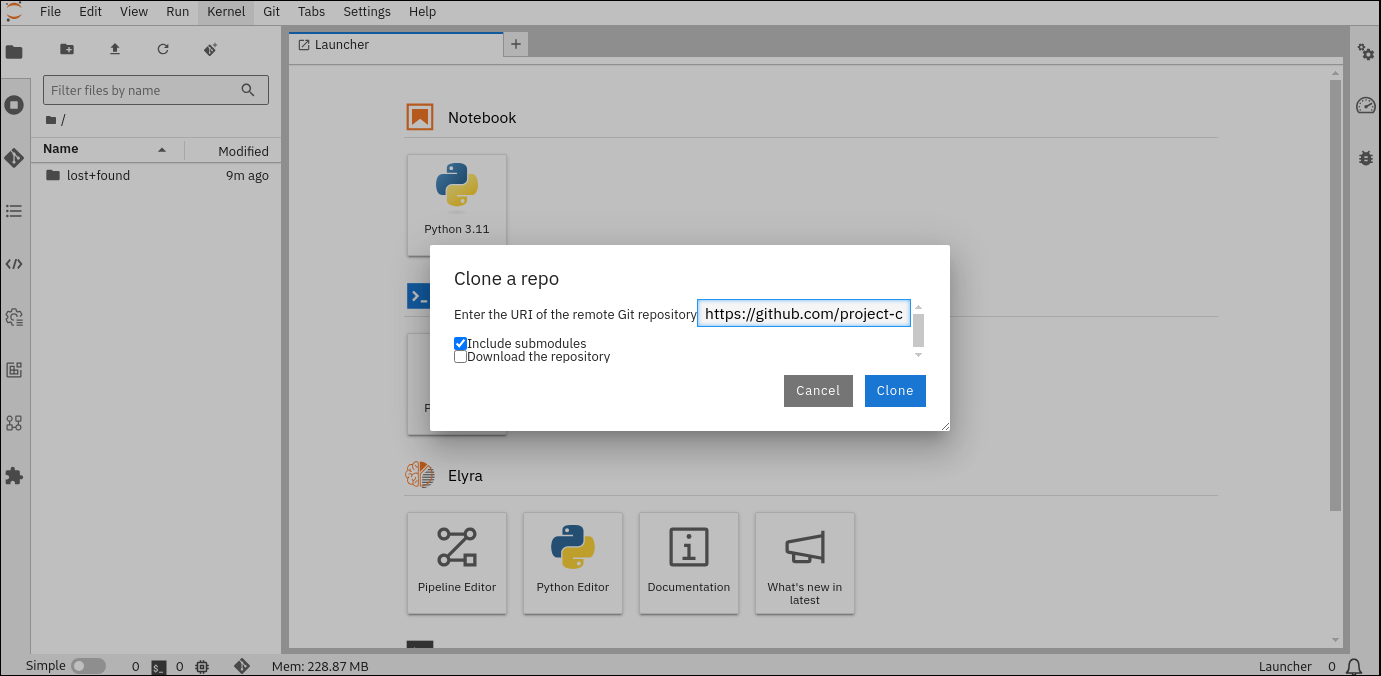
Click the Git icon on the left column and paste the following URL into the text box: https://github.com/project-codeflare/codeflare-sdk.git
Then click the Clone button to download the example notebooks for training, as shown in Figure 2. These notebooks will be used to trigger GPU usage.
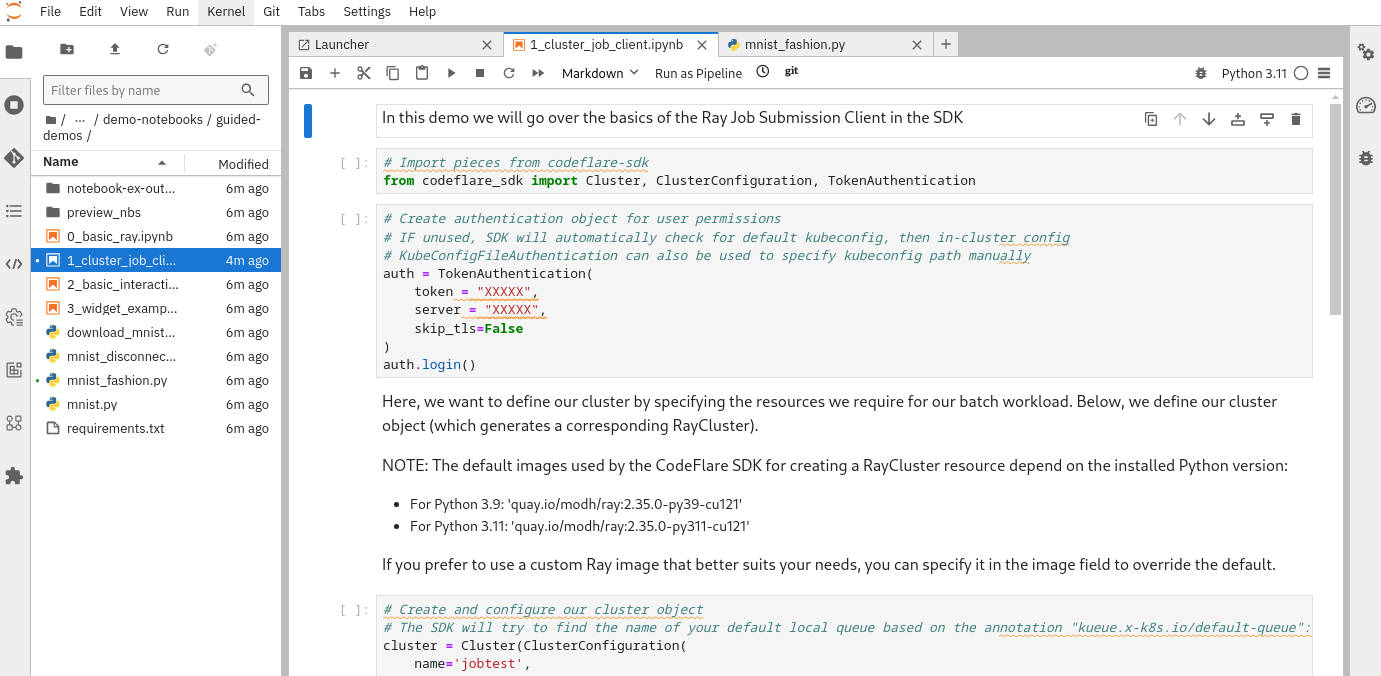
From there, navigate to the codeflare-sdk/demo-notebooks/guided-demos directory and open the 1_cluster_job_client.ipynb notebook, as shown in Figure 3.
Configure the training script
We are going to configure a training script that will be submitted to our Ray cluster, simulating a realistic AI training scenario. This will sustain GPU utilization, and allow us to obtain usage metrics.
Navigate to the codeflare-sdk/demo-notebooks/guided-demos directory and open the mnist_fashion.py Python file (Figure 4).
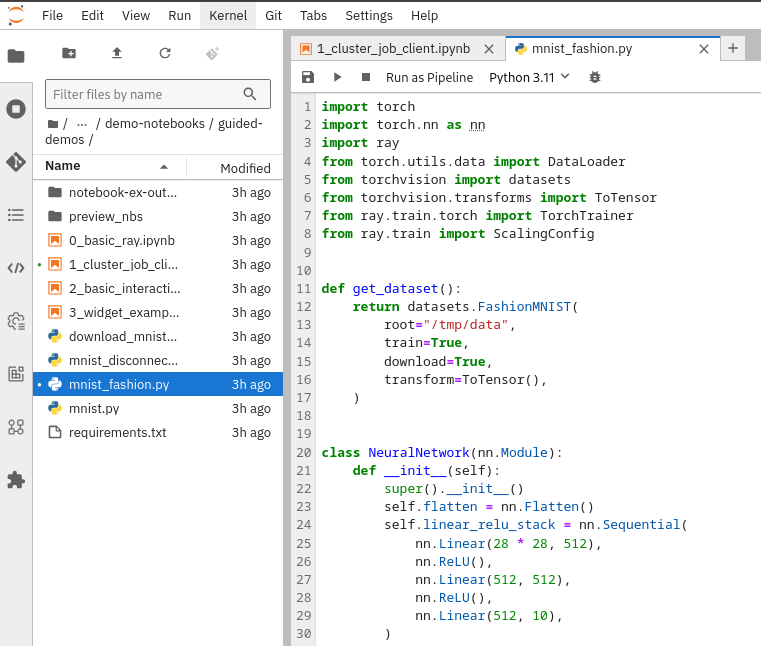
Edit the num_epochs parameter to 1,000, to ensure the training job runs for an extended period of time.
def train_func_distributed():
    num_epochs = 1000 # Set to 1000
Edit the num_workers parameter to 2, as we are going to be creating a Ray cluster consisting of a head node and one worker node. Note: In this Ray training script, the head is included in the num_workers count.
trainer = TorchTrainer(
    train_func_distributed,
    scaling_config=ScalingConfig(
        # num_workers = number of worker nodes with the ray head node included
        num_workers=2, # Set to 2
Logging in
In the 1_cluster_job_client.ipynb example notebook, the CodeFlare SDK creates the Ray cluster resource that provides KubeRay with the configuration details for creating the Ray cluster head and worker pods. The SDK must authenticate to the OpenShift API server and be granted the permission to create the Ray cluster resource.
To retrieve your bearer token and server address, open the OpenShift console, click on your username in the top-right corner, and click Copy login command from the drop-down menu, as shown in Figure 5. In the new tab that opens, click Display Token to view your token and server address values.
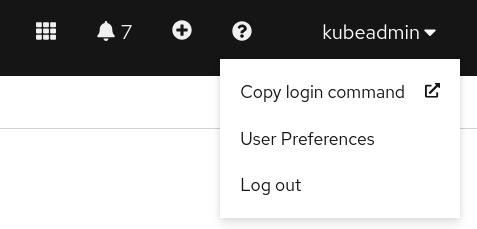
With the token and server address retrieved, you can provide these values in the following cell of the notebook before executing it:
auth = TokenAuthentication(
    token = '<API_SERVER_BEARER_TOKEN>',
    server = '<API_SERVER_ADDRESS>',
    skip_tls=False,
)
auth.login()
Create two Ray clusters
With the CodeFlare SDK we will create two Ray clusters requesting 2 GPUs each—one for the head node and one for the worker node. This setup will ensure each cluster requests to fully consume the GPU quota defined earlier in our ClusterQueue.
Below is the configuration for the first Ray cluster:
cluster = Cluster(ClusterConfiguration(
    name='first-raycluster',
    namespace='demo',
    head_cpu_requests=2,
    head_cpu_limits=2,
    head_memory_requests=8,
    head_memory_limits=8,
    head_extended_resource_requests={'nvidia.com/gpu':1},
    worker_extended_resource_requests={'nvidia.com/gpu':1},
    num_workers=1,
    worker_cpu_requests=2,
    worker_cpu_limits=2,
    worker_memory_requests=8,
    worker_memory_limits=8,
    local_queue="user-queue" # Specify the LocalQueue name
))
Then, you can run the following cells in the notebook to create and display the cluster details:
cluster.up()
cluster.wait_ready()
cluster.details()
To create the second Ray cluster, re-use the same cluster configuration as above, but change the name to second-raycluster. Then, run the same cells to create this second Ray cluster.
At this point, if you return to the OpenShift web console, navigate to Home > Search, and search for RayCluster and Workload, you will find the two Ray cluster resources that you created, and also two corresponding workload resources (Figure 6).
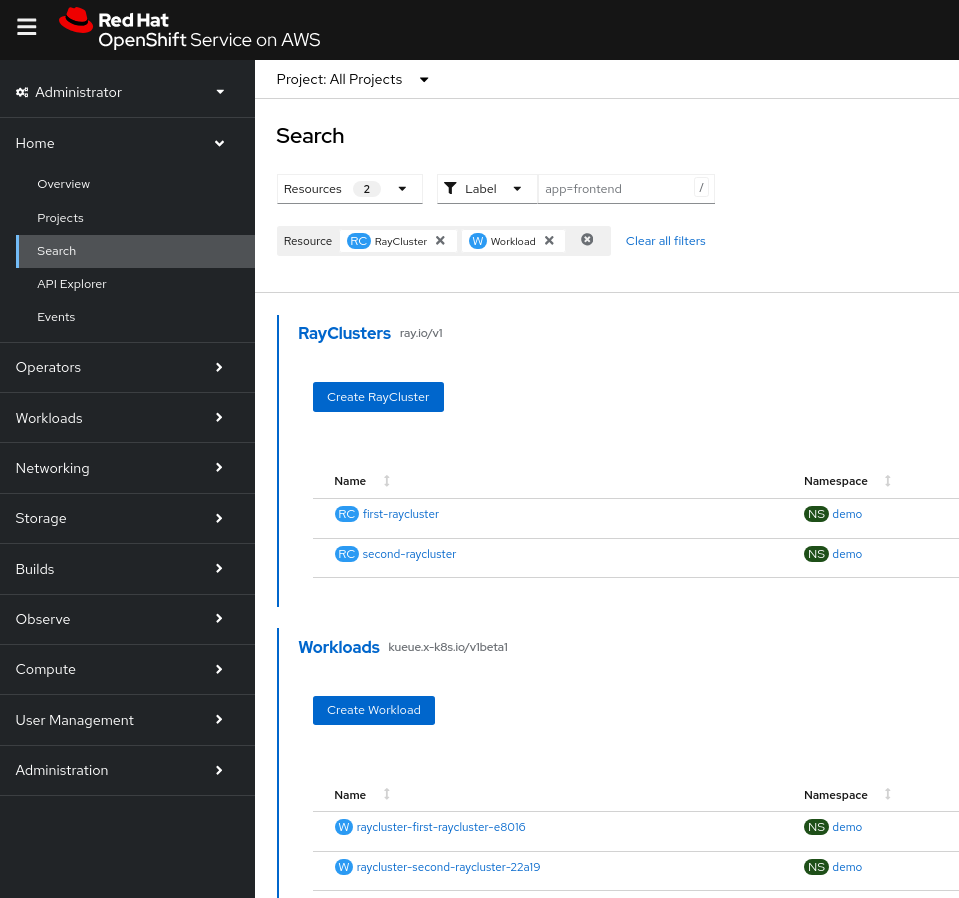
Kueue automatically creates and manages these Workload objects which represent the resource requirements of an arbitrary workload submitted for scheduling; in this case, Ray clusters. These Workload objects are added to the ClusterQueue, where they wait to be scheduled based on resource availability and queue policies. Kueue uses the information in the workload to decide when to admit the workload based on the quota.
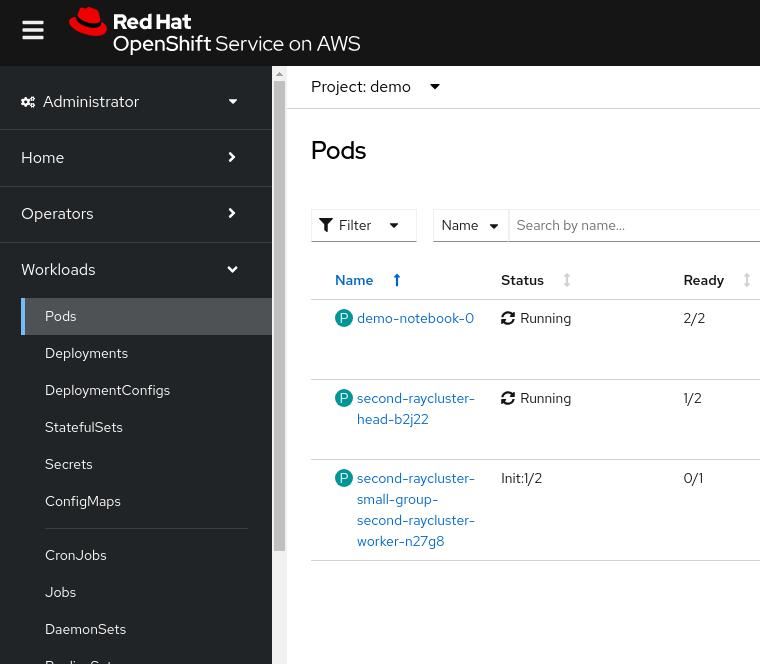
In the OpenShift web console, navigate to Workloads > Pods. Notice that the first workload has been admitted by Kueue because it fits within the available quota, as shown in Figure 7. The second workload, however, is suspended while it waits for resources to become available, as the quota is currently set to 2 GPUs in our ClusterQueue.

Submit the training job
In our notebook, initialize the ClusterConfiguration by updating the name to first-raycluster and running the cell.
Submit our configured training script to our running Ray cluster by running the following two cells in the Jupyter notebook:
# Initialize the Job Submission Client
"""
The SDK will automatically gather the dashboard address and authenticate using the Ray Job Submission Client
"""
client = cluster.job_client
# Submit an example mnist job using the Job Submission Client
submission_id = client.submit_job(
entrypoint="python mnist_fashion.py",
runtime_env={"working_dir": "./","pip": "requirements.txt"},
)
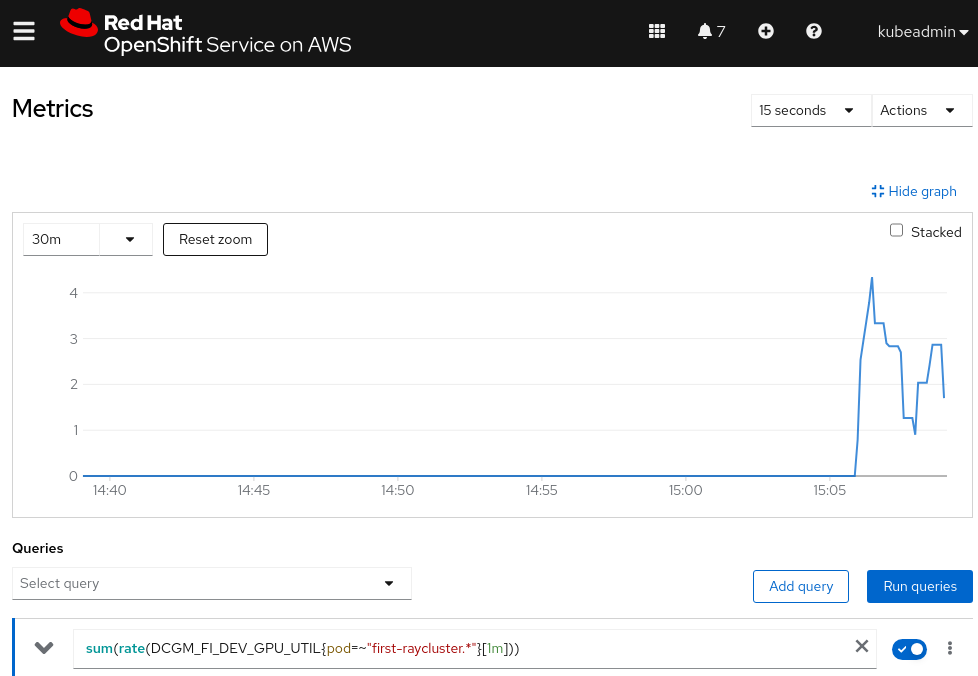
print(submission_id)In the OpenShift web console, navigate to Observe > Metrics, and then run the following query to check for GPU utilization:
sum(rate(DCGM_FI_DEV_GPU_UTIL{pod=~"first-raycluster.*"}[1m]))Wait for the graph to show GPU utilization, as shown in Figure 8.
The custom metrics autoscaler and Kueue in action
At this stage, we have two Ray clusters, each associated with a Workload custom resource (CR). One of the workloads has been admitted by Kueue and is actively running a training script using GPUs. The other workload remains suspended and is waiting in the queue for GPU resources to become available.
While the training script is running, apply the following ScaledObject resource in the demo namespace. In the spec.scaleTargetRef field, we specify that the target for scaling is the Workload CR associated with the first Ray cluster. The ScaledObject is configured to scale the workload between 0 and 1 based on GPU utilization from the Ray cluster pods, polling every 30 seconds and applying a 60-second cooldown period after scaling events.
Essentially, if the first Ray cluster shows no GPU utilization over the past minute, it will automatically scale down to zero replicas after the cooldown period.
apiVersion: keda.sh/v1alpha1
kind: ScaledObject
metadata:
  name: scaledobject
  namespace: demo
spec:
  scaleTargetRef:
    apiVersion: kueue.x-k8s.io/v1beta1
    name: raycluster-first-raycluster-e8016
    kind: Workload
  minReplicaCount: 0
  maxReplicaCount: 1
  pollingInterval: 30
  cooldownPeriod: 60
  triggers:
  - type: prometheus
    metadata:
      serverAddress: https://thanos-querier.openshift-monitoring.svc.cluster.local:9092
      namespace: demo
      metricName: s0-prometheus
      threshold: '9999'
      query: sum(rate(DCGM_FI_DEV_GPU_UTIL{pod=~"first-raycluster.*"}[1m]))
      authModes: bearer
    authenticationRef:
      name: keda-trigger-auth-prometheus
      kind: TriggerAuthentication
In the ScaledObject CR, the status section confirms that it has been set up correctly:
status:
  conditions:
    - message: ScaledObject is defined correctly and is ready for scaling
      reason: ScaledObjectReady
      status: 'True'
      type: Ready
Now, let’s stop the training script to make our Ray cluster become idle and unused. We can stop the training script by running the following command in a cell in our notebook:
client.stop_job(submission_id)After a few minutes, you should observe GPU usage going down to 0, as shown in Figure 9.
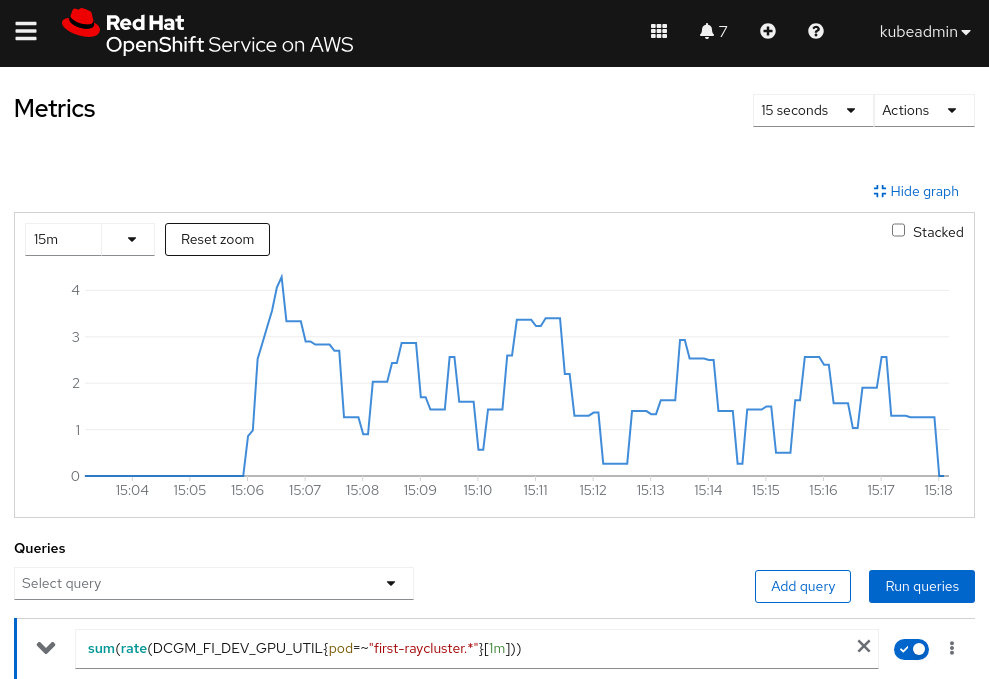
The custom metrics autoscaler will detect that there is no GPU utilization in the past minute, and it will wait for the cooldown period before scaling down the replica count of the Workload CR to 0. After the replica count is scaled down, Kueue’s workload controller will deactivate the workload, terminate the pods, and automatically admit the next pending workload. This ensures that resources are efficiently reallocated, allowing the next workload to start without any manual intervention, as shown in Figure 10.
Conclusion
Through this deep dive, we demonstrated how Kueue and the custom metrics autoscaler can work together to bring intelligent scheduling and resource optimization to OpenShift. By integrating the custom metrics autoscaler, we introduced dynamic scaling behavior that enables automatic deactivation of idle workloads, seamless cleanup of resources, and immediate admission of pending workloads, without requiring manual intervention.
