In modern applications, autoscaling is crucial to maintaining responsiveness, efficiency, and cost-effectiveness. Workloads often experience fluctuating demand, and scaling enables dynamic resource allocation, preventing performance bottlenecks and ensuring high availability. Without effective scaling, applications risk over-provisioning resources, leading to unnecessary costs or under-provisioning, which can result in degraded performance and potential downtime.
Autoscaling in Red Hat OpenShift and Kubernetes ensures responsiveness, efficiency, and cost-effectiveness by dynamically adjusting resources. Key mechanisms include horizontal pod autoscaling (HPA) for scaling pods, vertical pod autoscaling (VPA) for optimizing resource allocation, and cluster autoscaling for managing worker nodes. These features enhance resilience, reduce latency, and optimize costs in cloud-native environments.
Traditional scaling mechanisms rely on system resource metrics like CPU or memory to trigger scaling actions. However, there are scenarios where these traditional mechanisms fall short, especially when dealing with more specialized workloads like GPU-accelerated applications, number of incoming requests, queue length, etc.
Custom metrics autoscaler (KEDA) and Prometheus
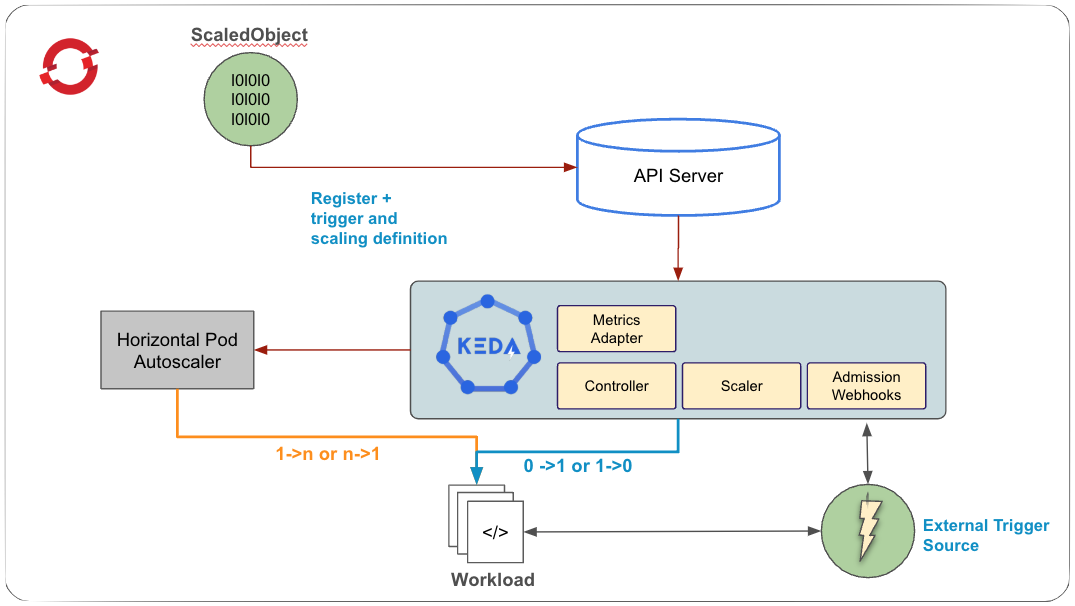
The custom metrics autoscaler operator, based on KEDA (Kubernetes event-driven autoscaler), enables autoscaling using events and custom metrics. It extends the horizontal pod autoscaler by providing external metrics and managing scaling to zero. The operator has two main components:
The operator controls workload scaling and manages custom resources.
The metrics server supplies external metrics to the OpenShift API for autoscaling.
To use the custom metrics autoscaler operator, you define a ScaledObject or ScaledJob for your workload. These custom resources (CRs) specify the scaling configuration, including the deployment or job to scale, the metric source that triggers the scaling, and other parameters, such as the minimum and maximum number of replicas. Figure 1 depicts the KEDA architecture.
Prometheus is an open source monitoring and alerting toolkit under the Cloud Native Computing Foundation (CNCF). It collects metrics from various sources, stores them as time-series data, and supports visualization through tools like Grafana or other API consumers.
Figure 2 provides a summary of how things work at a high level. We will discuss how to set up the custom metrics autoscaler in detail in the sections that follow.
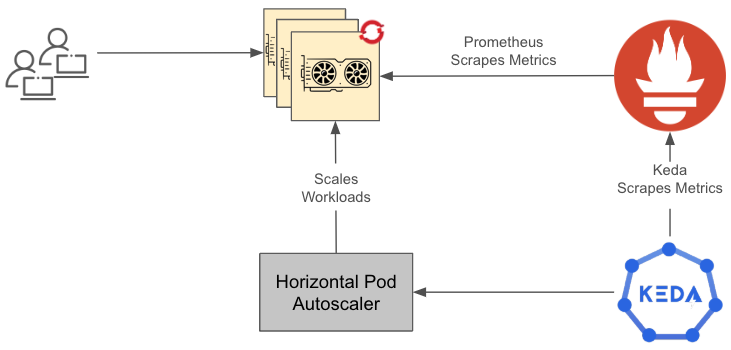
In this diagram:
- The GPU application receives requests, and the resource utilization hits a threshold.
- Prometheus is configured to scrape those metrics.
- Prometheus scaler in KEDA is configured and deployed to autoscale based on the utilization metrics.
The procedure
Before you can initiate the procedure, ensure that you have:
- Admin access to Red Hat OpenShift Container Platform.
- Access to
ocCLI. - Monitoring of user-defined workloads enabled in OpenShift.
- An inference application deployed on Red Hat OpenShift (feel free to deploy any model of your preference).
The procedure is as follows:
- Install the custom metrics autoscaler operator.
- Create KedaController instance.
- Set up a secret. This is used by TriggerAuthentication for accessing Prometheus and contains token and ca cert.
- Create TriggerAuthentications. This is used to describe authentication parameters.
- Create ScaledObject to define the triggers and how the custom metrics autoscaler should scale your application.
Next, we will walk through this procedure in detail.
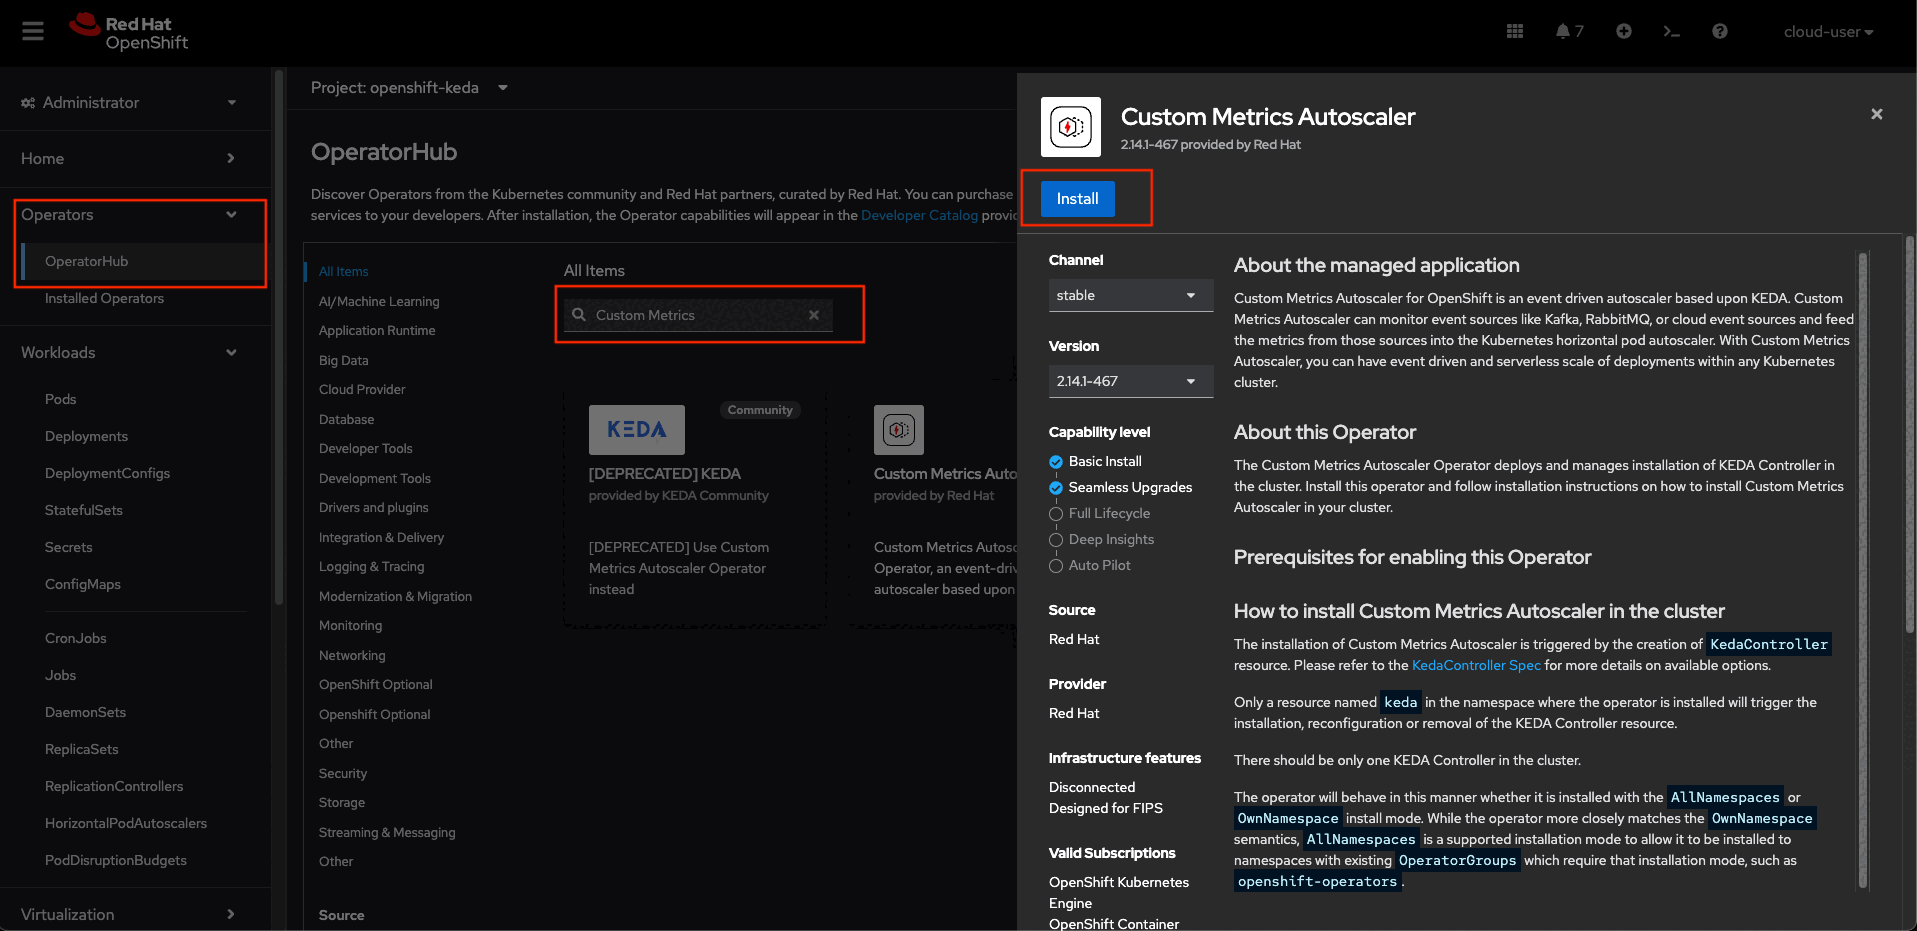
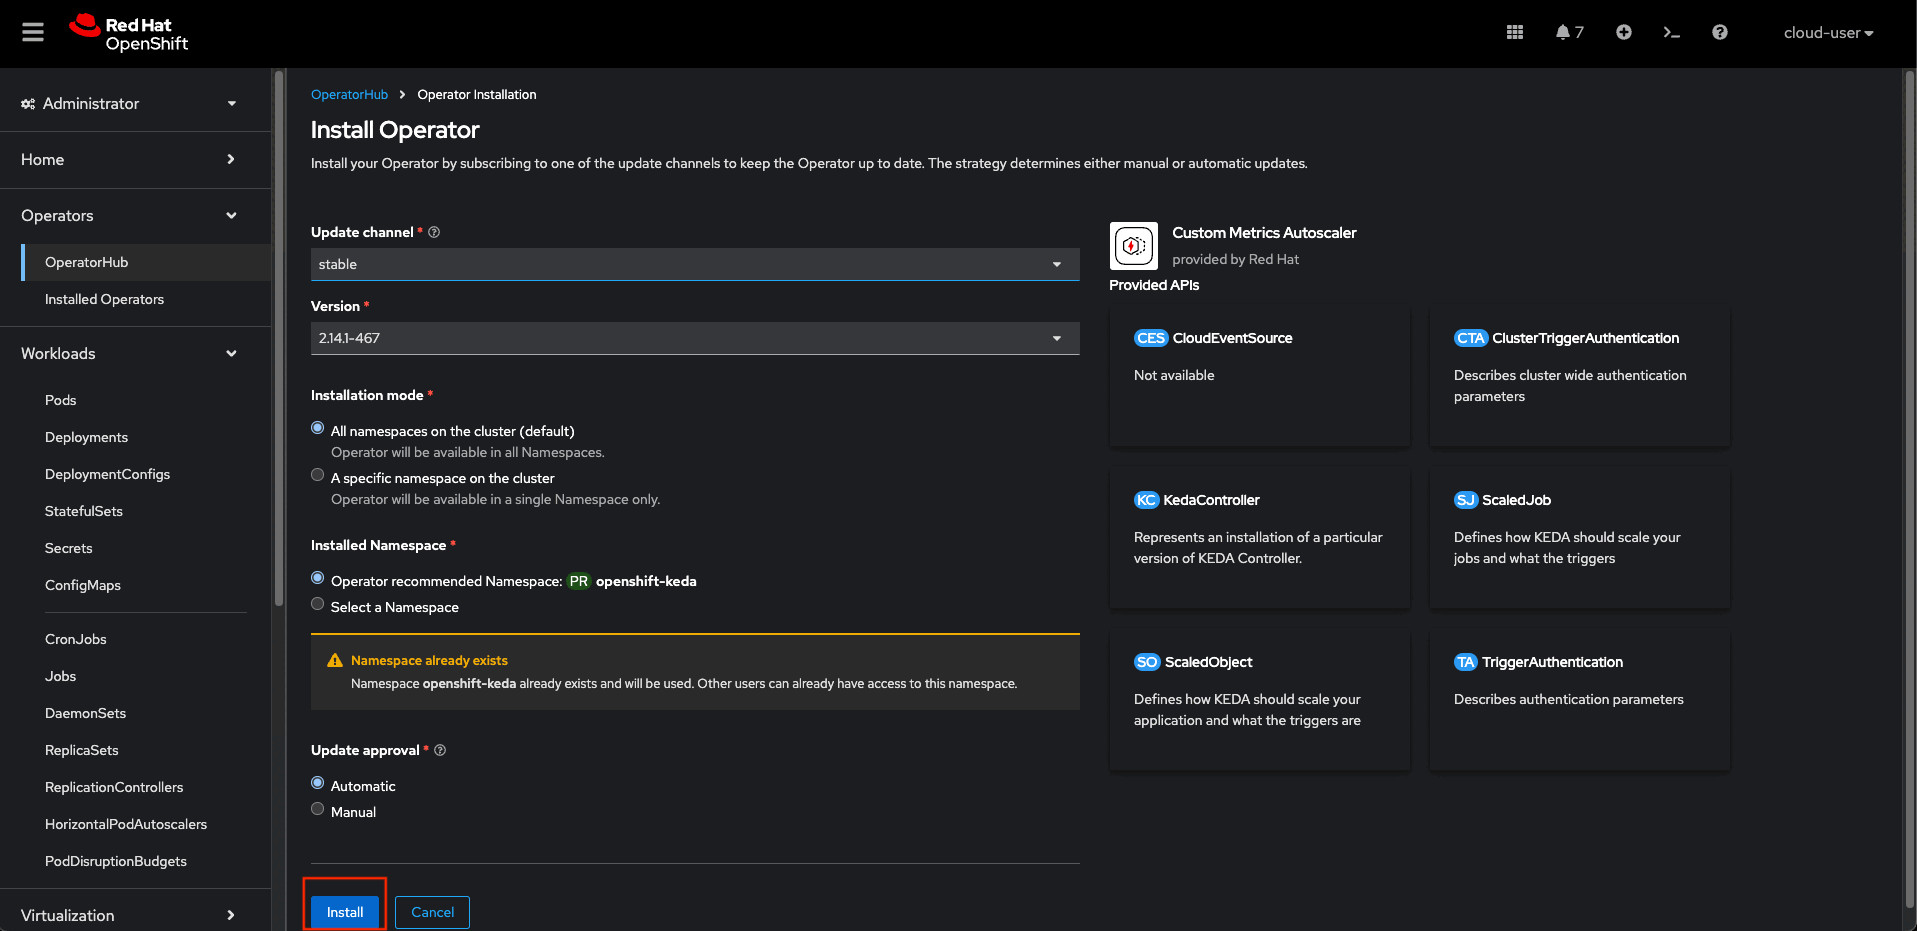
Install custom metrics autoscaler operator
First, install the custom metrics autoscaler operator:
- In the OpenShift Container Platform web console, click Operators -> OperatorHub.
- Choose Custom Metrics Autoscaler from the list of available operators, and click Install.
- On the Install Operator page, ensure that the All namespaces on the cluster (default) option is selected for Installation Mode to install the operator in all namespaces.
- Ensure that the openshift-keda namespace is selected for Installed Namespace. OpenShift Container Platform creates the namespace if not present in your cluster.
- Click Install.
- Verify the installation by listing the custom metrics autoscaler operator components:
- Navigate to Workloads -> Pods.
- Select the openshift-keda project from the drop down menu and verify that the custom-metrics-autoscaler-operator-* pod is running.
- Navigate to Workloads -> Deployments to verify that the custom-metrics-autoscaler-operator deployment is running.
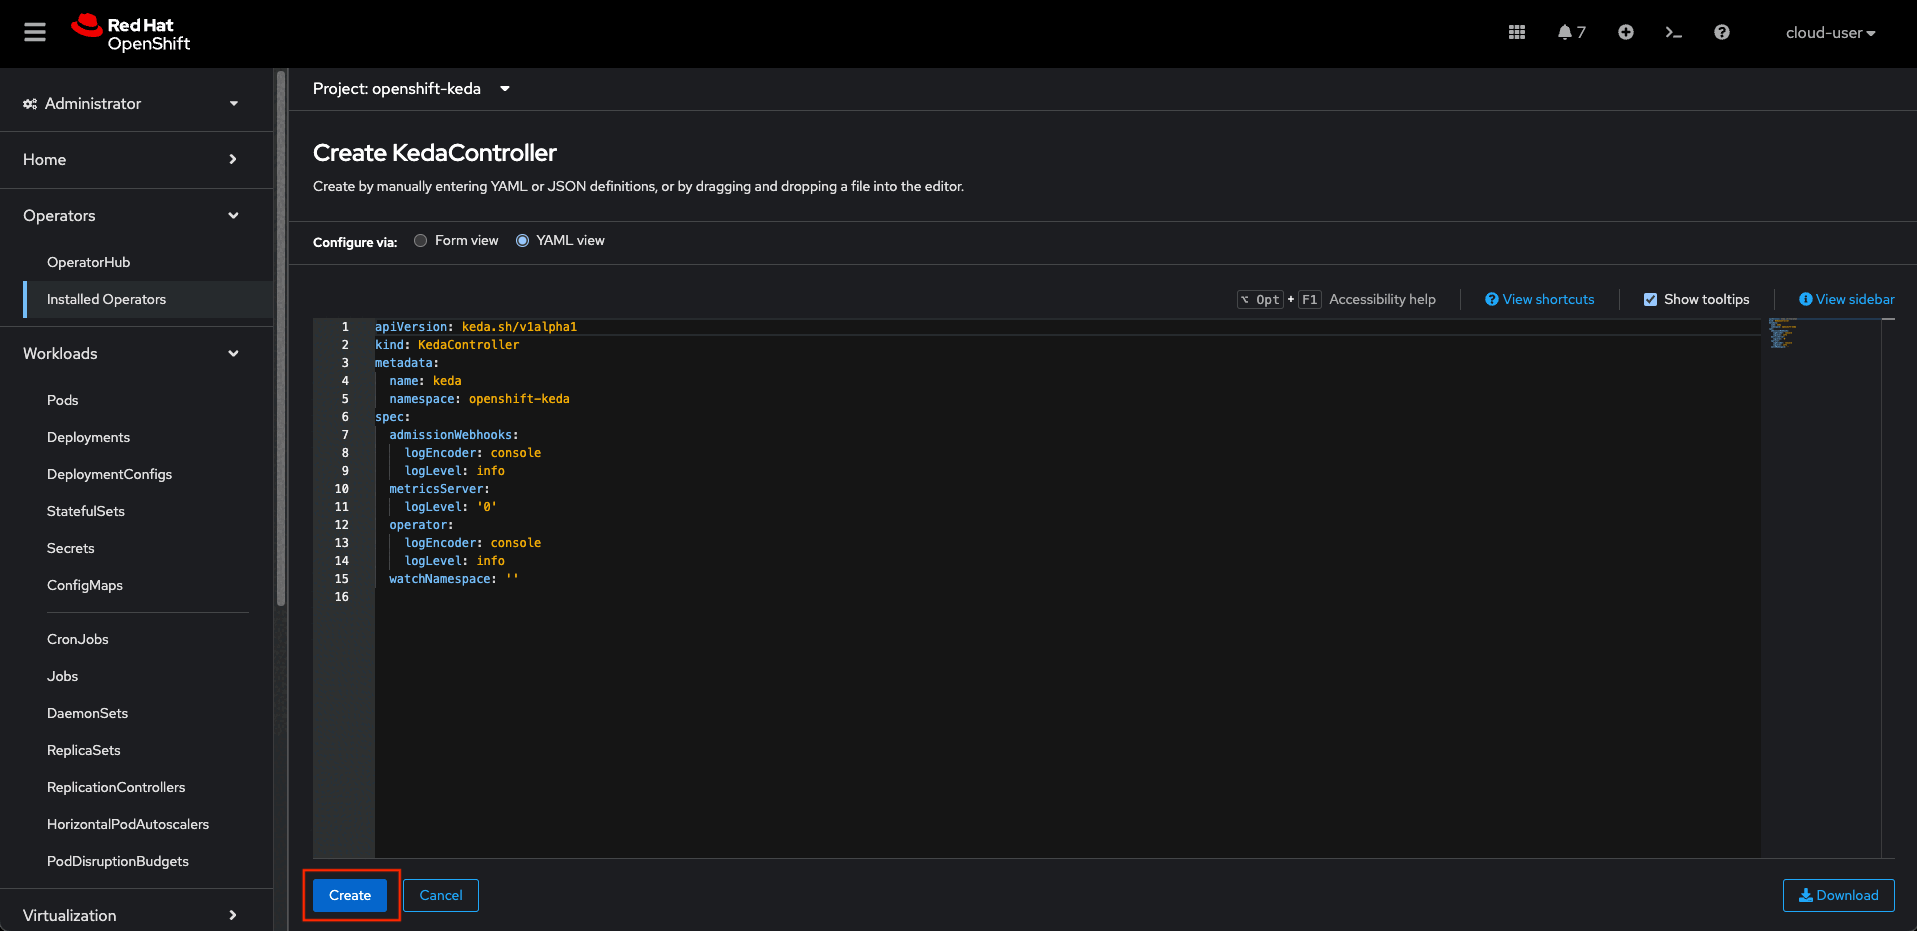
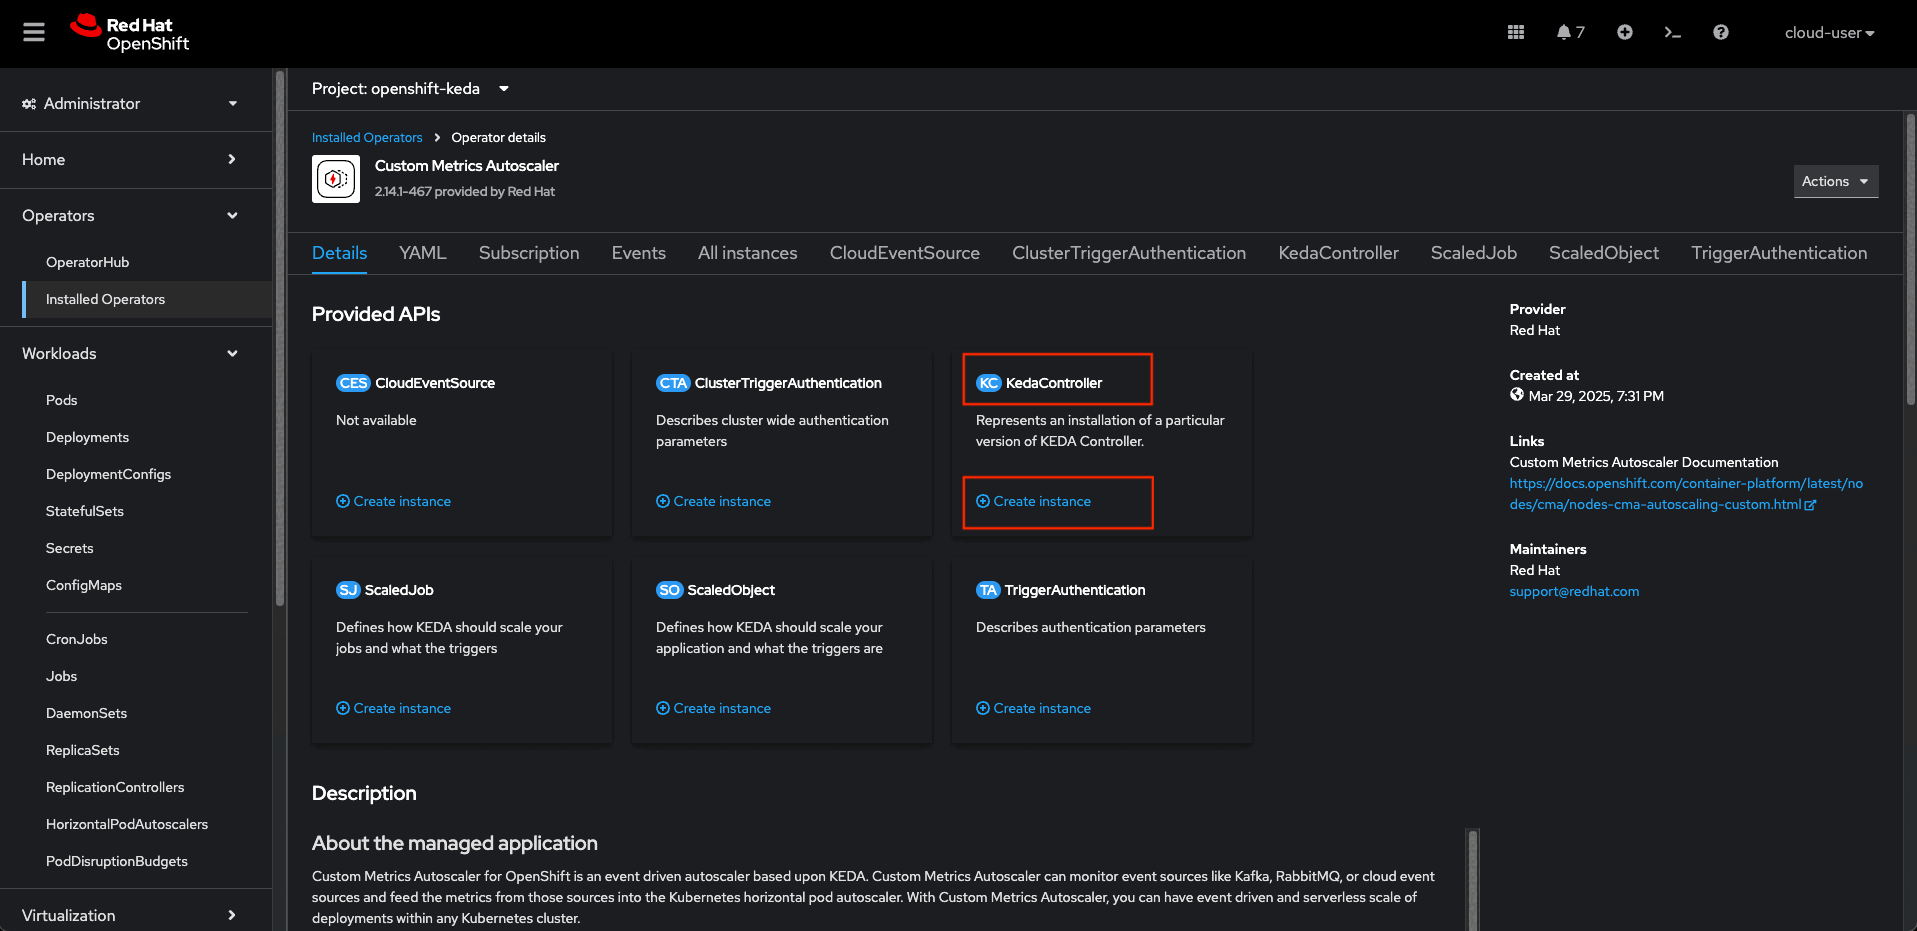
Create a KedaController instance
Next, create the KedaController instance:
- In the OpenShift Container Platform web console, click Operators -> Installed Operators.
- Click Custom Metrics Autoscaler.
- On the Operator Details page, click the KedaController tab.
- On the KedaController tab, click Create KedaController and edit the file. The default values should be good enough, however you can make changes to the values like log level, which namespace to monitor (if any) etc. as desired.
- Click Create to create the KEDA controller.
- Select the openshift-keda project from the drop-down menu and verify that the keda-admission, keda-metrics-apiserver, and keda-operator deployment as well as the corresponding pods are running.
Here is a sample KEDA Controller YAML:
apiVersion: keda.sh/v1alpha1
kind: KedaController
  name: keda
  namespace: openshift-keda
spec:
  admissionWebhooks:
    logEncoder: console
    logLevel: info
  metricsServer:
    logLevel: '0'
  operator:
    logEncoder: console
    logLevel: info
  watchNamespace: ''
Figures 3 through 6 depict the OpenShift Container Platform UI where the previous steps to install CMA and set up the controller take place.
Set up the secret
To access Prometheus metrics, we will use bearer authentication by generating a one-year token for the prometheus-k8 service account in the OpenShift monitoring namespace for simplicity. Additionally, we extract the SSL certificate from the same namespace to securely connect to the Prometheus metrics endpoint.
Run the following command:
oc create secret generic <<secret-name>> --from-literal=ca.crt="$(oc get secret
prometheus-k8s-tls -n openshift-monitoring -o jsonpath="{.data['tls\.crt']}" | base64
-d)" --from-literal=token="$(oc create token prometheus-k8s -n openshift-monitoring
--duration=8760h)" -n <<to be scaled object namespace>>
Replace the secret-name and the scaled object namespace with the appropriate values.
Create TriggerAuthentications
Next, create the TriggerAuthentications:
- Create a YAML file
trigger-auth.yamlsimilar to the following:
apiVersion: keda.sh/v1alpha1
kind: TriggerAuthentication
metadata:
  name: trigger-auth-prometheus
  namespace: openshift-keda
spec:
  secretTargetRef:
  - parameter: bearerToken
    name: <<secret-name created in the above step>>
    key: token
  - parameter: ca
    name: <<secret-name created in the above step>>
    key: ca.crt
2. Create the CR object: oc create -f trigger-auth.yaml.
Create the ScaledObject
Now, create the ScaledObject:
- Create a YAML file
scaled-object.yamlsimilar to the following:
apiVersion: keda.sh/v1alpha1
kind: ScaledObject
metadata:
    annotations:
      scaledobject.keda.sh/transfer-hpa-ownership: 'true'
    name: cm-autoscaler
    namespace: <<scaled object namespace>>
    labels:
      scaledobject.keda.sh/name: cm-autoscaler
spec:
 maxReplicaCount: 2
 minReplicaCount: 1
 pollingInterval: 10
 scaleTargetRef:
   apiVersion: apps/v1
   kind: <<scaled object type, eg. Deployment, Pod etc.>>
   name: <<scaled object Name>>
 triggers:
  - authenticationRef:
      name: trigger-auth-prometheus
    metadata:
      authModes: bearer
      metricName: DCGM_FI_DEV_GPU_UTIL
      query: 'SUM(DCGM_FI_DEV_GPU_UTIL{instance=~".+", gpu=~".+"})'
      serverAddress: 'https://prometheus-k8s.openshift-monitoring.svc.cluster.local:9091'
      threshold: '90'
    name: DCGM_FI_DEV_GPU_UTIL
type: prometheus- Create the CR object:
oc create -f scaled-object.yaml. This should be created in the scaled object namespace. - View the command output to verify that the custom metrics autoscaler was created:
oc get scaledobject cm-autoscaler.
In the above ScaledObject YAML, we use DCGM_FI_DEV_GPU_UTIL to get the total CPU utilization for the GPUs. However, you can update the query according to the requirement and/or use other metrics identifiers as applicable. For the list of Identifiers refer to the Field Identifiers docs.
Sample output:
NAME            SCALETARGETKIND      SCALETARGETNAME        MIN   MAX   TRIGGERS     AUTHENTICATION               READY   ACTIVE   FALLBACK   AGE
scaledobject    apps/v1.Deployment   example-deployment     0     50    prometheus   prom-triggerauthentication   True    True     False       17s
Make sure the READY and ACTIVE are set to True indicating everything is working correctly.
Test the AutoScaler
For this we will use CUDA Test Generator (dcgmproftester). The dcgmproftester is a CUDA load generator. It can be used to generate deterministic CUDA workloads for reading and validating GPU metrics. Customers can use the tool to quickly generate a load on the GPU.
Follow these steps to test the AutoScaler:
- Navigate to the nvidia-gpu-operator namespace.
- Navigate to a pod named nvidia-dcgm-****.
- Go the terminal tab in the Pod.
- Run the following command:
/usr/bin/dcgmproftester12 --no-dcgm-validation -t 1004 -d 90where-tis for generating load for a particular metric and-dfor specifying the test duration. Add--no-dcgm-validationto let dcgmproftester generate test loads only. - Watch the object get scaled.
The following video demonstrates the scaling of the object.
For more information, refer to these resources: