This article covers Red Hat Device Edge observability with the OpenTelemetry collector.
Why is observability a critical feature for edge?
With edge deployments, you are probably planning to scale out your environment to thousands or perhaps millions of devices spread across different locations with different accessibility. Simply knowing your device is "down" is not enough information to troubleshoot, analyze performance, and understand the security of your devices. Edge environments are often complex—they can come with resource constraints, unreliable networks, and heterogeneous configurations.
Understanding CPU utilization, memory and storage, monitoring for device failures, understanding communication breakdowns, and correlating information together for better understanding of your environment is what we bring into Red Hat Device Edge Management with OpenTelemetry integration. You can read more about edge observability use cases in this blog post: Top 5 edge computing challenges solved by Red Hat OpenShift observability
The OpenTelemetry collector enables the device to collect, process, and send all telemetry data with a single collector fulfilling all observability needs of the device. In this article, we will create and deploy a bootable container (bootc) with the collector and configure it to send metrics and logs via the OpenTelemetry protocol (OTLP) to another collector running on the Red Hat OpenShift cluster.
The full source code of the solution can be found on GitHub. This article will describe the most important parts of the solution.
Red Hat Device Edge bootc image
The first step is to create a bootable container image with the collector. The collector will be installed from the official opentelemetry-collector RPM and, as a base image, use CentOS with installed flight control agent. The container file also defines opentelemetry-collector.service systemd service, which gets the device ID from the flight control agent and puts it into the collector configuration file as a host.id resource attribute. If you are not running Red Hat Edge Manager, the collector service file can be removed and the build will use the one that comes from the collector RPM:
FROM quay.io/flightctl-demos/centos-bootc:latest
ADD etc etc
RUN dnf install -y opentelemetry-collector
ADD opentelemetry-collector.service /usr/lib/systemd/system/
RUN systemctl enable opentelemetry-collector.service
## ----------------- IMPORTANT -----------------
## We need to add certs (ca.crt, client.crt & client.key) to the local directory etc/opentelemetry-collector/certs
## Also we need to add the FlightCTL config.yaml to the local directory etc/flighctl/config.yaml
## ---------------------------------------------
RUN chown -R observability:observability /etc/opentelemetry-collector
RUN rm -rf /opt && ln -s /var /opt
RUN [ ! -L /var/run ] && [ -d /var/run ] && rm -rf /var/run && ln -s /run /var/ || ln -s /run /var/run
Let’s look at the collector configuration:
receivers:
  hostmetrics:
    collection_interval: 10s
    scrapers:
      cpu:
      load:
      memory:
      network:
      paging:
      processes:
      process:
        mute_process_name_error: true
        mute_process_exe_error: true
        mute_process_io_error: true
        mute_process_user_error: true
        mute_process_cgroup_error: true
        metrics:
          process.cpu.utilization:
            enabled: true
          process.memory.utilization:
            enabled: true
  hostmetrics/disk:
    collection_interval: 1m
    scrapers:
      disk:
      filesystem:
  journald:
    units:
      - flightctl-agent.service
    priority: info
exporters:
  otlphttp:
    endpoint: https://otlp-http-otel-route-flightctl-observability.<your cluster>
    tls:
      insecure: false
      ca_file: /etc/opentelemetry-collector/certs/ca.crt
      cert_file: /etc/opentelemetry-collector/certs/client.crt
      key_file: /etc/opentelemetry-collector/certs/client.key
  debug:
    verbosity: detailed
processors:
  batch: {}
  resource:
    attributes:
    - action: insert
      key: host.id
      value: demo-device1
  memory_limiter:
    check_interval: 10s
    limit_percentage: 5
    spike_limit_percentage: 1
service:
  pipelines:
    metrics:
      receivers: [hostmetrics,hostmetrics/disk]
      processors: [memory_limiter, resource, batch]
      exporters: [debug, otlphttp]
    logs:
      receivers: [journald]
      processors: [memory_limiter, resource, batch]
      exporters: [debug, otlphttp]
This configuration collects host metrics and systemd info logs for the flightctl-agent.service service. The configuration also enables the batching before the data is sent and enables memory limiter to avoid overloading the collector’s pipeline. The memory limiter is configured to use 5% of the host available memory and allow spikes of 1%.
The collector exports data via the OTLP/HTTP with mTLS to another collector and prints all telemetry data to stdout via the debug exporter. Do not forget to update the exporter endpoint with the collector endpoint from the next section.
Before building the image, remember to provide the TLS certificates as they are mentioned in the Containerfile. The instructions for generating certificates are in the readme. If you are running Red Hat Edge Manager, also add the FlightCTL configuration file.
Start the image
With the following commands we will build the bootc image, create the qcow2 disk image, and deploy it with libvirt.
Before we start, we need to create a config.json that defines the user for the virtual machine disk image:
{
  "blueprint": {
    "customizations": {
      "user": [
        {
          "name": "user",
          "password": "password",
          "groups": [
            "wheel"
          ]
        }
      ]
    }
  }
}
Here are the commands needed to build and deploy this image:
# Build bootc image
$ sudo podman build -t quay.io/user/otel-collector-centos:latest -f demos/otel-collector/bootc/Containerfile demos/otel-collector/bootc/
# Create qcow2 disk image for QEMU
$ mkdir -p output sudo podman run --rm -it --privileged --pull=newer \
        --security-opt label=type:unconfined_t \
        -v $(PWD)/config.json:/config.json \
        -v $(PWD)/output:/output \
        -v /var/lib/containers/storage:/var/lib/containers/storage \
        quay.io/centos-bootc/bootc-image-builder:latest \
       --config /config.json \
       quay.io/user/otel-collector-centos:latest
# Create a virtual machine
$ sudo virt-install  --name flightctl  --memory 3000  --vcpus 2  --disk output/qcow2/disk.qcow2  --import  --os-variant centos-stream9
# Start virt manager
$ virt-manager
Once the machine starts, we can log in with user@password. You can use the systemctl status opentelemetry-collector.service to check the status of the collector and journalctl -u opentelemetry-collector.serviceto get the logs.
Deploy back-end collector on OpenShift
In this section we are going to deploy an OpenTelemetry collector via the Red Hat build of OpenTelemetry operator. The following OpenTelemetry Collector custom resource (CR) configures the collector with OTLP/HTTP receiver and exposes it outside the cluster with an OpenShift route with passthrough TLS. Therefore, the receiver is configured with TLS certificates created from the previous section:
apiVersion: opentelemetry.io/v1beta1
kind: OpenTelemetryCollector
metadata:
  name: otel
  namespace: flightctl-observability
spec:
  mode: deployment
  replicas: 1
  ingress:
    type: route
    route:
      termination: passthrough
  volumes:
    - name: receiver-ca
      configMap:
        name: otelcol-receiver-ca
    - name: receiver-certs
      secret:
        secretName: otelcol-receiver-certs
  volumeMounts:
    - name: receiver-ca
      mountPath: /etc/opentelemetry-collector-rhde/ca
    - name: receiver-certs
      mountPath: /etc/opentelemetry-collector-rhde/certs
  config:
    exporters:
      debug:
        verbosity: normal
    processors:
    receivers:
      otlp:
        protocols:
          http:
            endpoint: 0.0.0.0:4318
            tls:
              client_ca_file: /etc/opentelemetry-collector-rhde/ca/ca.crt
              cert_file: /etc/opentelemetry-collector-rhde/certs/tls.crt
              key_file: /etc/opentelemetry-collector-rhde/certs/tls.key
    service:
      pipelines:
        logs:
          receivers:
            - otlp
          exporters:
            - debug
        metrics:
          receivers:
            - otlp
          exporters:
            - debug
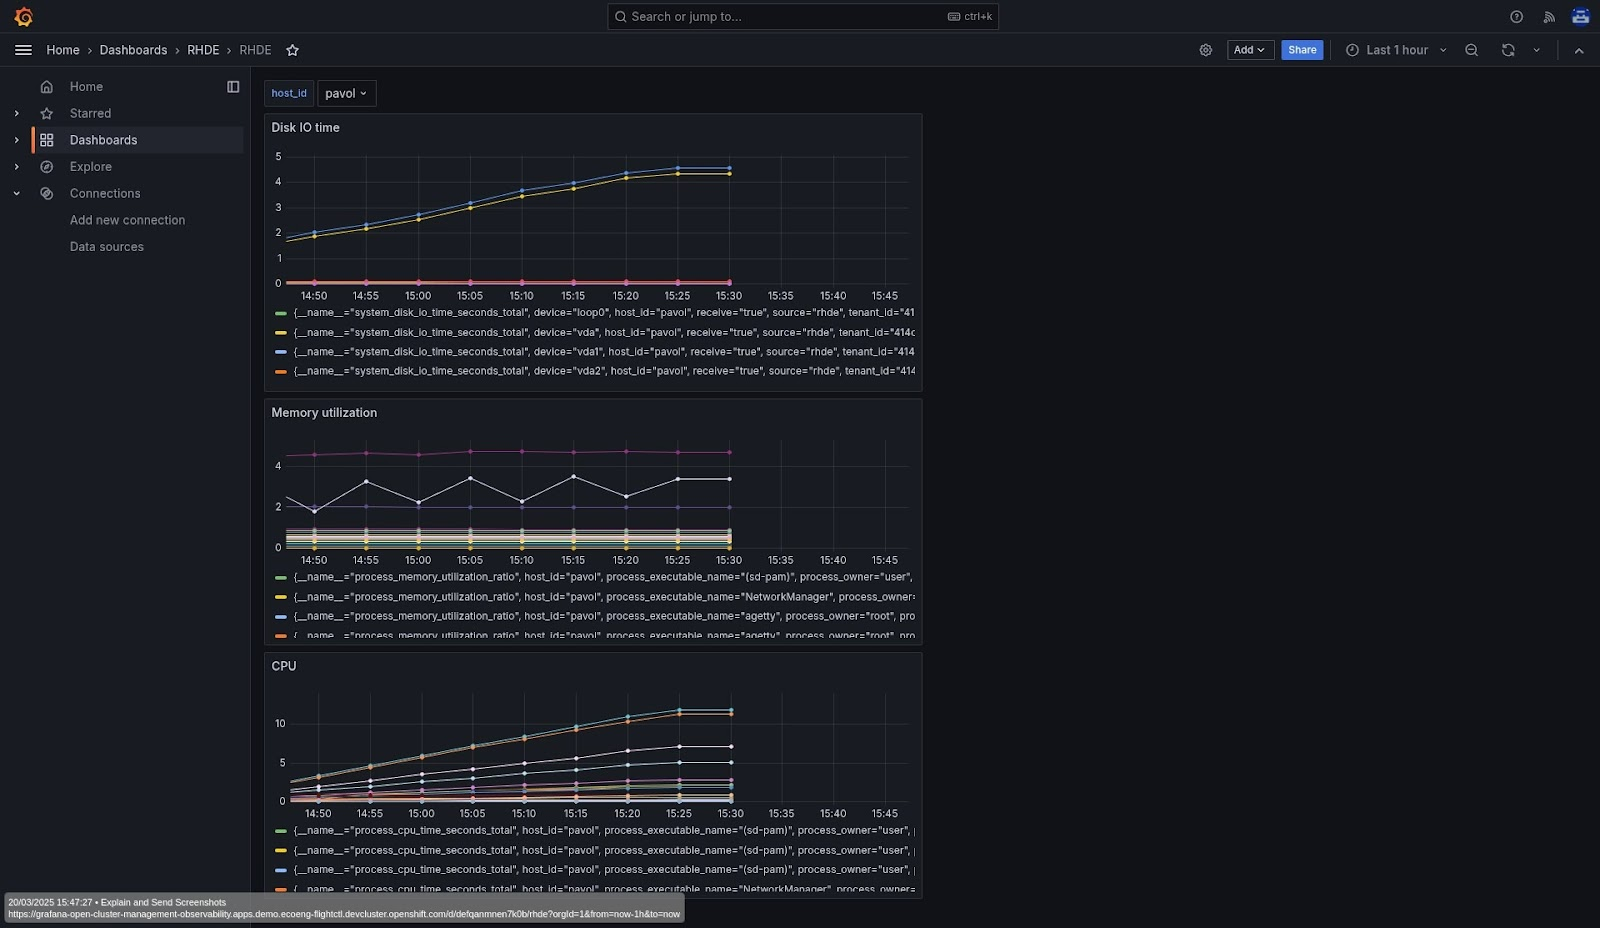
The demo repository contains more OpenShift manifests to, for instance, deploy a Cluster Observability Operator that can provision MonitoringStack with Prometheus or deploy Red Hat Advanced Cluster Management observability. There are also configuration files for a Grafana dashboard as shown in Figure 1.

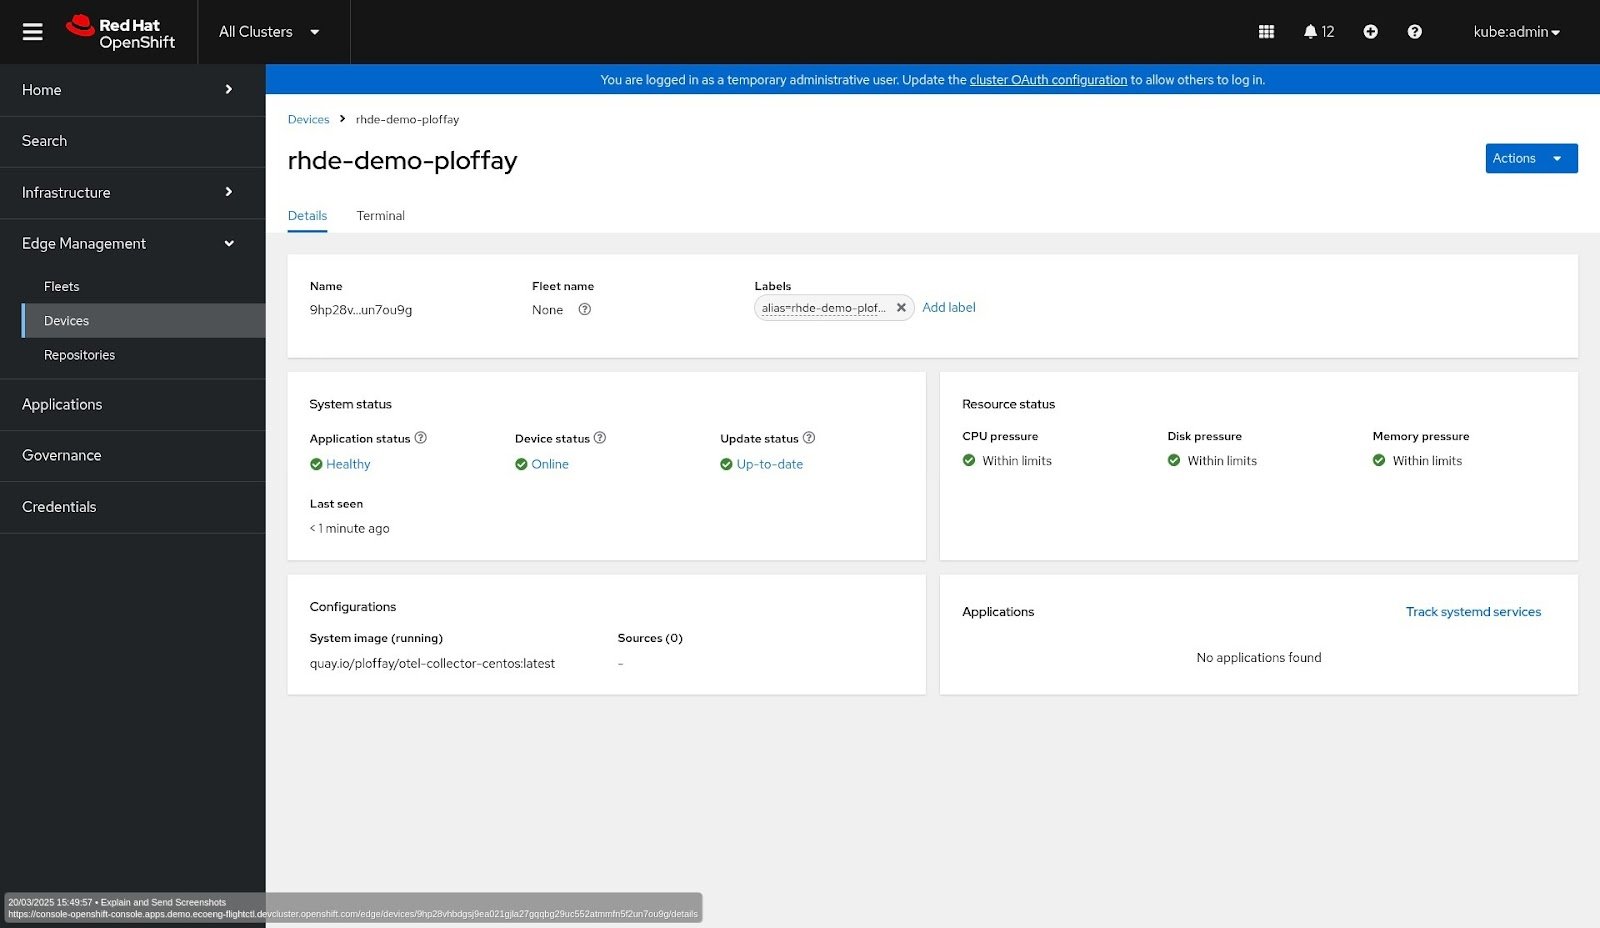
If you are running Advanced Cluster Management for Kubernetes and have configured the flight control, the device will show up in the console (Figure 2).

Conclusion
This guide walked through the process of setting up observability for Red Hat Device Edge using OpenTelemetry. By creating a bootable container with the collector, configuring it for data export, and deploying a back-end collector on OpenShift, you gain robust insights into your edge deployments. This setup empowers you to proactively monitor device health, analyze performance metrics, and troubleshoot issues efficiently. Leveraging OpenTelemetry and Red Hat Device Edge ensures that even in complex, distributed edge environments, you maintain critical visibility and control.
