Network Observability 1.7 aligns with Red Hat OpenShift Container Platform 4.17, although it is compatible all the way back to 4.12. Network Observability is an optional operator that provides insights into your network traffic and can help you troubleshoot networking issues. There is an upstream version that runs on bare Kubernetes, but this article focuses on the downstream version on OpenShift Container Platform where you get the most benefit.
It was only a few months ago when 1.6 was released, and you can read all about it in my last post. There are a number of features added in this release. The most notable ones are:
- Export data using OpenTelemetry Protocol (OTLP)
- Enhance secondary interface support
- eBPF Agent enhancements
- Network Observability in Developer Perspective
- Security features
- Network Observability CLI General Availability (GA)
Export data using OpenTelemetry Protocol (OTLP)
OpenTelemetry is a popular open source framework for managing telemetry data. Network Observability can now export flow logs and flow metrics using the OpenTelemetry Protocol (OTLP).
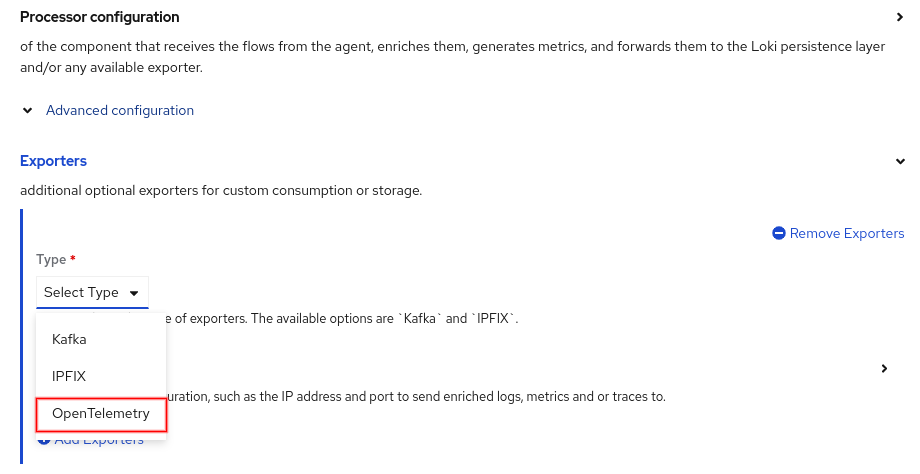
To do this, after you install the Network Observability operator, go to Operators > Installed Operators. On the Network Observability row, click the Flow Collector link under the Provided APIs column. Click Create FlowCollector. Make sure you are in Form view. At the bottom, click Advanced configuration to reveal the Exporters section (Figure 1).
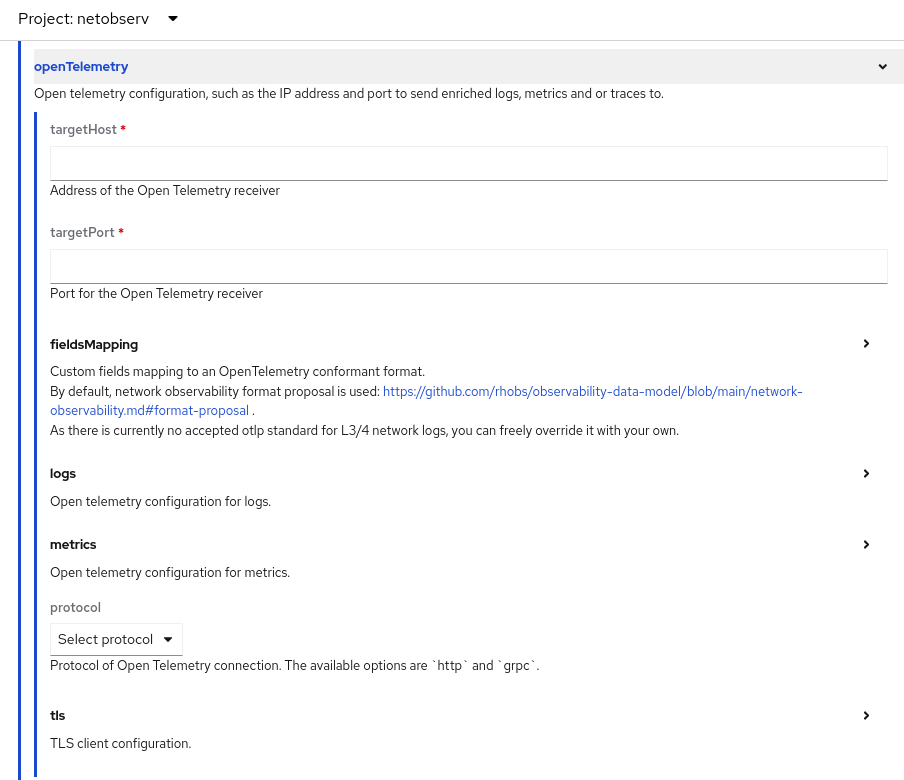
By default, the field names follow the OpenTelemetry Semantic Conventions. The Network flows format reference shows the field mapping in the new OpenTelemetry column. In case you prefer a different name, any of the fields can be renamed to your liking under the fieldMapping section (Figure 2).
Enhanced secondary interface support
There are several use cases for wanting a secondary interface on a pod.
- Partition a NIC in SR-IOV and use the Multus and SR-IOV CNI plugins to attach an SR-IOV virtual function to your pod. Network Observability supported this in 1.4.
- Create a User Defined Network (UDN). UDN provides isolation and segmentation to your traffic, and is a Technology Preview in OpenShift Container Platform 4.17. The pods have a secondary interface to connect to UDN.
- Create a secondary overlay network in OpenShift Virtualization to allow east-west traffic between virtual machines (VMs). The VMs have a secondary interface to connect to the overlay network.
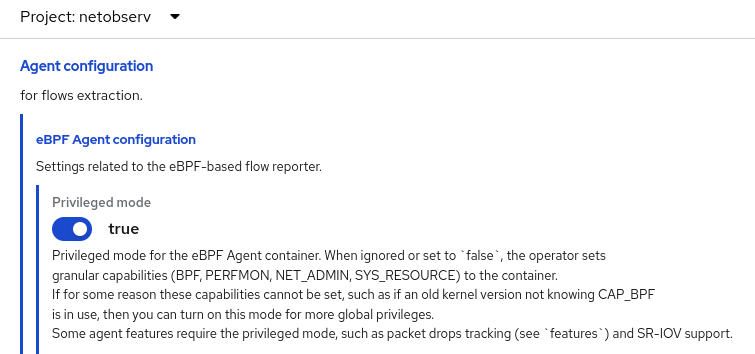
Network Observability 1.7 supports all three scenarios when privileged mode is set to true in the FlowCollector resource. Click > to the right of the text to open up Agent configuration and eBPF Agent configuration (Figure 3).
Network Observability handles the rest by tracking the secondary interfaces that come and go, and identifying which namespace and pod they belong to. In Observe > Network Traffic, Traffic flows table, click Show advanced options on the right side, then Manage columns, and add the column Interfaces and Directions (Figure 4). If the flows for these interfaces show n/a for the Name and Namespace, follow these steps to provide FlowCollector with more information to be able to provide this data.

eBPF Agent enhancements
These are the other smaller but useful enhancements made to the eBPF Agent, which is the component that collects and aggregates flows in Network Observability.
- The eBPF flow filter allows simple filtering at the core level where it decides what flows to collect. Here are the changes:
ports,sourcePortsordestPorts: Supports up to two TCP, UDP or SCTP ports. Previously, it allowed only one port.- If
portsis specified but notprotocol, it filters on TCP and UDP flows. tcpFlags: Filter the flows with this TCP flag. It must be one of "SYN", "SYN-ACK", "ACK", "FIN", "RST", "URG", "ECE", "CWR", "FIN-ACK", or "RST-ACK".
- The Kubernetes service for DNS does a reverse proxy and maps to an internal port at the pod running DNS. For the DNS Tracking feature to work end-to-end, specify the internal port value using the environment variable
DNS_TRACKING_PORT.
Listing 1 shows an example use-case scenario that only collects DNS traffic on ports 53 and 5353. OVN, which is the default CNI for OpenShift Container Platform, maps the internal DNS_TRACKING_PORT to 5353. If the DNS Tracking feature is enabled, it displays data for DNS latency, response code, and error on a per-flow basis in the Traffic flows table.
  agent:
    ebpf:
      flowFilter:
        enable: true
        ports: 53,5353  # only have flows for these two ports
      advanced:
        env:
          DNS_TRACKING_PORT: "5353"  # must be a string
      sampling: 1
      features:
        - DNSTracking
Listing 1: eBPF flow filter for DNS traffic
Assuming you have the OpenShift CLI (oc) installed on your computer, enter oc edit flowcollector. Look for the ebpf section and add the lines in Listing 1.
Listing 2 shows an example where the eBPF Agent collects only TCP flows that have the SYN flag, which are flows that initiate a TCP connection. By not specifying protocol, it will also collect UDP.
Here is the eBPF flow filter for TCP SYN and UDP traffic:
  agent:
    ebpf:
      flowFilter:
        enable: true
        tcpFlags: SYN
      sampling: 1
In the Traffic flows table, you can add the TCP flags column. You can also filter on this column (Figure 5).

Network Observability in Developer Perspective
For the first time, Network Observability is providing observability in the Developer Perspective!
- If you are in Administrator perspective, click Administrator in the upper left corner and select Developer.
- Click Project and select a project in the drop down near the top of the page.
- In the Inventory section, click Pods or Service.
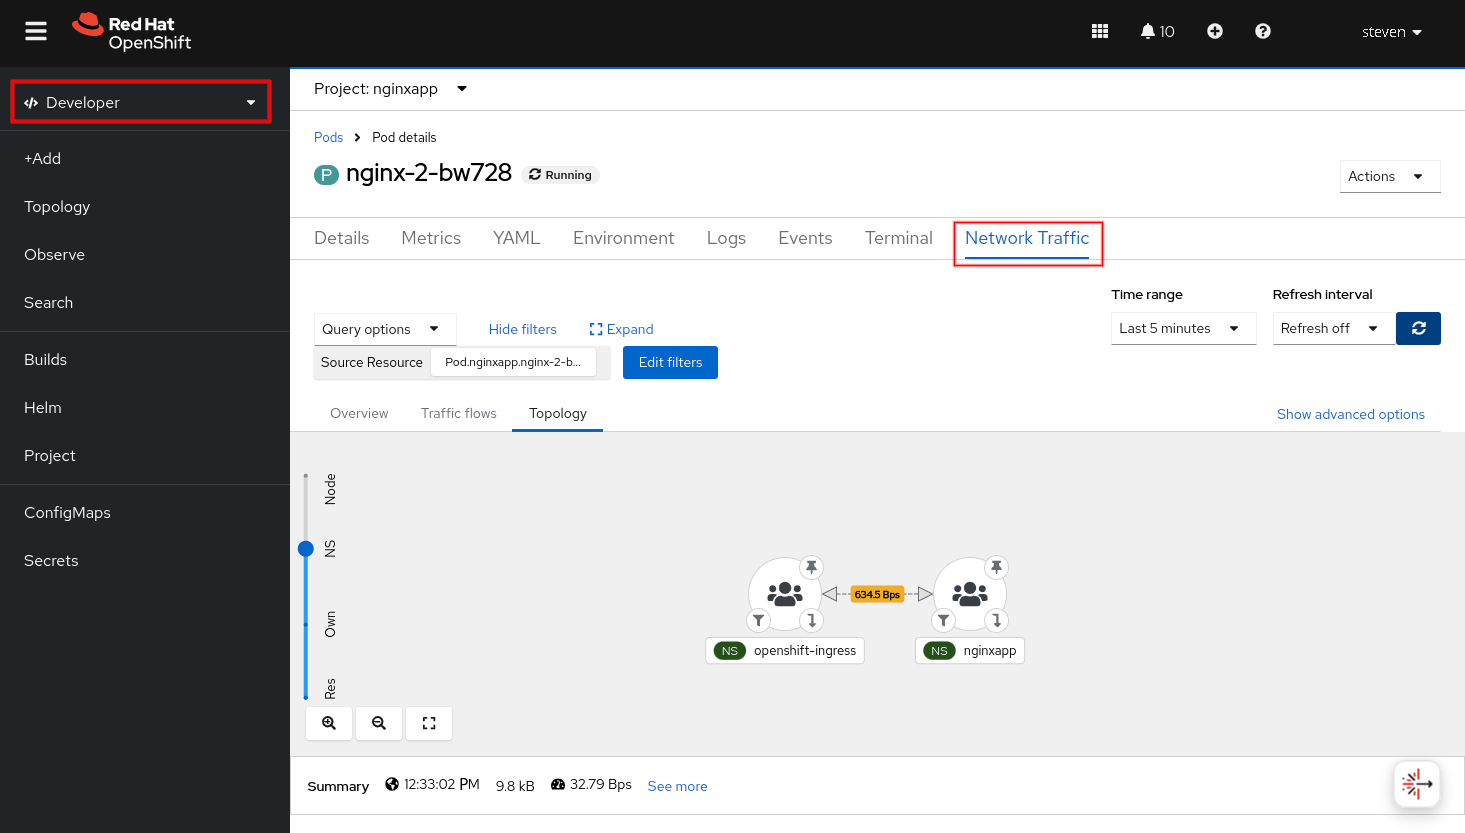
- Click a particular item on a row. There is a Network Traffic tab. Click this link to bring up the familiar page with Overview, Traffic flows, and Topology tabs filtered to this pod or service (Figure 6).
To provide access to a specific user, group, or non-cluster admin, follow these steps to add authorization to various roles.
Security features
There are two security-related features in this release: FIPS compliance and lock-down access.
FIPS compliance
Network Observability 1.7 is compliant with FIPS 140-3, ensuring that it meets security requirements for cryptographic modules. This means it can be used when OpenShift is in FIPS mode.
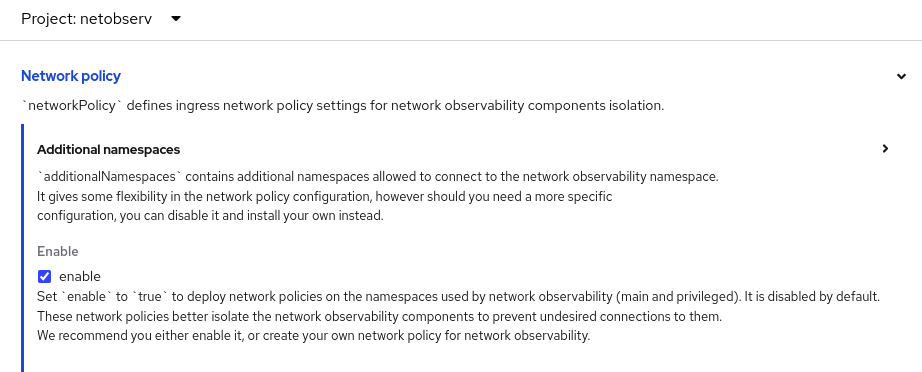
Lock down access to Network Observability
For added security, it is simple to lock down access to Network Observability so only known components can access it. In the FlowCollector resource, enable this feature (Figure 7). This creates a Kubernetes network policy in the netobserv and netobserv_privileged namespaces to restrict its access. Although this is disabled by default, it is recommended to enable this or create your own network policies.
Network Observability CLI General Availability (GA)
The Network Observability CLI (oc netobserv) is a kubectl plug-in that installs a separate, lightweight Network Observability from the command line and displays a text-based flows table. The CLI can also capture packets to a pcap file. It uses no storage on the cluster! When you exit the program, it cleans up and removes itself.
You don't need to install the Network Observability Operator because Network Observability CLI handles the necessary components for you. Just follow the instructions here to install Network Observability CLI. The prerequisite is to have the oc CLI installed on your computer and to be logged in with the cluster-admin role.
Make sure you have the 1.7 version, which is the General Availability (GA) version by entering oc netobserv version. Here is the command and output from the command line:
$ oc netobserv version
Netobserv CLI version 1.7.0
There were a number of significant changes in Network Observability CLI from the last Network Observability release. To start, the command line options changed so that when doing packet capture, you now have many of the same options as flow capture, particularly for the eBPF flow filters. To see these options, enter oc netobserv help. You might need to widen the terminal to view this legibly.
Regardless whether you do flow capture or packet capture, it displays the flows table. The screen is pretty self-explanatory on what you can do such as filtering data, showing more columns of data, and increasing or decreasing the number of rows. To exit, press ctrl-c. There is a prompt to save the capture output. If you respond with y, it saves the data with a timestamp filename in the directory ./output/flow/ for flows and ./output/pcap/ for packets. Figure 8 shows a screenshot of Network Observability CLI after running.
oc netobserv flows
For packet capture, it's advisable to set a filter as the amount of data will grow very quickly. By default, there is a maximum byte size of 50 MB and a maximum time limit of 5 minutes before it exits, whichever comes first, although they can be changed with the --max-bytes and --max-time options respectively.
What's unique about the packet capture is that it stores enriched Kubernetes data in the pcap file! Here are the commands and output from the command line and a screenshot of Wireshark loaded from a pcapng file created by Network Observability CLI (Figure 9). You need to have Wireshark installed.
$ oc netobserv packets --protocol=TCP --port=8443
<Press ctrl-c to exit>

# Update command with your filename.
$ wireshark output/pcap/2024-10-23T045400Z.pcapng
The Frame 6 row is selected and highlighted in blue. In the Packet Details section below, click > on the first line to open up the "Frame 6" content. Then click > on "Interface id" to open up the interface details. You can then see that source IP address 10.129.0.23 in the selected row corresponds to a pod named prometheus-k8s-0 in the namespace openshift-monitoring.
Conclusion
There are a lot of features packed into this release. We encourage you to spend time experimenting with these features and let us know how it helps you perform your tasks. If you have any comments or suggestions, you can contact us on the discussion board.
Special thanks to Julien Pinsonneau, Mohamed Mahmoud, and Sara Thomas for reviewing this article.