Redhat Developers  Logo
  • AI

    Get started with AI

    • Red Hat AI
      Accelerate the development and deployment of enterprise AI solutions.
    • AI learning hub
      Explore learning materials and tools, organized by task.
    • AI interactive demos
      Click through scenarios with Red Hat AI, including training LLMs and more.
    • AI/ML learning paths
      Expand your OpenShift AI knowledge using these learning resources.
    • AI quickstarts
      Focused AI use cases designed for fast deployment on Red Hat AI platforms.
    • No-cost AI training
      Foundational Red Hat AI training.

    Featured resources

    • OpenShift AI learning
    • Open source AI for developers
    • AI product application development
    • Open source-powered AI/ML for hybrid cloud
    • AI and Node.js cheat sheet

    Red Hat AI Factory with NVIDIA

    • Red Hat AI Factory with NVIDIA is a co-engineered, enterprise-grade AI solution for building, deploying, and managing AI at scale across hybrid cloud environments.
    • Explore the solution
  • Learn

    Self-guided

    • Documentation
      Find answers, get step-by-step guidance, and learn how to use Red Hat products.
    • Learning paths
      Explore curated walkthroughs for common development tasks.
    • Guided learning
      Receive custom learning paths powered by our AI assistant.
    • See all learning

    Hands-on

    • Developer Sandbox
      Spin up Red Hat's products and technologies without setup or configuration.
    • Interactive labs
      Learn by doing in these hands-on, browser-based experiences.
    • Interactive demos
      Click through product features in these guided tours.

    Browse by topic

    • AI/ML
    • Automation
    • Java
    • Kubernetes
    • Linux
    • See all topics

    Training & certifications

    • Courses and exams
    • Certifications
    • Skills assessments
    • Red Hat Academy
    • Learning subscription
    • Explore training
  • Build

    Get started

    • Red Hat build of Podman Desktop
      A downloadable, local development hub to experiment with our products and builds.
    • Developer Sandbox
      Spin up Red Hat's products and technologies without setup or configuration.

    Download products

    • Access product downloads to start building and testing right away.
    • Red Hat Enterprise Linux
    • Red Hat AI
    • Red Hat OpenShift
    • Red Hat Ansible Automation Platform
    • See all products

    Featured

    • Red Hat build of OpenJDK
    • Red Hat JBoss Enterprise Application Platform
    • Red Hat OpenShift Dev Spaces
    • Red Hat Developer Toolset

    References

    • E-books
    • Documentation
    • Cheat sheets
    • Architecture center
  • Community

    Get involved

    • Events
    • Live AI events
    • Red Hat Summit
    • Red Hat Accelerators
    • Community discussions

    Follow along

    • Articles & blogs
    • Developer newsletter
    • Videos
    • Github

    Get help

    • Customer service
    • Customer support
    • Regional contacts
    • Find a partner

    Join the Red Hat Developer program

    • Download Red Hat products and project builds, access support documentation, learning content, and more.
    • Explore the benefits

Enhancements to the Traces UI in the OpenShift web console: Technology preview release

September 19, 2024
Vanessa Martini Jose Gomez-Selles
Related topics:
Hybrid cloudKubernetesMicroservicesObservabilityOpen sourceOperators
Related products:
Red Hat OpenShiftRed Hat OpenShift Container Platform

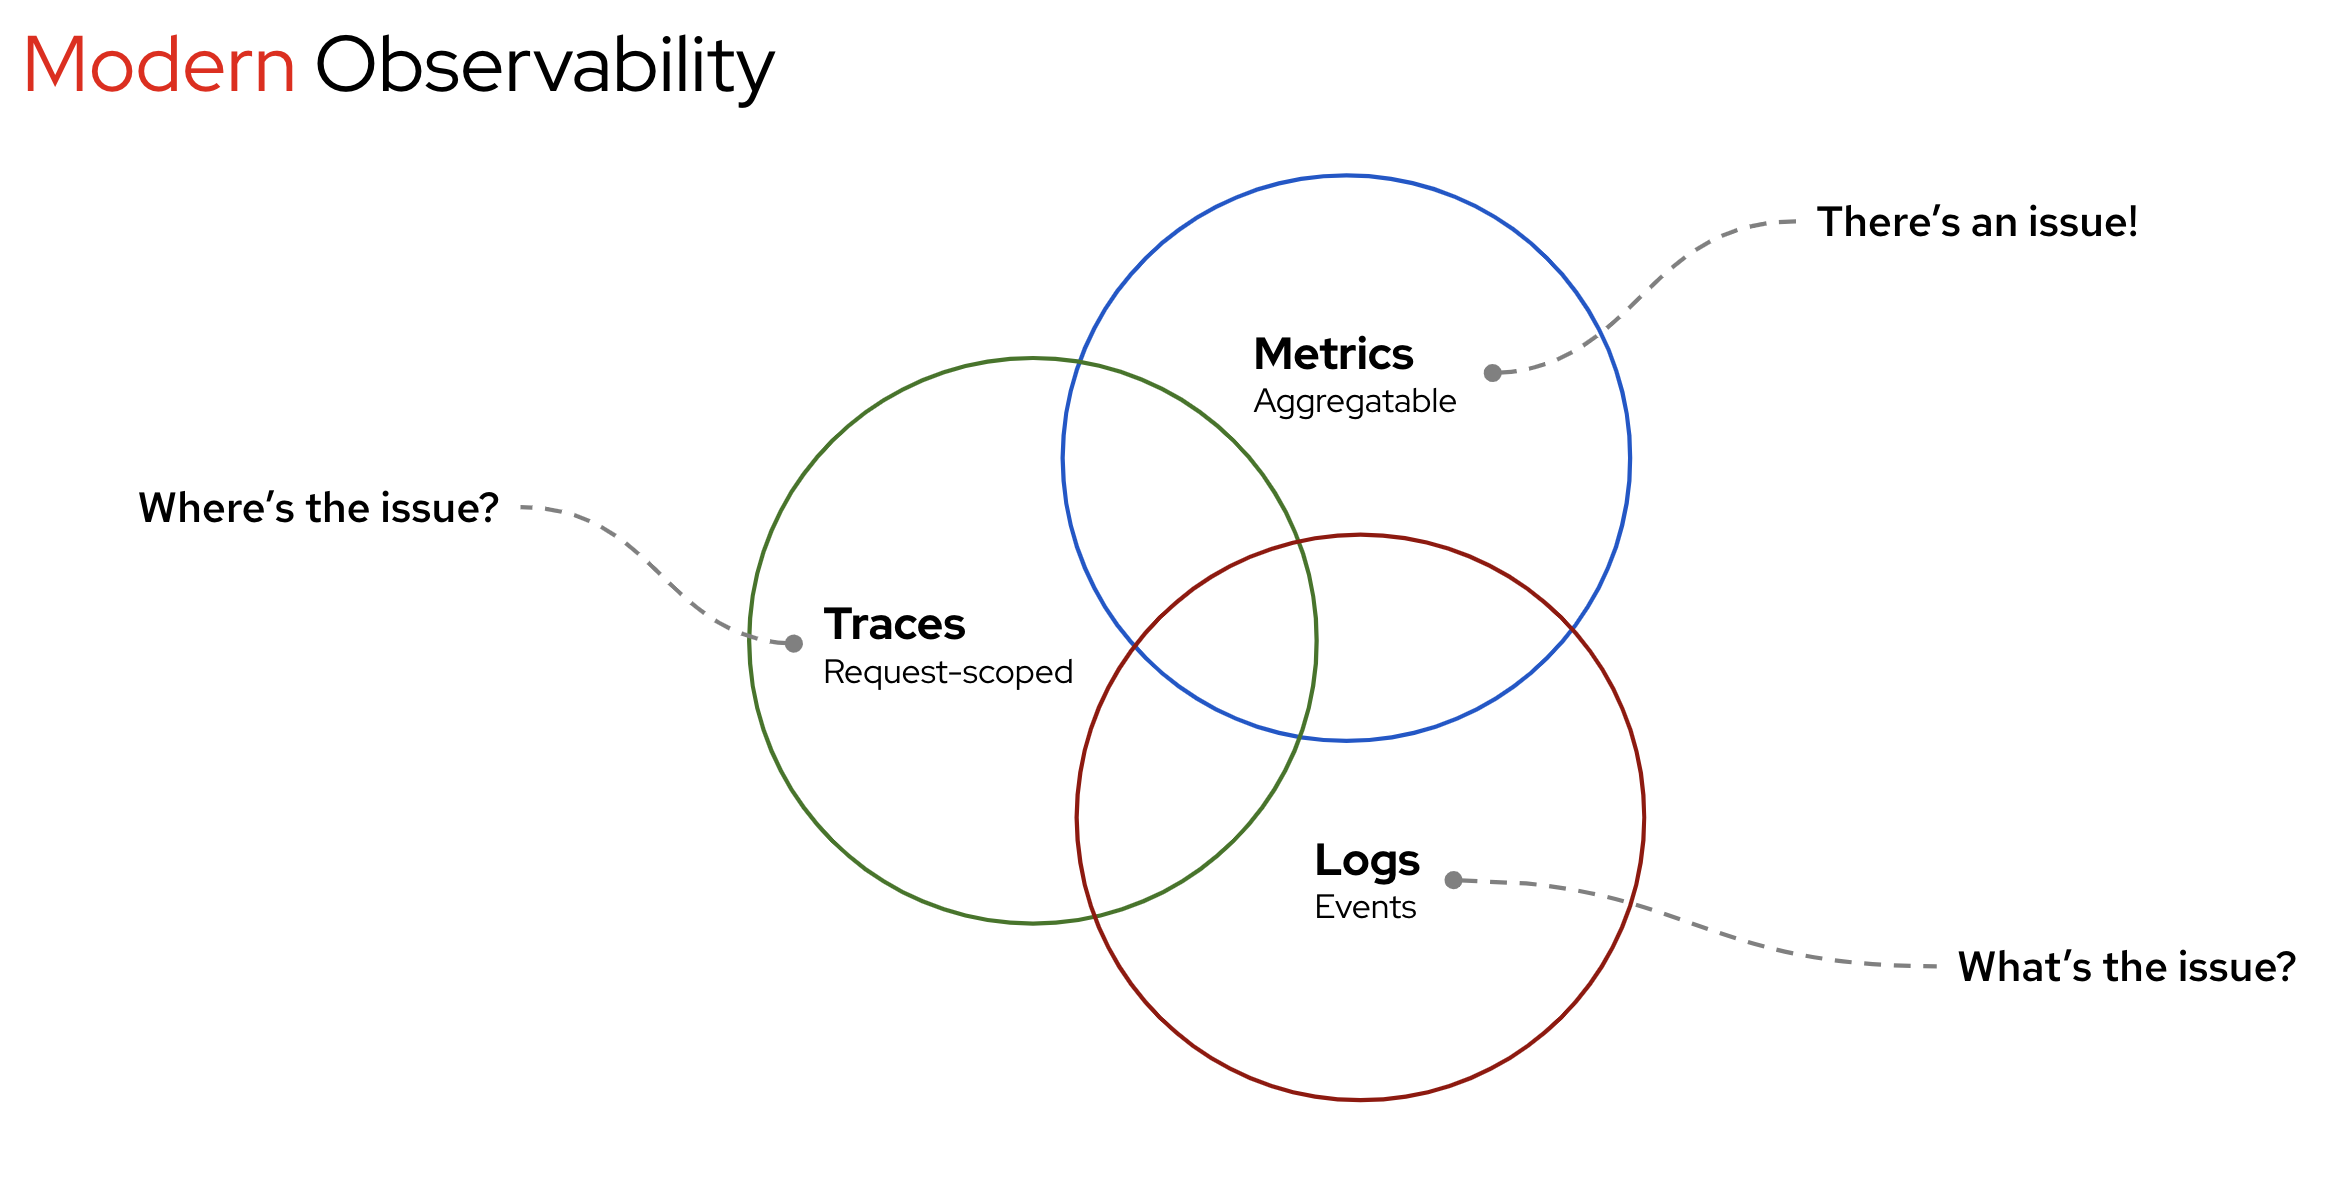
    With the latest release of the Cluster Observability Operator version 0.4.0 a technology preview of the OpenShift web console Tracing plug-in has been made available to users. In addition to the ScatterPlot provided with the developer preview release in July, you can now make use of a Gantt chart to explore trace details. This is a great enhancement, as we are driven by the mission to provide Red Hat OpenShift users with an "observability as one" experience (see Figure 1), allowing you to easily analyze metrics, alerts, logs, network traffic, and now traces under one console. 

    A Venn diagram showing aspects of Modern Observability. One circle is labeled Metrics Aggregatable with a dotted line pointing towards it from outside labeled There's an issue! Another circle is labeled Logs Events with a dotted line labeled What's the issue? pointing towards it. The third circle is labeled Traces Request-scoped and has a dotted line labeled Where's the issue? pointing towards it.
    Figure 1: Overview of Modern Observability.
    Figure 1: Overview of Modern Observability.

    Note that—as highlighted in our previous article (see developer preview link above)—Perses is the open source project of choice powering the Traces UI plug-in: from the ScatterPlot and the trace table to the Gantt chart. Thanks to this work, Perses now supports Tempo as a data store. Learn more about Perses, which was recently accepted as a CNCF Sandbox project.

    With this background in mind, key new functionalities of the Traces UI plug-in technology preview release include:

    • New TraceQL querier.
    • Improved and interactive trace table.
    • Brand new mini Gantt chart facilitating user navigation.
    • Gantt Chart with trace details and side panel to investigate trace attributes and events.
    • Multi-tenancy is now supported.

    Disclaimer:

    Instances without multi-tenancy are not supported anymore to prevent any potential security issues.

    Not yet sure how Traces can help you? A series of blogs deep dive into the topic. Read the latest ones to learn how to best benefit from this innovative observability pillar—particularly essential for complex applications and microservice systems. And now, let’s explore what’s new!

    Technology preview: Everything you need to know

    To make use of the Traces UI plug-in’s technology preview release, users need to send traces to an existing distributed tracing platform (Tempo), optionally via the Red Hat build of OpenTelemetry. As the plug-in is deployed via the Cluster Observability Operator, installing it is a must. Therefore, once the relevant operators are installed, you will be able to make use of the existing Observability UI plug-ins, including the brand new Tracing one. 

    Now you are ready to explore distributed traces, which are crucial to monitor the lifecycle of requests across distributed systems. When accessing the Observe > Traces UI in the OpenShift web console, you first need to select a Tempo instance and Tenant, then enter the relevant TraceQL query to select the services that are key to your use case. Following this selection, you are able to visualize a scatter plot displaying spans sizes and the related trace table (see Figure 2).

    A view of the Traces UI within the OpenShift web console displaying a scatterplot and trace table.
    Figure 2: Observe>Traces UI - ScatterPlot and trace table.
    Figure 2: Observe > Traces UI–scatter plot and trace table.

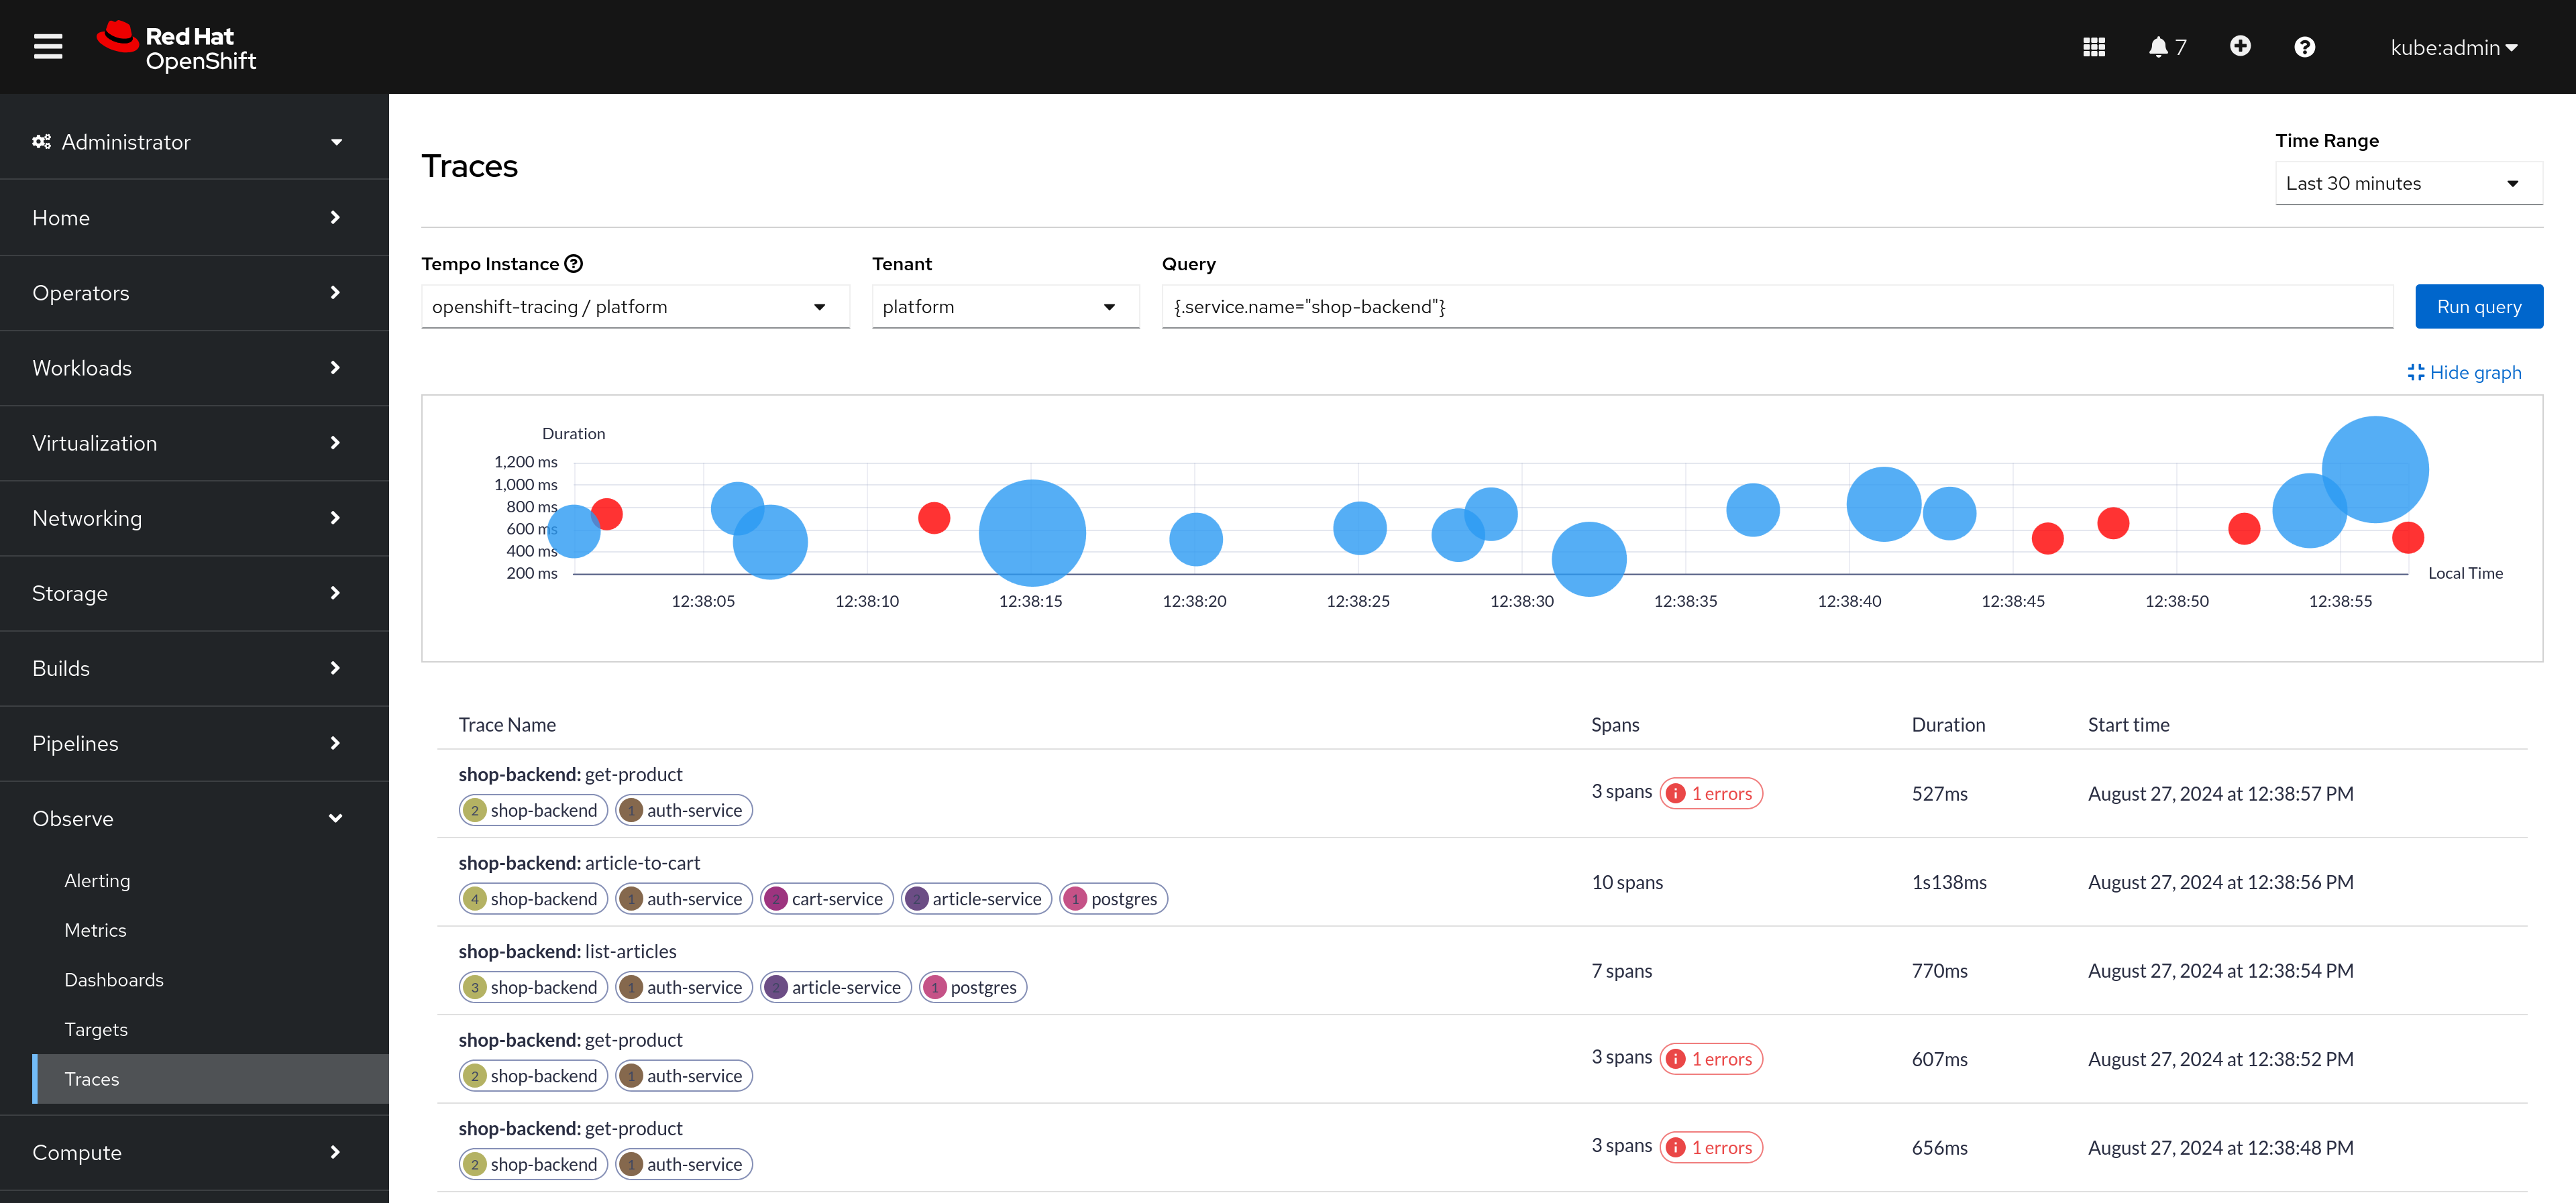
    What does the scatter plot display?

    • Bubble size: The bigger the bubble, the higher the number of spans in the trace.
    • Color coding: Blue means that all spans in the trace were successful, and red means that an error was detected in one or more spans of the trace.
    • The X-axis represents the timeline of when the traces were generated.
    • The Y-axis represents the duration of the traces.

    Moreover, in the enhanced trace table—positioned below the scatter plot—you have the ability to analyze: 1) the specific trace name and related services, 2) the number of spans and (if detected) related errors, 3) the total span duration, and 4) the start time. Note that at the top right of the page, you can select your preferred time range, which eases the data navigation experience. Additionally, the table described here is now interactive, meaning that when clicking on each trace you will be directed to the relevant trace detail—displayed in the brand new Gantt Chart (Figure 3).

    Gantt chart: Observing your requests with context

    When we added the scatter plot in our previous release, we knew there was something very important yet to come: the ability to navigate throughout the entire request spans generated from a request. This feature is critical to close the observability loop, and that is why we are so happy to see this as a reality. Stay with us and let’s continue navigating the OpenShift web console!

    A view of the Traces UI within the OpenShift web console displaying a Gantt chart and mini Gantt chart.
    Figure 3: Observe>Traces UI - mini Gantt Chart & Gantt Chart.
    Figure 3: Observe > Traces UI—mini Gantt Chart and Gantt Chart.

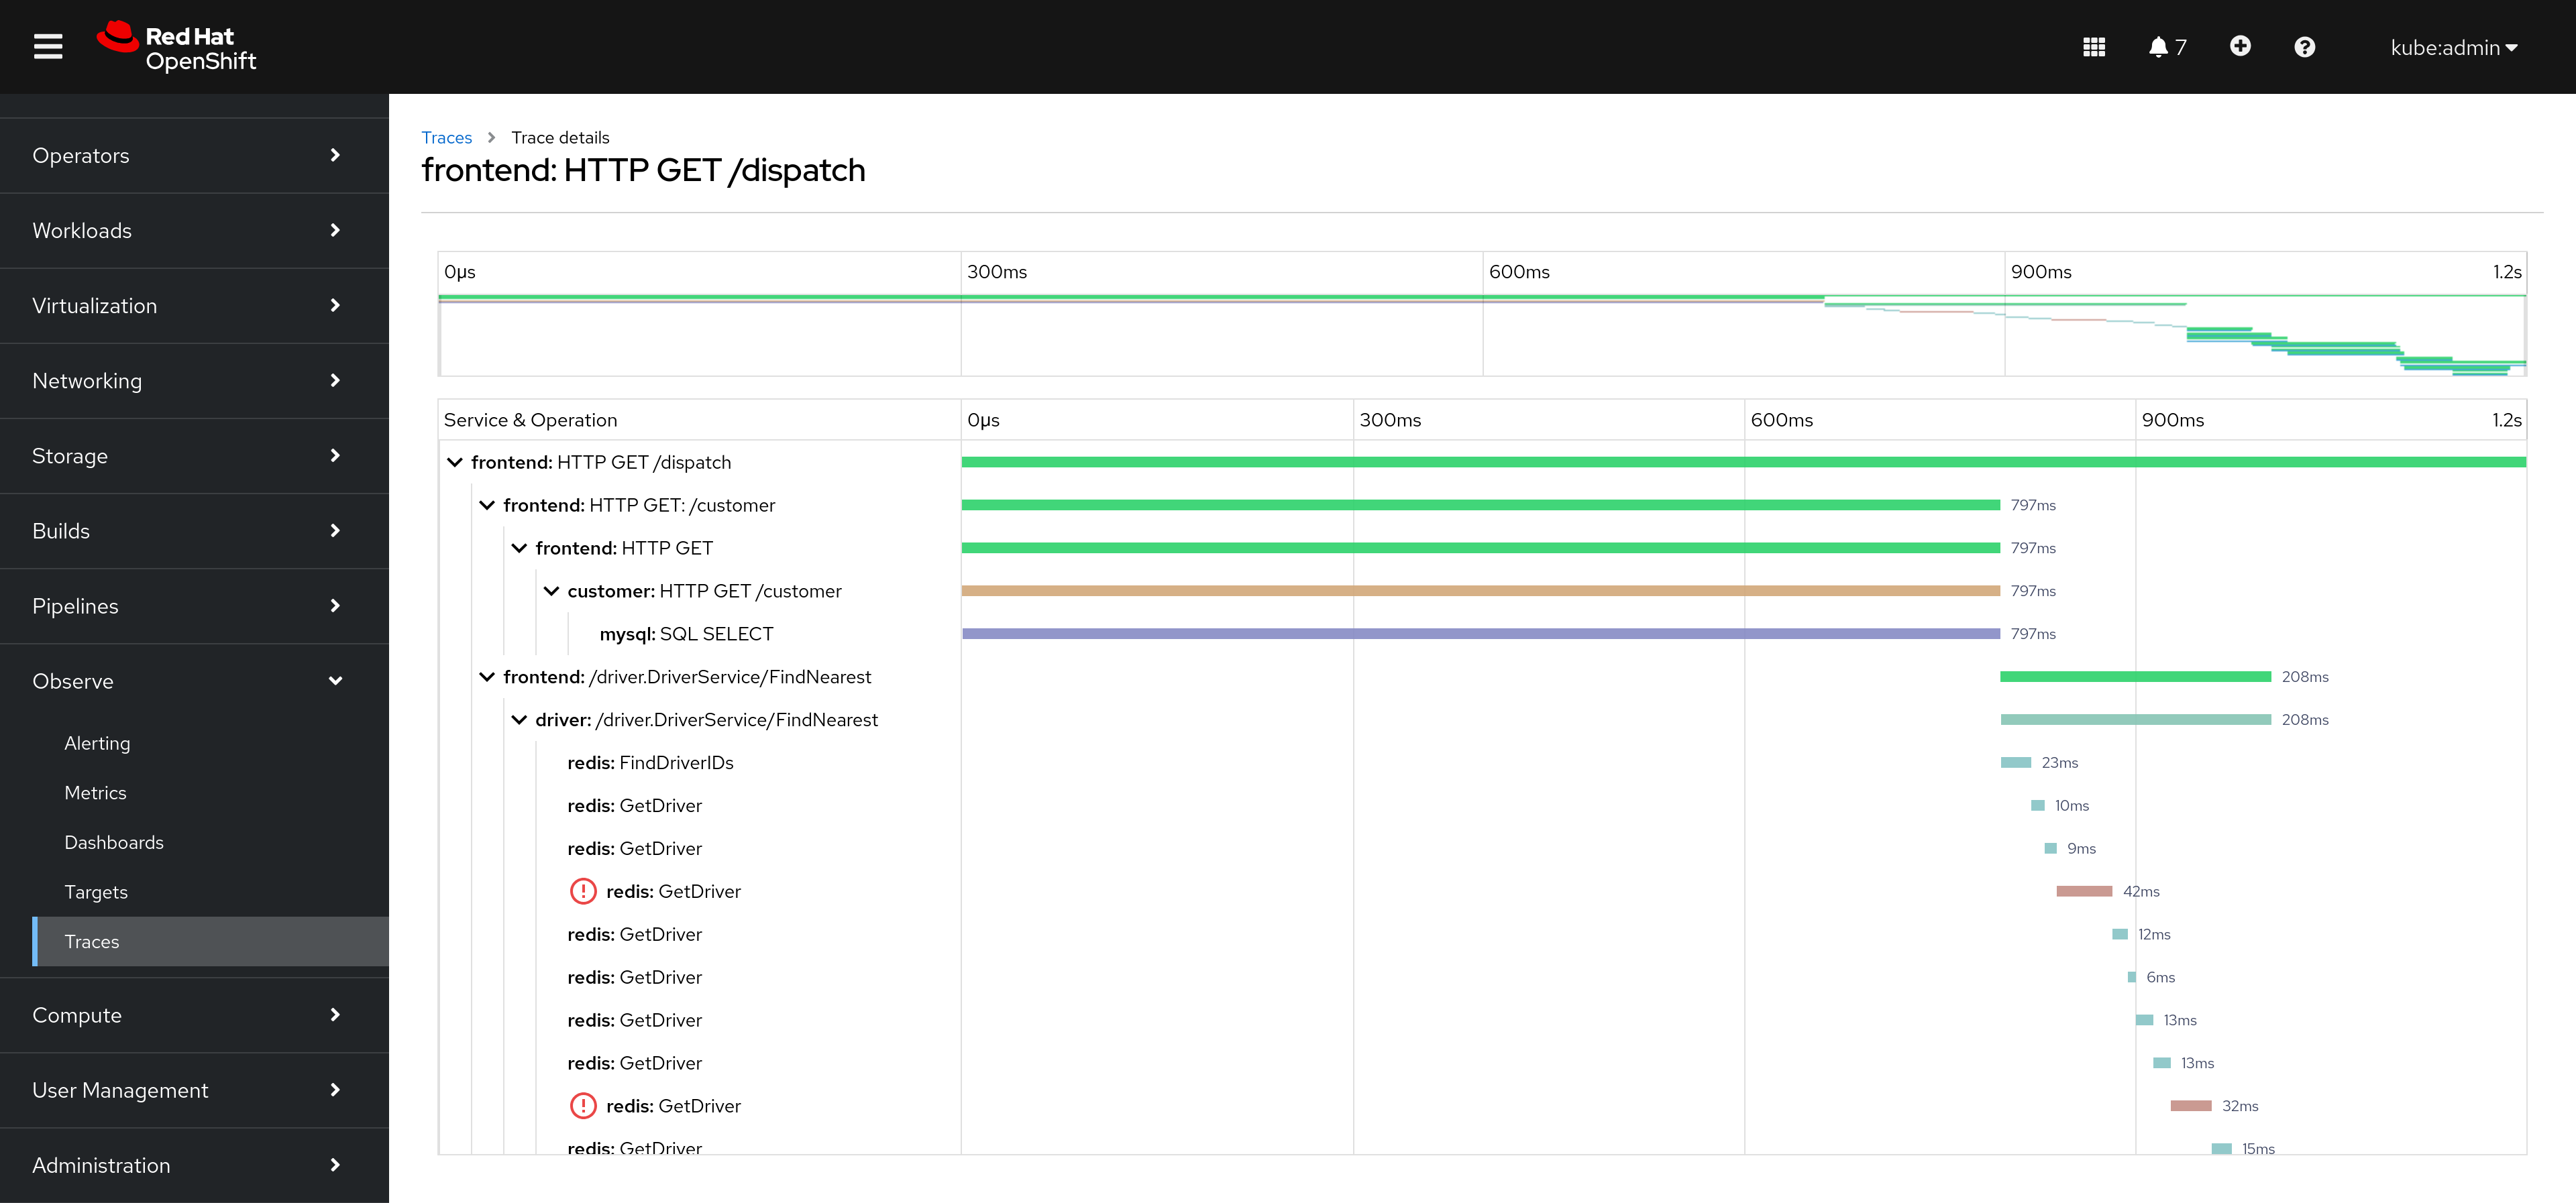
    First of all, at the top of the page (Figure 3 above) you can make use of the brand new mini Gantt chart. This allows you to better navigate trace details, such as selecting your desired time duration—allowing users to better zoom in into the chosen time frame—an action that will be reflected in the main Gantt chart (positioned below the mini Gantt chart) where you can investigate parent-child spans, and thus drill down into more granular levels of information.

    As displayed in Figure 4, users can also click on a specific span in the Gantt chart and access—via a side panel on the right—the attributes and events related to the chosen span, including resource attributes.

    A view of the Traces UI within the OpenShift web console displaying a Gannt chart and the associated side panel.
    Figure 4: Observe>Traces UI - Gantt Chart & Side Panel.
    Figure 4: Observe > Traces UI—Gantt Chart and side panel.

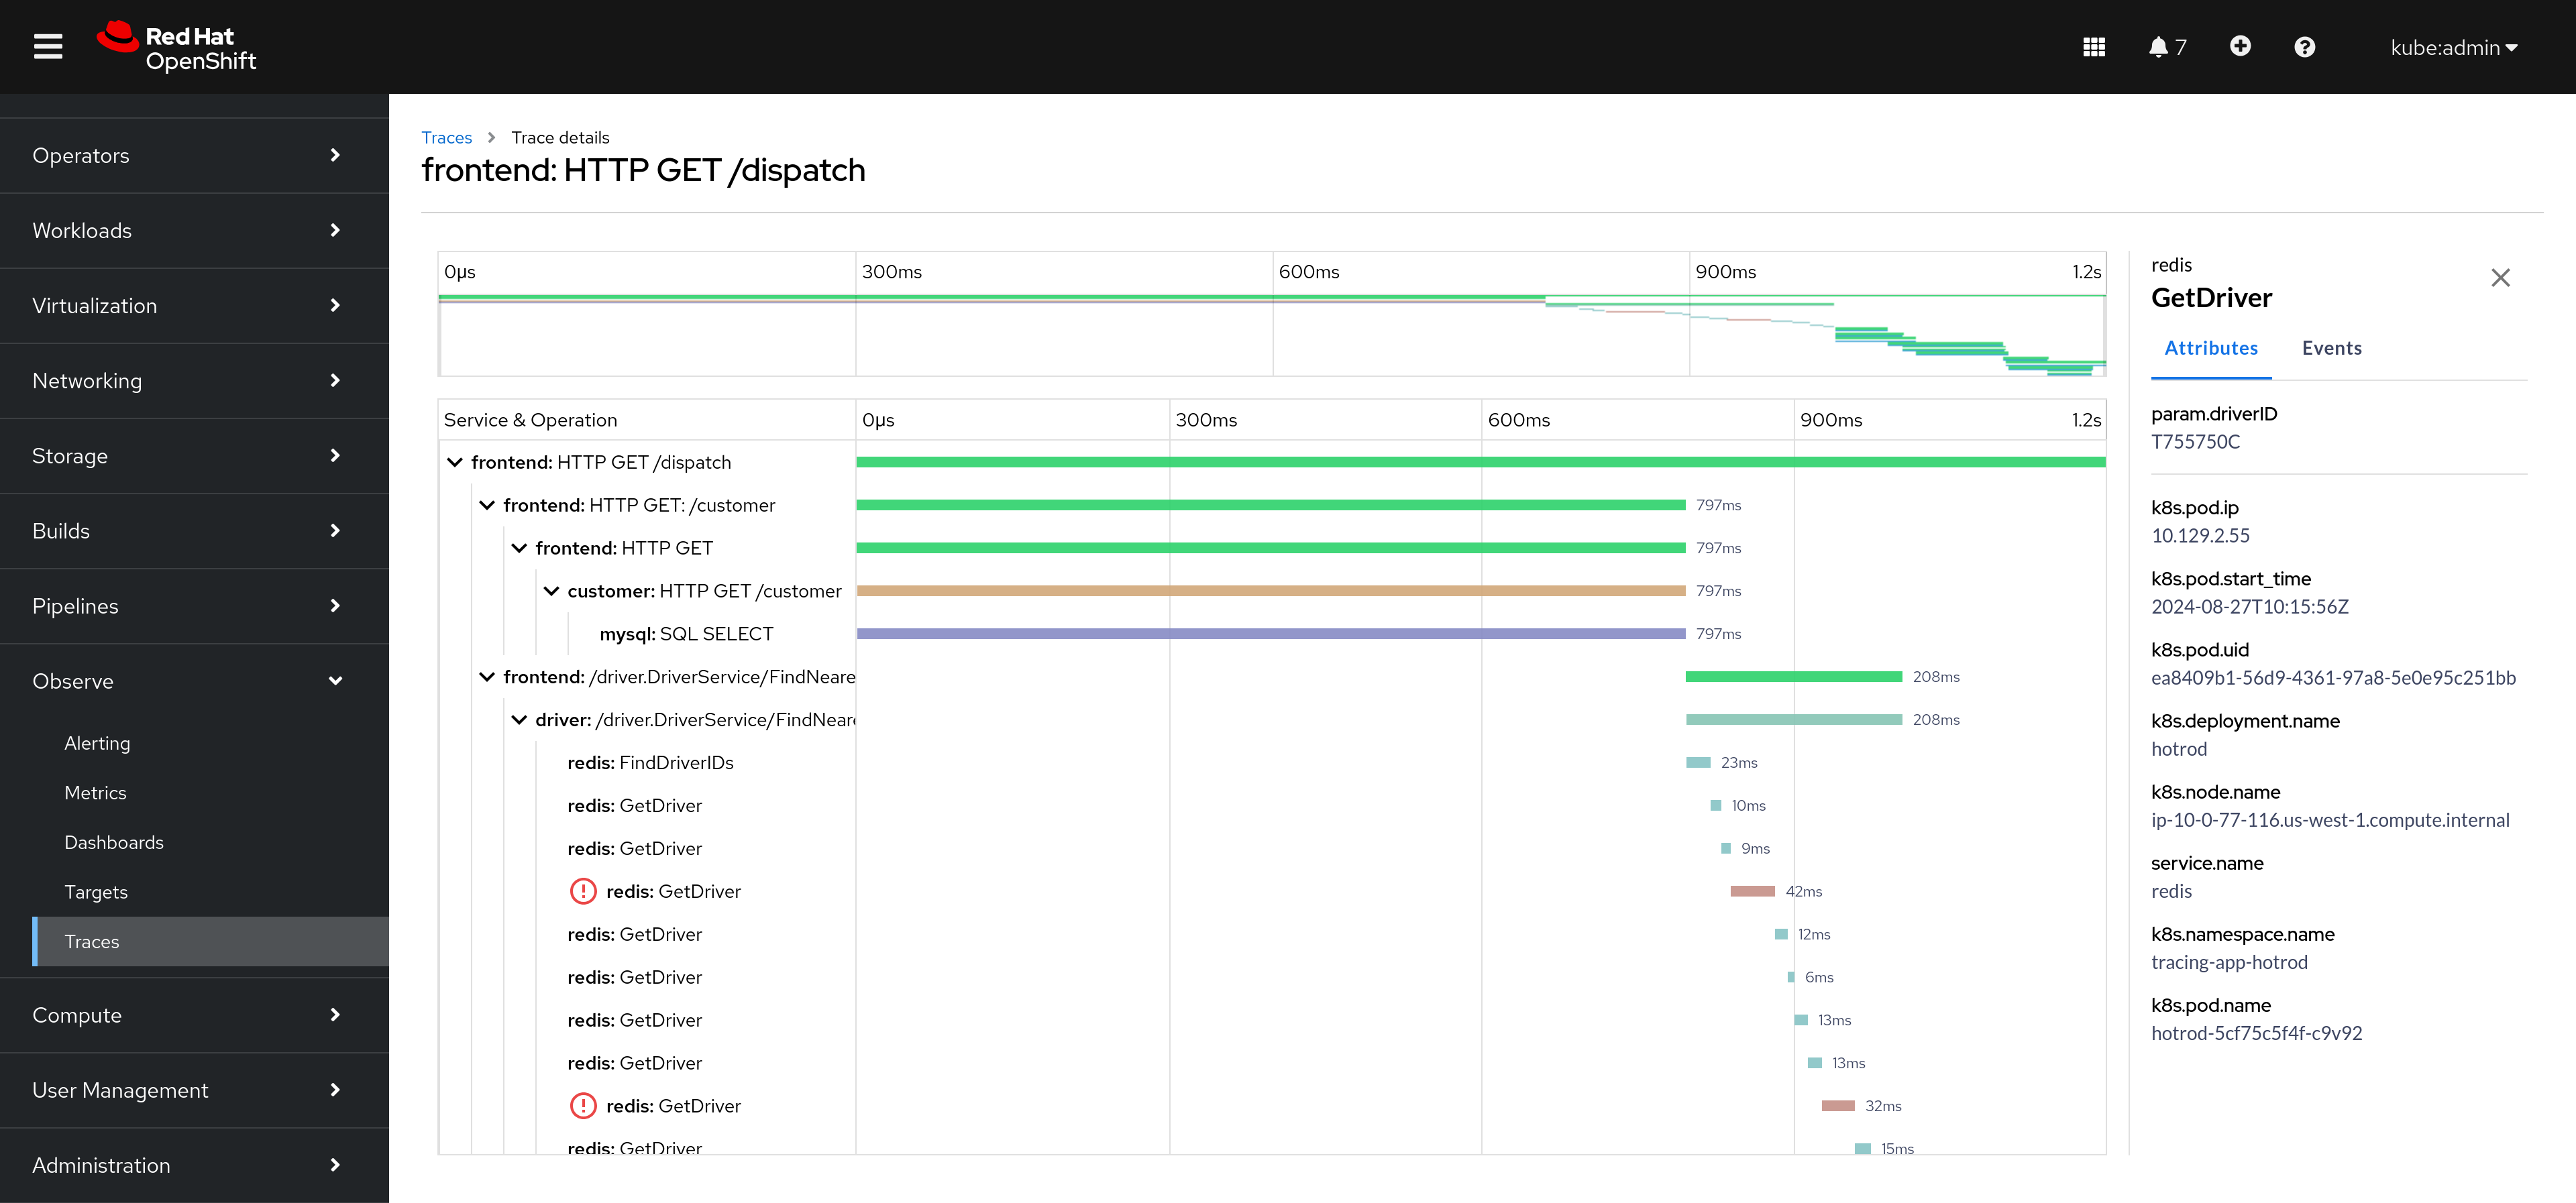
    This is very important to users, as it is now possible to check, with context:

    • Which spans take more time.
    • The relationship between spans.
    • The identity of problematic and healthy spans.
    • Status codes and relevant data.

    This Gantt chart and side panel provide users access to a high level view as well as granular information to understand where the issue is, and identify what can be causing it.

    All in all, this technology preview release provides the heart of any Tracing exploration experience: the Gantt chart. Thanks to this visualization tool, OpenShift users are empowered to easily detect areas of improvement for their services (e.g., performance inefficiencies or problematic code), prioritize tasks, and prevent major incidents.

    What’s next?

    The ability to make use of a native Traces UI in the OpenShift web console is a game-changing feature that improves the overall observability visualization experience and promotes additional data exploration and troubleshooting opportunities. Note that the Tempo operator will still be shipped in the Jaeger User Interface while we continue working to provide all important features and updates in the OpenShift web console based on your feedback. 

    With the latest Cluster Observability Operator 0.4.0 release, a technology preview of observability signal correlation has also been made available. Trace support is currently being worked on so that OpenShift users will be able to navigate through a greater range of correlated observability signals/resources and investigate issues in a timely manner. For example, given a specific alert, users will be able to quickly identify its correlated metric(s), log(s), netflows, and soon, traces. 

    Moreover, as we plan to make the Traces UI plug-in generally available to OpenShift users—and in parallel improving usability with advanced filtering—we are looking forward to receiving your input and ideas. Feel free to share your questions and recommendations with us using the Red Hat OpenShift feedback form. 

    Related Posts

    • Introducing the new Traces UI in the Red Hat OpenShift Web Console

    • Where can I download the OpenShift command line tool?

    • New developer quick starts and more in the Red Hat OpenShift 4.7 web console

    • Get started with the OpenShift Cluster Observability Operator

    Recent Posts

    • Protect data offloaded to GPU-accelerated environments with OpenShift sandboxed containers

    • Case study: Measuring energy efficiency on the x64 platform

    • How to prevent AI inference stack silent failures

    • Preventing GPU waste: A guide to JIT checkpointing with Kubeflow Trainer on OpenShift AI

    • How to manage TLS certificates used by OpenShift GitOps operator

    What’s up next?

    Download the OpenShift command-line essentials cheat sheet for developers to discover the most useful commands for working with the oc CLI.

    Get the cheat sheet
    Red Hat Developers logo LinkedIn YouTube Twitter Facebook

    Platforms

    • Red Hat AI
    • Red Hat Enterprise Linux
    • Red Hat OpenShift
    • Red Hat Ansible Automation Platform
    • See all products

    Build

    • Developer Sandbox
    • Developer tools
    • Interactive tutorials
    • API catalog

    Quicklinks

    • Learning resources
    • E-books
    • Cheat sheets
    • Blog
    • Events
    • Newsletter

    Communicate

    • About us
    • Contact sales
    • Find a partner
    • Report a website issue
    • Site status dashboard
    • Report a security problem

    RED HAT DEVELOPER

    Build here. Go anywhere.

    We serve the builders. The problem solvers who create careers with code.

    Join us if you’re a developer, software engineer, web designer, front-end designer, UX designer, computer scientist, architect, tester, product manager, project manager or team lead.

    Sign me up

    Red Hat legal and privacy links

    • About Red Hat
    • Jobs
    • Events
    • Locations
    • Contact Red Hat
    • Red Hat Blog
    • Inclusion at Red Hat
    • Cool Stuff Store
    • Red Hat Summit
    © 2026 Red Hat

    Red Hat legal and privacy links

    • Privacy statement
    • Terms of use
    • All policies and guidelines
    • Digital accessibility

    Chat Support

    Please log in with your Red Hat account to access chat support.