Redhat Developers  Logo
  • Products

    Featured

    • Red Hat Enterprise Linux
      Red Hat Enterprise Linux Icon
    • Red Hat OpenShift AI
      Red Hat OpenShift AI
    • Red Hat Enterprise Linux AI
      Linux icon inside of a brain
    • Image mode for Red Hat Enterprise Linux
      RHEL image mode
    • Red Hat OpenShift
      Openshift icon
    • Red Hat Ansible Automation Platform
      Ansible icon
    • Red Hat Developer Hub
      Developer Hub
    • View All Red Hat Products
    • Linux

      • Red Hat Enterprise Linux
      • Image mode for Red Hat Enterprise Linux
      • Red Hat Universal Base Images (UBI)
    • Java runtimes & frameworks

      • JBoss Enterprise Application Platform
      • Red Hat build of OpenJDK
    • Kubernetes

      • Red Hat OpenShift
      • Microsoft Azure Red Hat OpenShift
      • Red Hat OpenShift Virtualization
      • Red Hat OpenShift Lightspeed
    • Integration & App Connectivity

      • Red Hat Build of Apache Camel
      • Red Hat Service Interconnect
      • Red Hat Connectivity Link
    • AI/ML

      • Red Hat OpenShift AI
      • Red Hat Enterprise Linux AI
    • Automation

      • Red Hat Ansible Automation Platform
      • Red Hat Ansible Lightspeed
    • Developer tools

      • Red Hat Trusted Software Supply Chain
      • Podman Desktop
      • Red Hat OpenShift Dev Spaces
    • Developer Sandbox

      Developer Sandbox
      Try Red Hat products and technologies without setup or configuration fees for 30 days with this shared Openshift and Kubernetes cluster.
    • Try at no cost
  • Technologies

    Featured

    • AI/ML
      AI/ML Icon
    • Linux
      Linux Icon
    • Kubernetes
      Cloud icon
    • Automation
      Automation Icon showing arrows moving in a circle around a gear
    • View All Technologies
    • Programming Languages & Frameworks

      • Java
      • Python
      • JavaScript
    • System Design & Architecture

      • Red Hat architecture and design patterns
      • Microservices
      • Event-Driven Architecture
      • Databases
    • Developer Productivity

      • Developer productivity
      • Developer Tools
      • GitOps
    • Secure Development & Architectures

      • Security
      • Secure coding
    • Platform Engineering

      • DevOps
      • DevSecOps
      • Ansible automation for applications and services
    • Automated Data Processing

      • AI/ML
      • Data Science
      • Apache Kafka on Kubernetes
      • View All Technologies
    • Start exploring in the Developer Sandbox for free

      sandbox graphic
      Try Red Hat's products and technologies without setup or configuration.
    • Try at no cost
  • Learn

    Featured

    • Kubernetes & Cloud Native
      Openshift icon
    • Linux
      Rhel icon
    • Automation
      Ansible cloud icon
    • Java
      Java icon
    • AI/ML
      AI/ML Icon
    • View All Learning Resources

    E-Books

    • GitOps Cookbook
    • Podman in Action
    • Kubernetes Operators
    • The Path to GitOps
    • View All E-books

    Cheat Sheets

    • Linux Commands
    • Bash Commands
    • Git
    • systemd Commands
    • View All Cheat Sheets

    Documentation

    • API Catalog
    • Product Documentation
    • Legacy Documentation
    • Red Hat Learning

      Learning image
      Boost your technical skills to expert-level with the help of interactive lessons offered by various Red Hat Learning programs.
    • Explore Red Hat Learning
  • Developer Sandbox

    Developer Sandbox

    • Access Red Hat’s products and technologies without setup or configuration, and start developing quicker than ever before with our new, no-cost sandbox environments.
    • Explore Developer Sandbox

    Featured Developer Sandbox activities

    • Get started with your Developer Sandbox
    • OpenShift virtualization and application modernization using the Developer Sandbox
    • Explore all Developer Sandbox activities

    Ready to start developing apps?

    • Try at no cost
  • Blog
  • Events
  • Videos

Introducing the new Traces UI in the Red Hat OpenShift Web Console

July 10, 2024
Vanessa Martini Jose Gomez-Selles
Related topics:
Hybrid CloudKubernetesObservabilityOpen sourceOperators
Related products:
Red Hat OpenShiftRed Hat OpenShift Container Platform

Share:

    With the latest Cluster Observability Operator 0.3.0 release, you can deploy a brand new Traces UI plug-in as part of the Red Hat OpenShift Container Platform web console experience. This is a great step forward as we continue to work on our mission to provide Observability as one. After releasing a Metrics UI and Logs UI, we enhance the overall Observability journey for our OpenShift users by providing the opportunity to visualize the third pillar of Observability: distributed tracing. This is a Developer Preview feature, as additional enhancements are currently being worked on. 

    The OpenShift distributed tracing platform is evolving. A few months back, we announced general availability of Tempo as part of the distributed tracing platform 3.0 release. While making this change, we decided to still ship the Jaeger UI as part of the Tempo operator installations due to its great ease of use and proven track record of helping many organizations in their journey to observe distributed systems. It’s also worth noting that we recently enabled the Monitor tab in the Jaeger console. This option enables visualization of span request count, duration, and error count (RED) metrics without further instrumenting your code, when combined with the Red Hat build of OpenTelemetry. In case you were wondering, all of this is also available in the recently announced lightweight Tempo monolithic deployment.

    But we didn’t want to stop there. Now, by equipping users with the possibility to explore traces and spans directly in the OpenShift web console, we aim to make your experience even more enjoyable, as you can navigate metrics, logs, and traces under one console, thus being able to switch from one signal to another, based on the questions you may have, as well as leveraging additional analytics capabilities, including observability signal correlation for Red Hat OpenShift, which will support traces by the end of the year.  Both the Jaeger UI deployed by the Tempo operator and the Traces UI plug-in in the OpenShift console will coexist while we work towards reaching feature parity.

    Not yet sure on how Distributed Tracing can help you? Our blogs dedicated to the topic are a great starting point to embark on this journey.


    Disclaimer

    In the current Traces UI Developer Preview release, multi-tenancy is not yet supported. This means that in the current setup, there is no getaway when multi-tenancy is not enabled. Users can access the new Traces UI, but it will be open without any authentication. 

    Developer Preview: Everything you need to know

    In this example, we are explaining how to install the Traces UI in OpenShift. Before that, users need to send traces to an existing distributed tracing platform (Tempo), optionally via the Red Hat build of OpenTelemetry by following the linked official instructions.

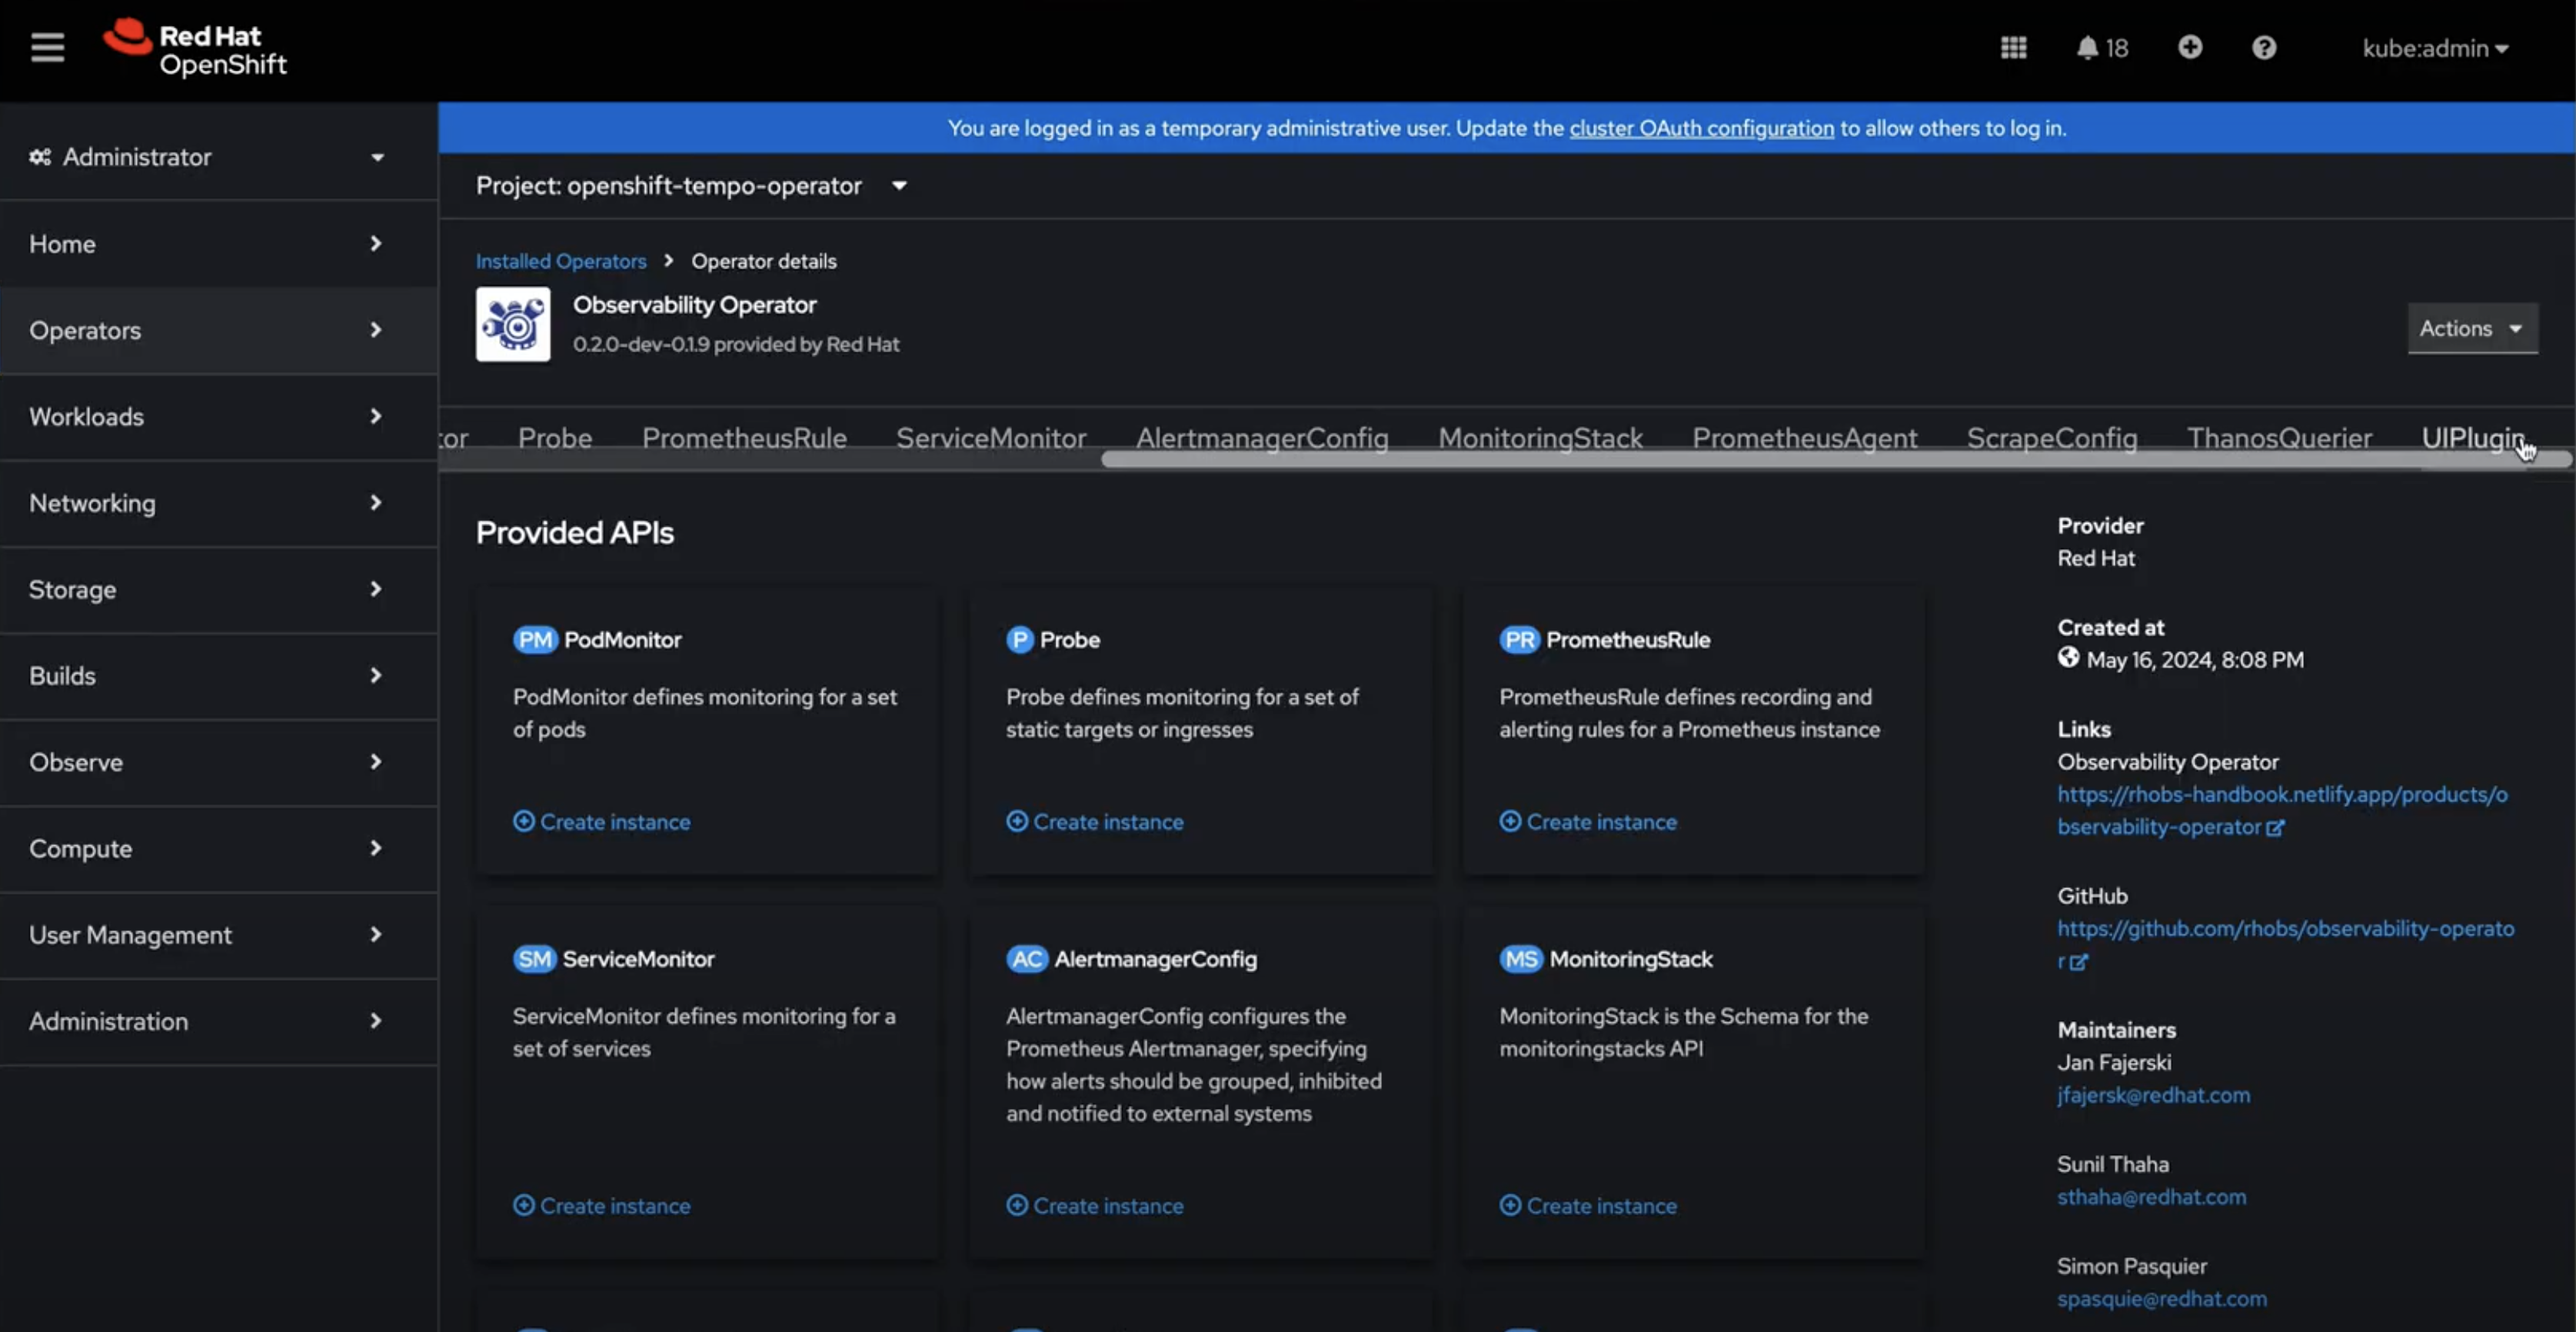
    To be able to test the Developer Preview release of the Traces UI, OpenShift the next step is to install the Cluster Observability Operator. Take a look at the needed steps below. Through the operator, users can deploy a specific set of Observability UI plug-ins, including the relevant Traces UI plug-in. See Figure 1.

    Select UIPlugin as part of the Cluster Observability Operator - available to OpenShift users.
    Figure 1: UIPlugin as part of the Cluster Observability Operator.

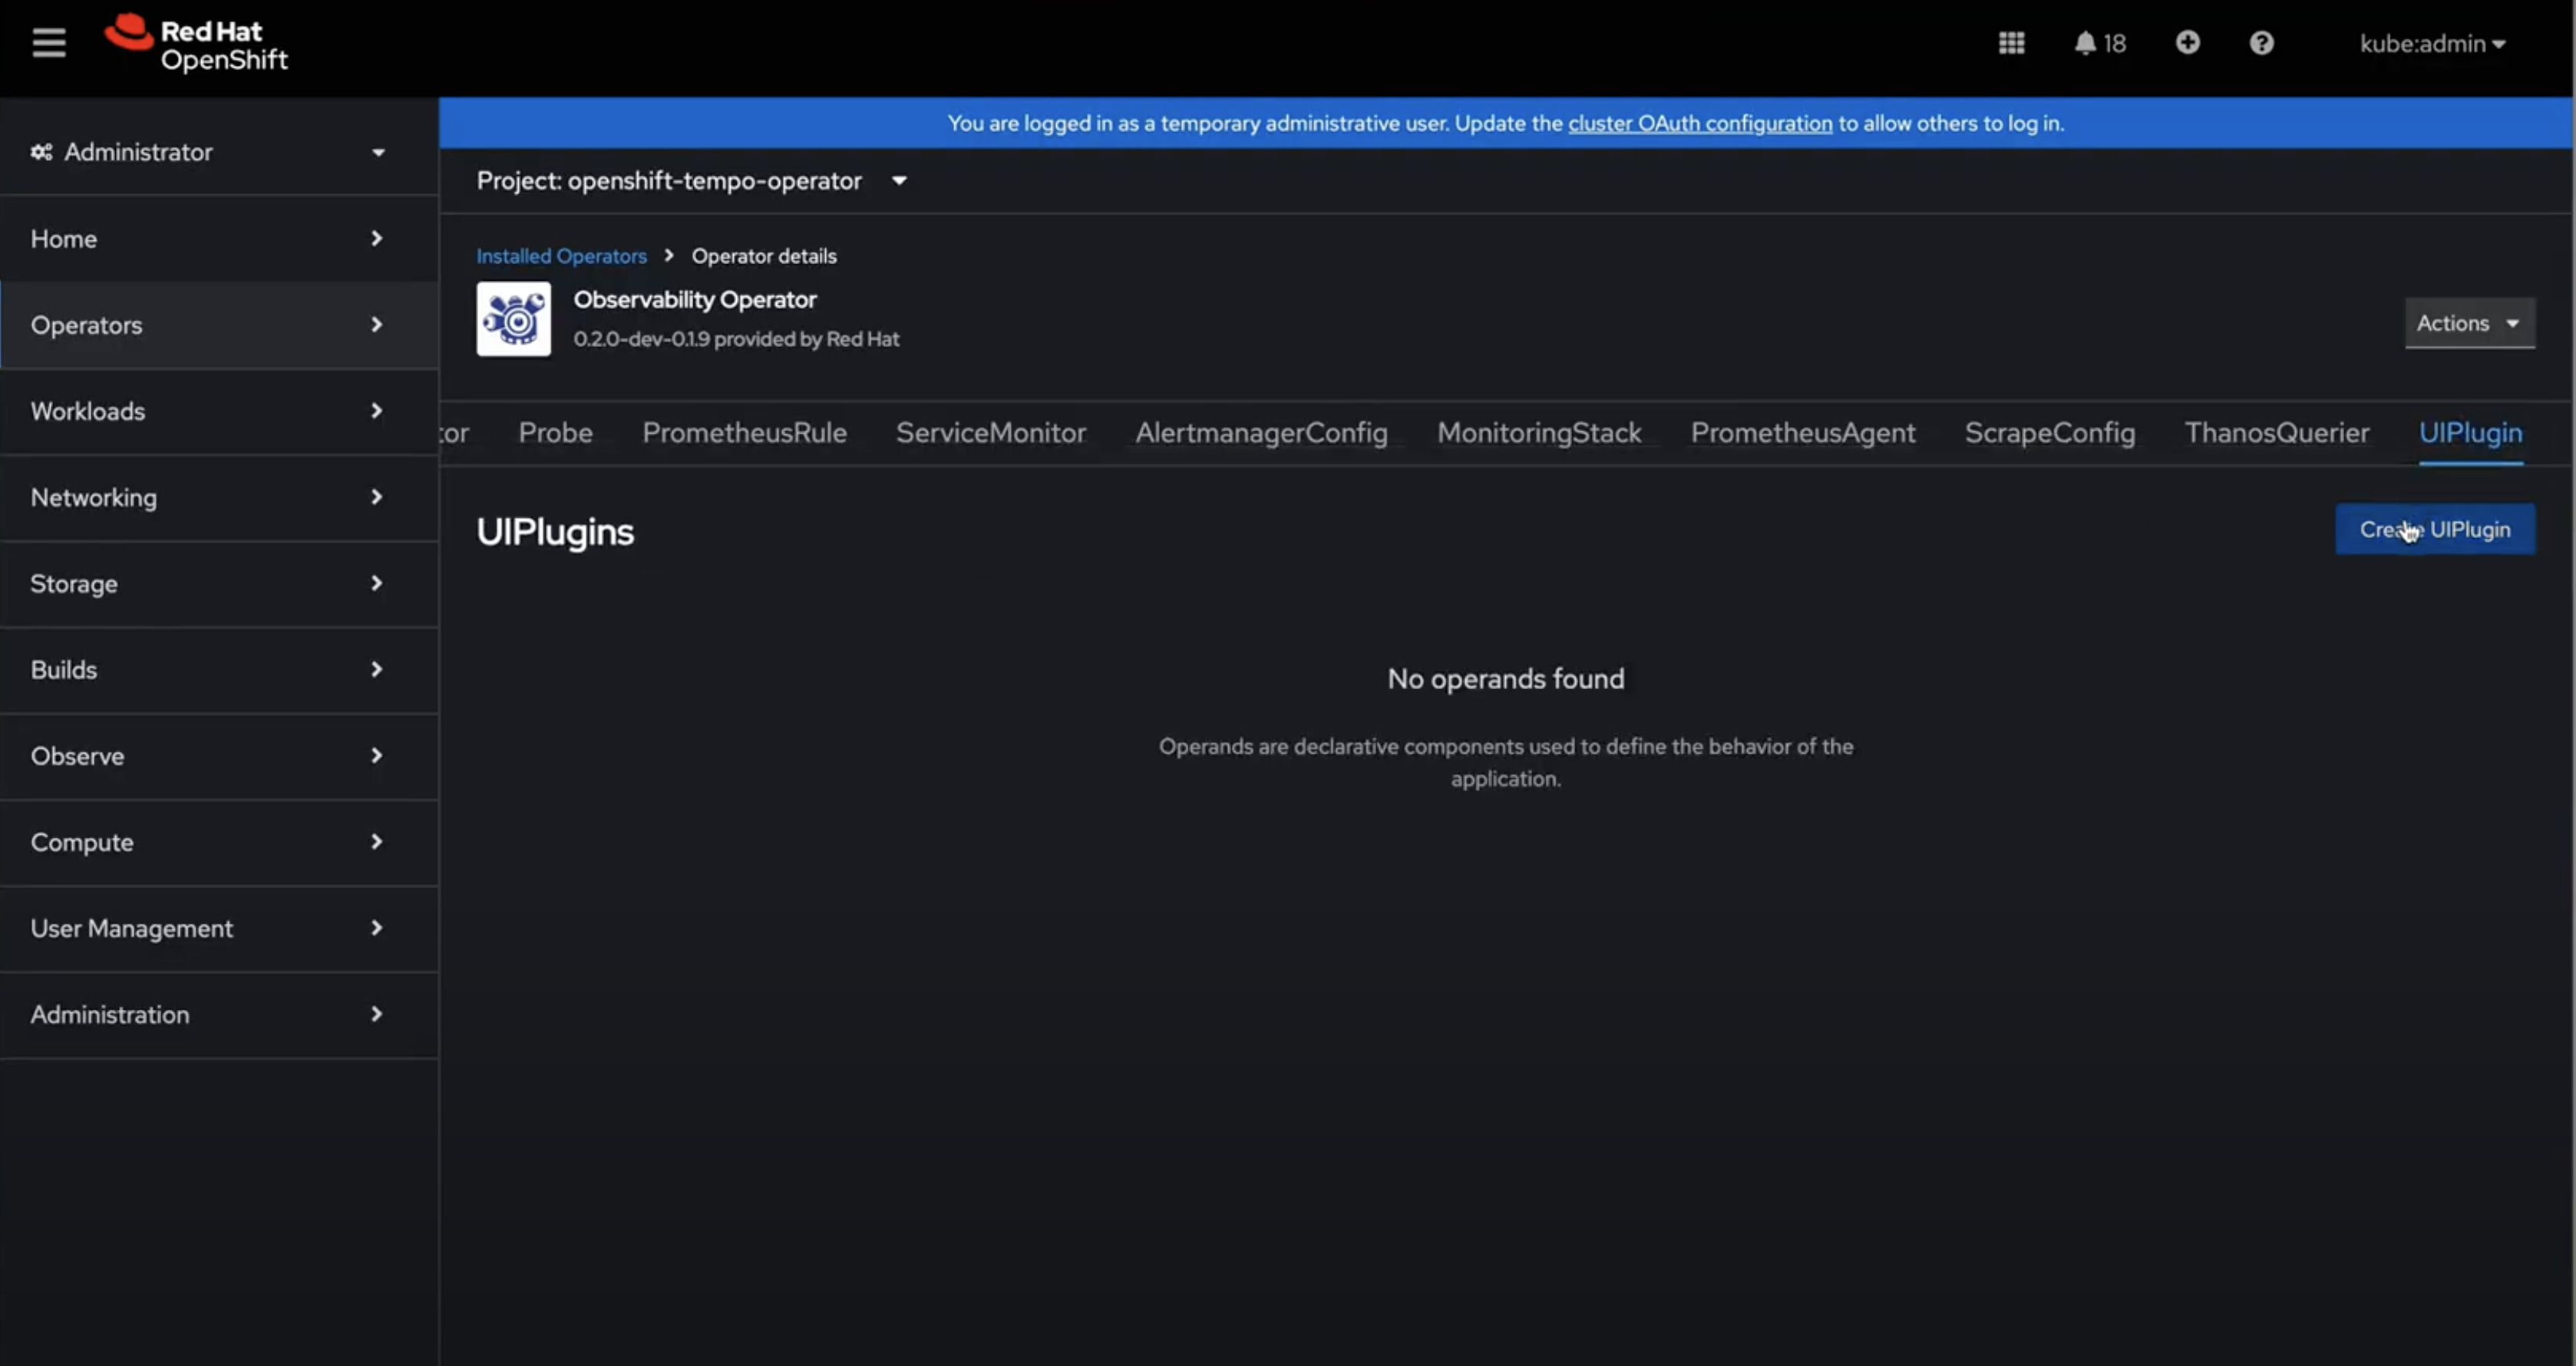
    Next, you will need to create a UIPlugin, as displayed in Figure 2. 

    Proceed by clicking on ‘Create UIPlugin’.
    Figure 2: Create a UIPlugin.

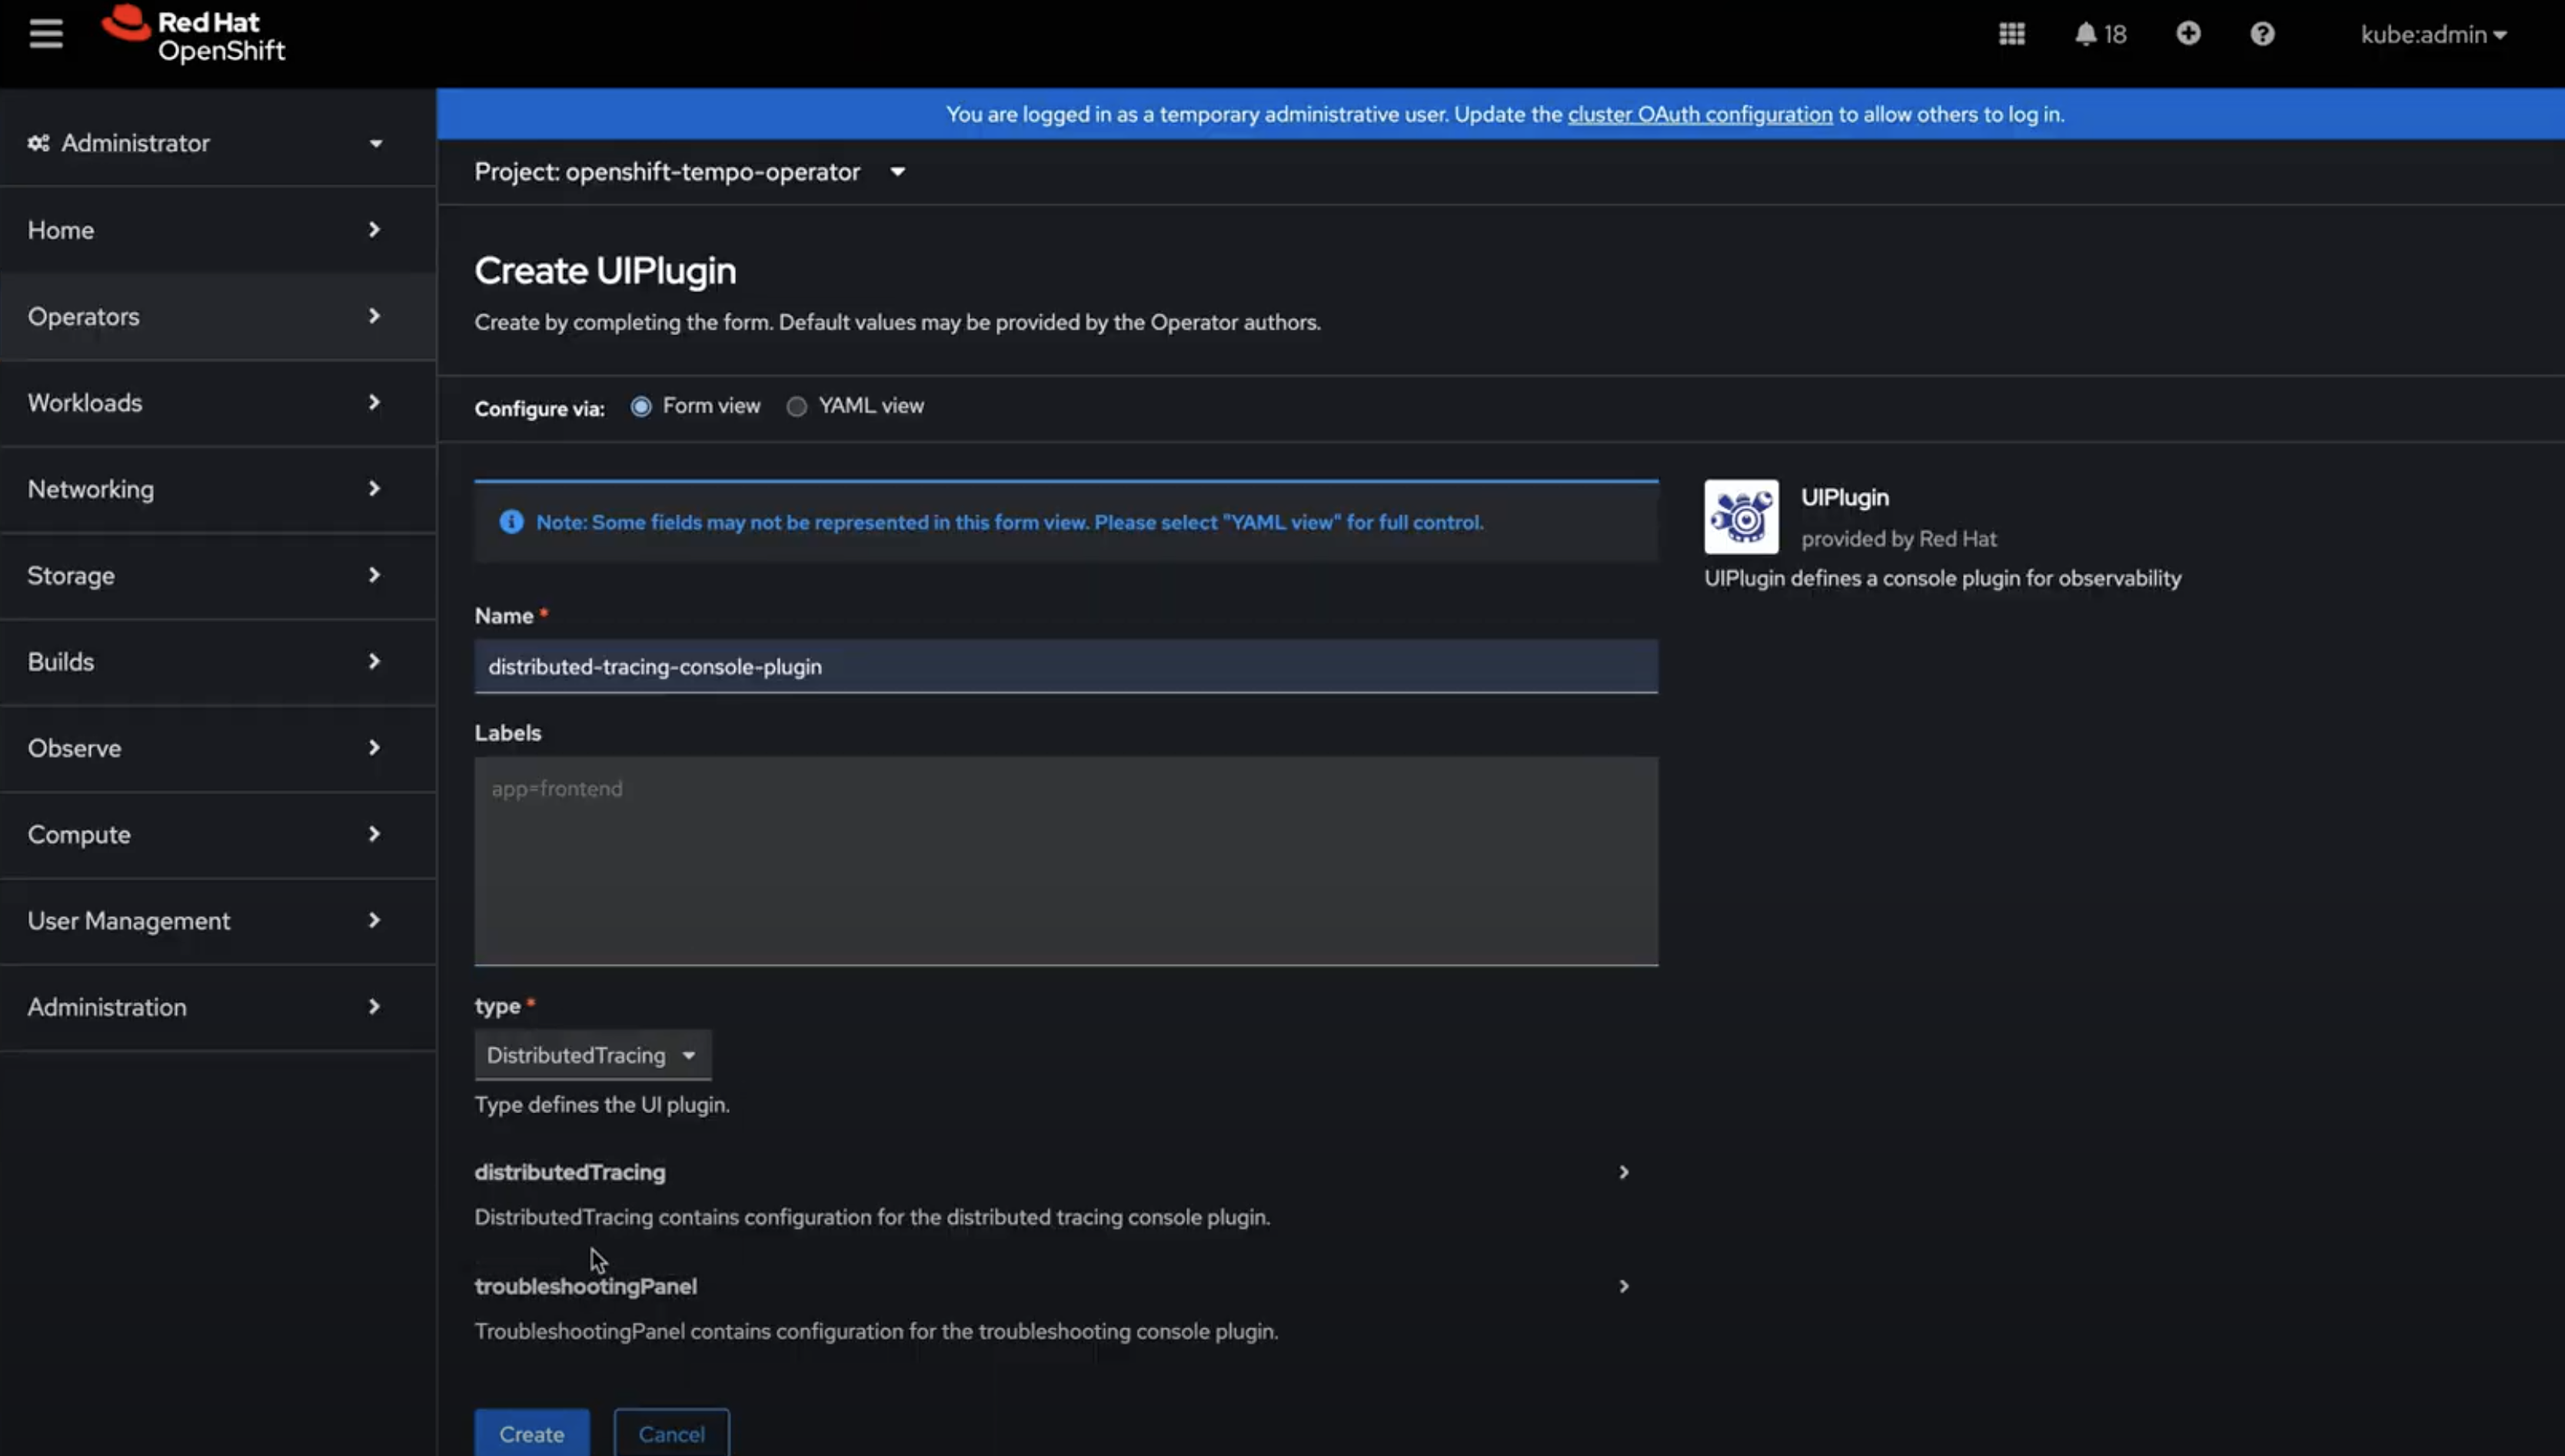
    As you create the plug-in, make sure to name it "distributed-tracing" and select DistributedTracing as the type, as shown in Figure 3.

    Create a UIPlugin, naming it ‘distributed-tracing’. Make sure to select the relevant ‘Type’.
    Figure 3: Name the plug-in "distributed-tracing" and select DistributedTracing as the type.

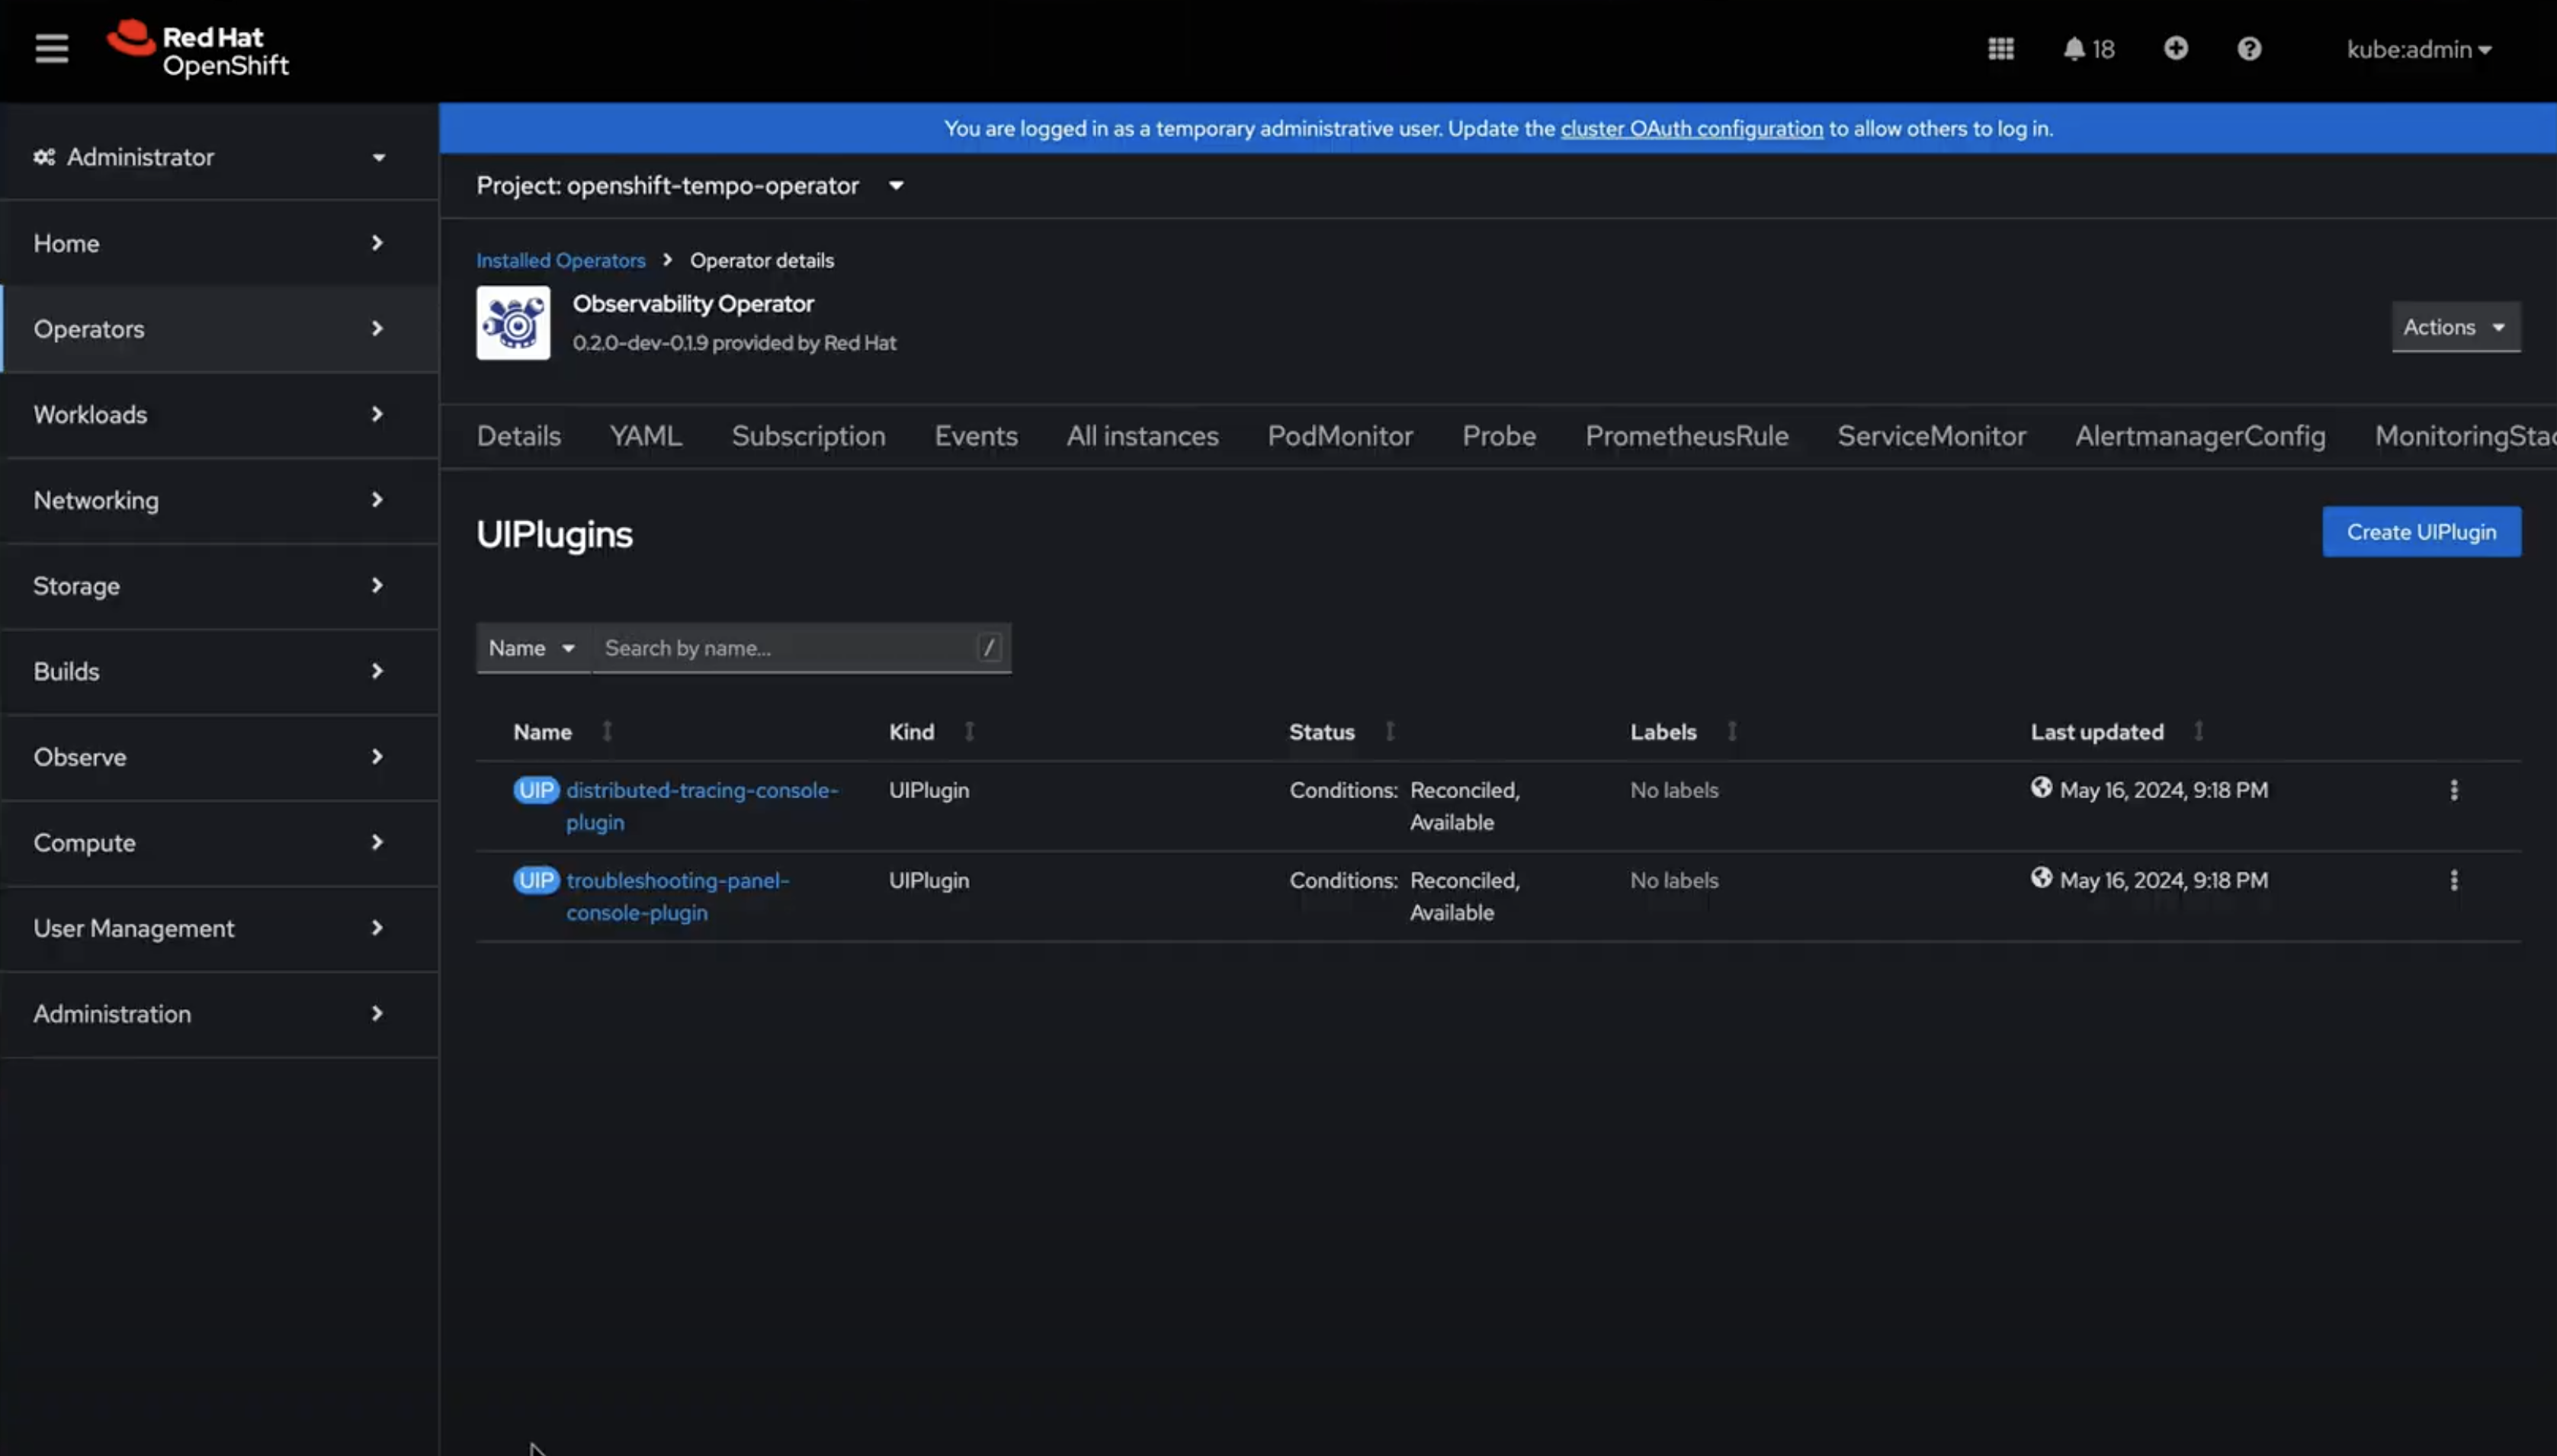
    By following this step, this is what you can expect. The distributed tracing plug-in is now available and ready to be launched. See Figure 4.

    Distributed Tracing Plugin available and ready to be used.
    Figure 4: Distributed tracing plug-in is ready.

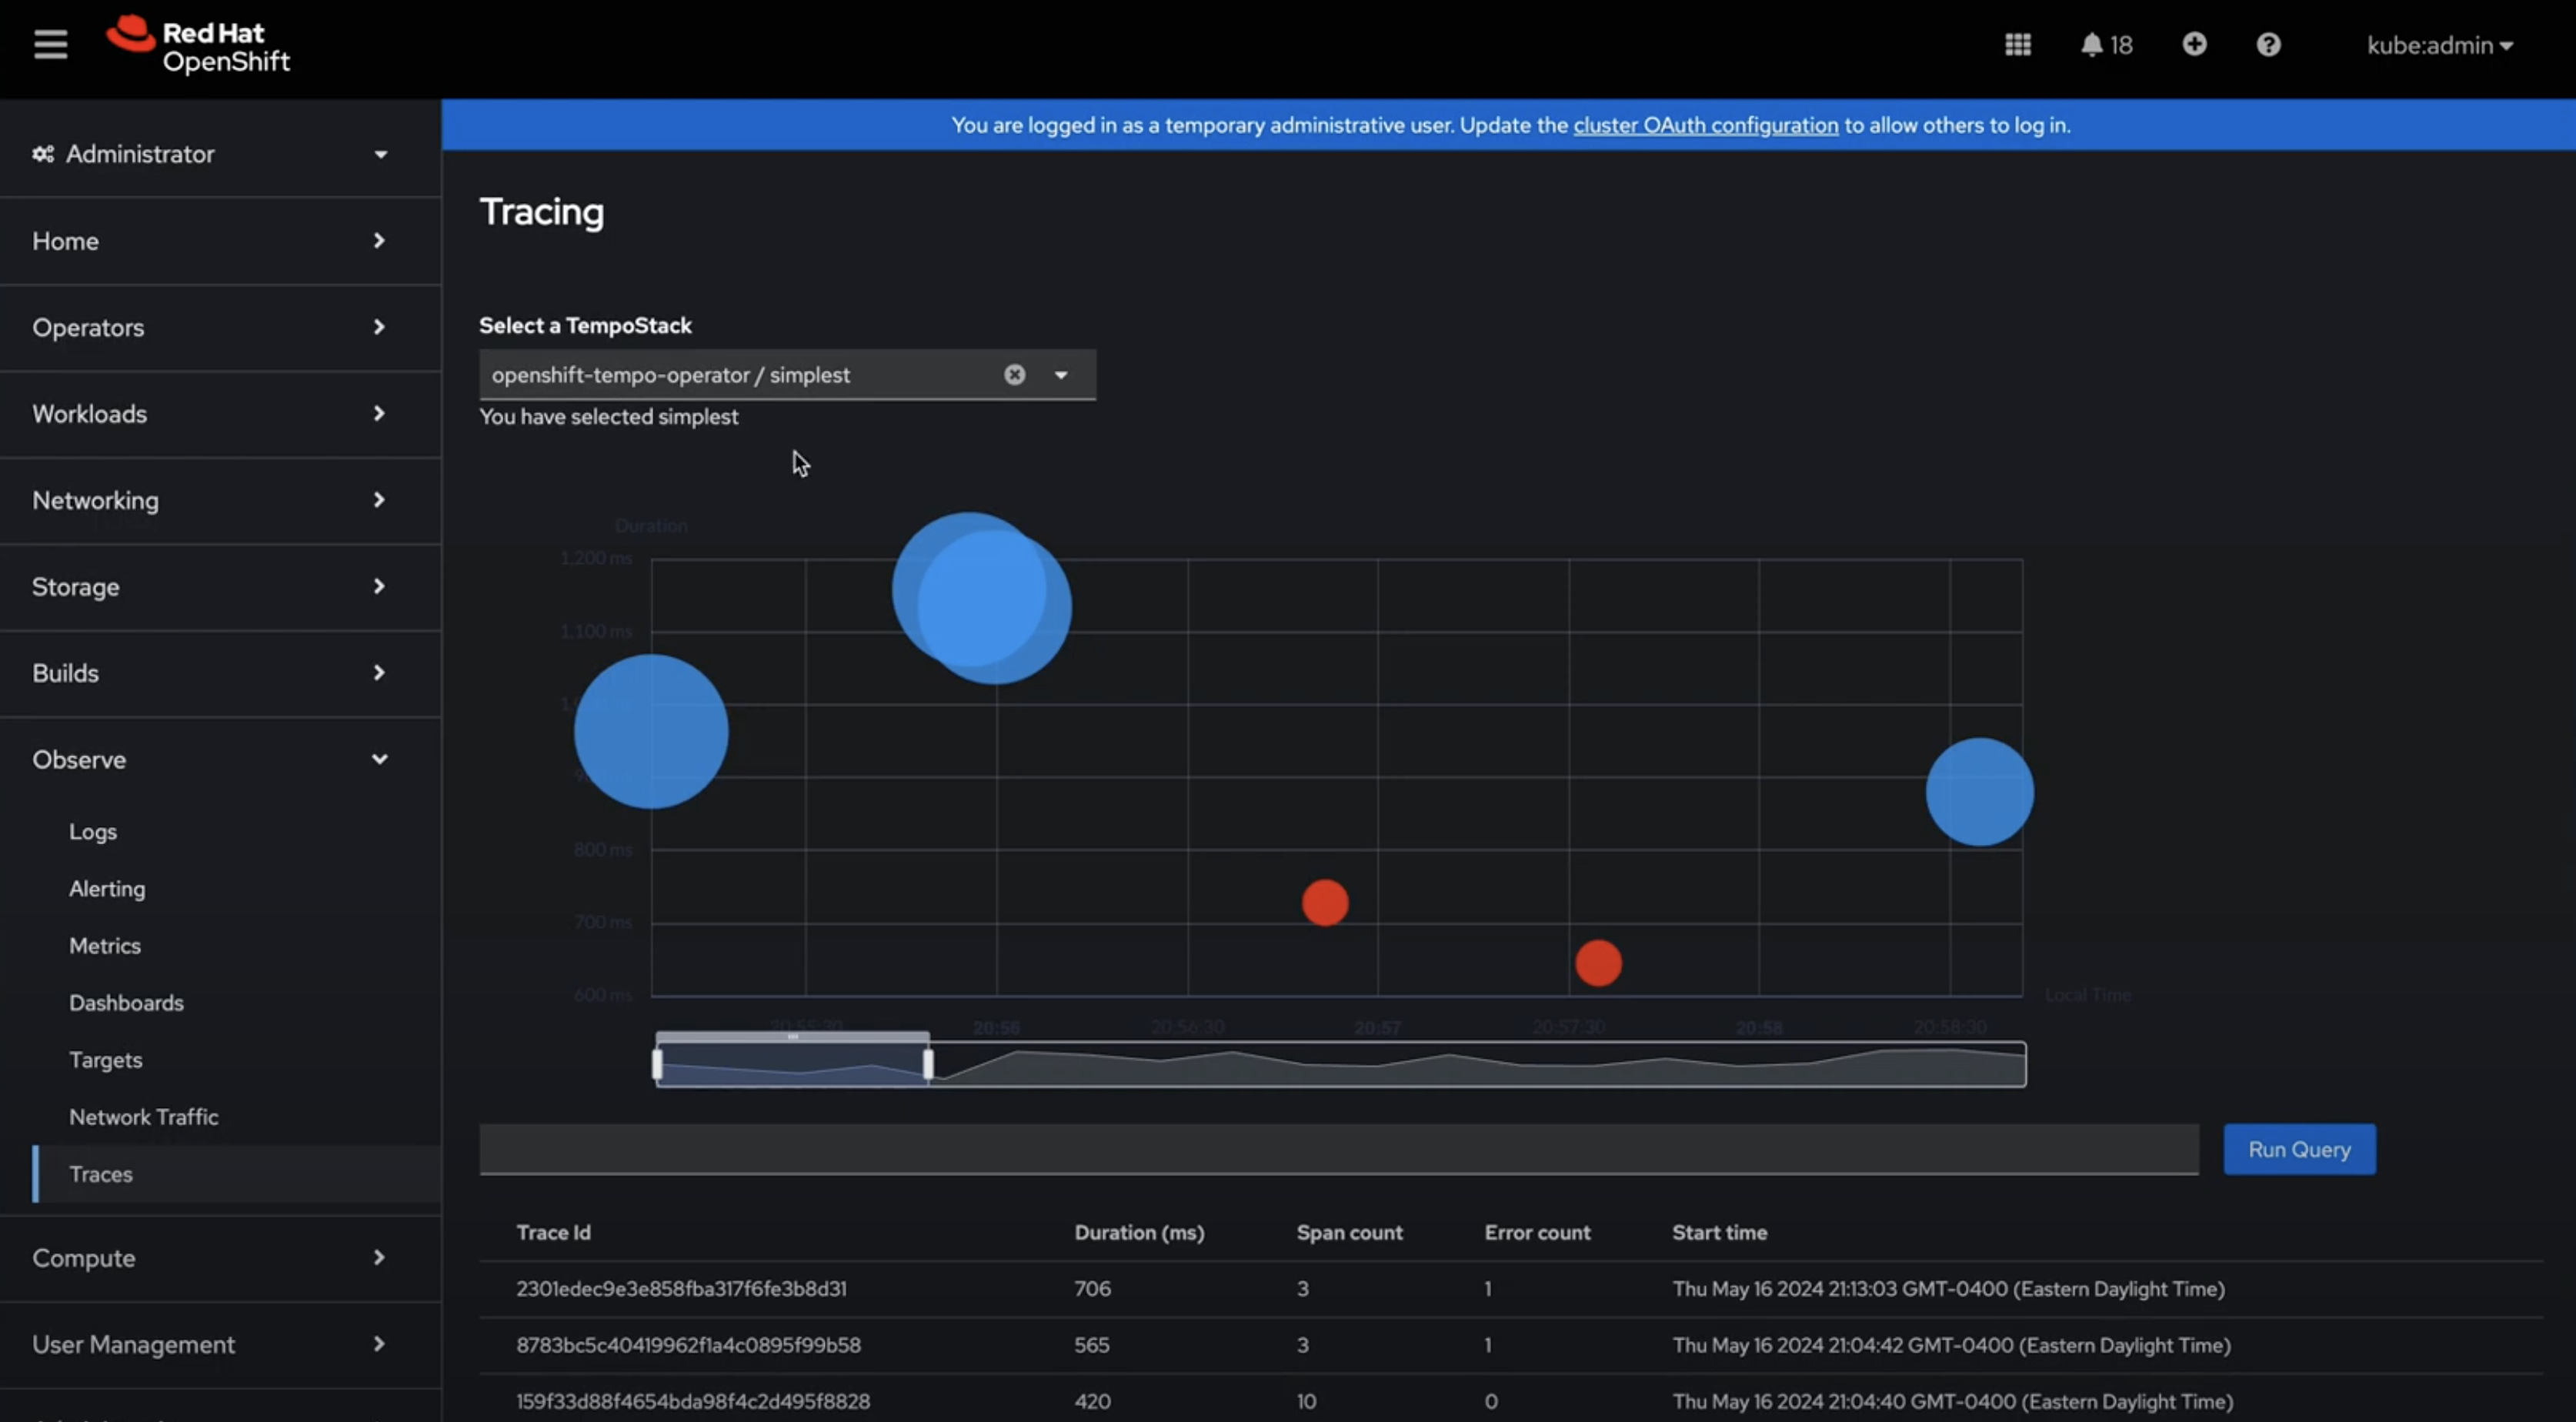
    By refreshing the UI, you will now see the magic: Observe -> Traces UI in the left hand menu is now available! As already mentioned, spans are queried from Tempo. Users can select different TempoStacks by using the dropdown at the top.

    The first visualization capability we are delivering this time is a scatter plot (or bubble chart). In this kind of representation, spans are represented as solid points (or bubbles) in which:

    • The bubble size represents the size of the span.
    • Colour represents status: blue means successful span, and red means that there is an error.
    • The X-axis represents the timeline of when the spans were generated.
    • Position in the Y-axis represents the duration of the spans.

    All in all, current visualization features  include the duration of traces over time, and a table including all key information you need, such as Trace ID, duration, Span count, Error count, and Start time. For more details, see Figure 5. To embed the Scatter Plot displayed below, Red Hat Observability has been contributing to Perses, an upstream project targeting observability visualization needs. Learn more about Perses in the section below.

    Traces UI in the OpenShift web console > Scatter Plot and table.
    Figure 5: Scatter plot and table in Tracing UI.

    Integrating Perses

    Perses is an open source project focused on fulfilling Observability visualization needs. It aims to provide a powerful and flexible tool for creating and managing dashboards from various data sources, now including Prometheus and Tempo. Perses’ heart is its dashboards as code. It is also embeddable in NMP packages and it supports plug-ins, features that make it easier to embed dashboards in your own UI and platform. You can learn more about Perses, its origins and objectives, by watching this presentation.

    Given the great set of benefits stemming from Perses, Red Hat Observability has made the decision to integrate it in the OpenShift web console. Take a look at this video to learn about the reasons why Perses was considered. Based on this context, the Observability group has been working upstream to create a datasource plug-in in Perses UI so that the OpenShift web console and the Observability UI plug-ins can consume traces from the Tempo API, thus enabling the use of the Perses backend. 

    Note that Traces UI users are not required to make use of a Perses operator. The UI includes Perses code, but for making use of the scatter plot and table, no Perses operator is required.

    What’s next?

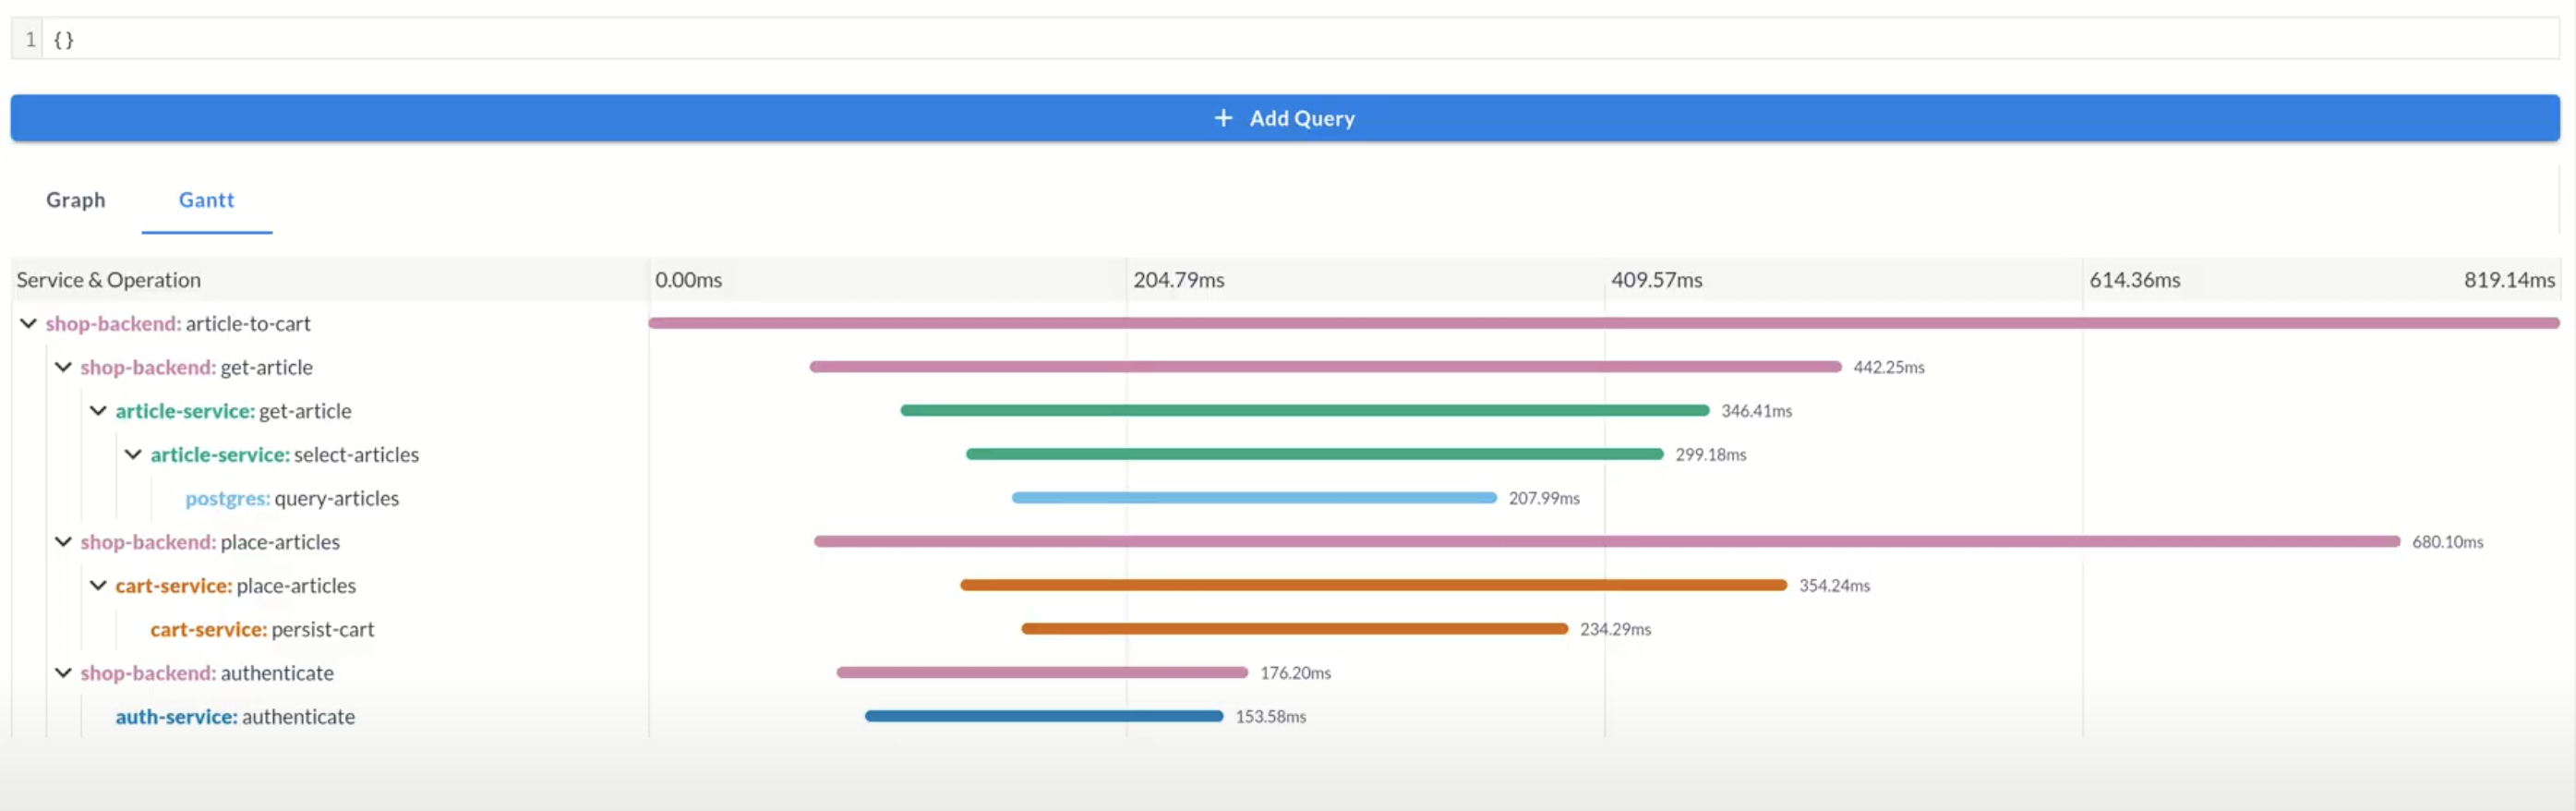
    We are working on releasing a Technology Preview of the Traces UI, which will include a Gantt Chart—key for an optimal traces exploration. Specifically, when clicking on a specific trace, a Gantt Chart will be displayed for further analysis. Red Hat Observability is currently working upstream on a Perses-powered Gantt Chart to bring the best experience and functionality to our users via a centralized, flexible and configurable user interface powered by open source communities. See Figure 6.

    Perses- powered Gantt Chart - work in progress.
    Figure 6: Perses-powered Gantt chart.

    We are looking forward to receiving your feedback and to releasing features that bring the most value to your user experience and data navigation. You can share your questions and recommendations with us using the Red Hat OpenShift feedback form. Stay tuned for more blogs and information!

    Last updated: September 27, 2024

    Related Posts

    • Introduction to microservices observability with Eclipse MicroProfile

    • Building an observability stack for automated performance tests on Kubernetes and OpenShift (part 2)

    • Network observability with eBPF on single node OpenShift

    • Network observability using TCP handshake round-trip time

    • Packet capture using Network Observability eBPF Agent

    Recent Posts

    • How Kafka improves agentic AI

    • How to use service mesh to improve AI model security

    • How to run AI models in cloud development environments

    • How Trilio secures OpenShift virtual machines and containers

    • How to implement observability with Node.js and Llama Stack

    What’s up next?

    Understand four key concepts in Observability in the Quarkus & Observability Cheat Sheet.
     

    Get the cheat sheet
    Red Hat Developers logo LinkedIn YouTube Twitter Facebook

    Products

    • Red Hat Enterprise Linux
    • Red Hat OpenShift
    • Red Hat Ansible Automation Platform

    Build

    • Developer Sandbox
    • Developer Tools
    • Interactive Tutorials
    • API Catalog

    Quicklinks

    • Learning Resources
    • E-books
    • Cheat Sheets
    • Blog
    • Events
    • Newsletter

    Communicate

    • About us
    • Contact sales
    • Find a partner
    • Report a website issue
    • Site Status Dashboard
    • Report a security problem

    RED HAT DEVELOPER

    Build here. Go anywhere.

    We serve the builders. The problem solvers who create careers with code.

    Join us if you’re a developer, software engineer, web designer, front-end designer, UX designer, computer scientist, architect, tester, product manager, project manager or team lead.

    Sign me up

    Red Hat legal and privacy links

    • About Red Hat
    • Jobs
    • Events
    • Locations
    • Contact Red Hat
    • Red Hat Blog
    • Inclusion at Red Hat
    • Cool Stuff Store
    • Red Hat Summit

    Red Hat legal and privacy links

    • Privacy statement
    • Terms of use
    • All policies and guidelines
    • Digital accessibility

    Report a website issue