There are cases in which a Red Hat OpenShift team supporting a central monitoring stack can struggle to fulfill application teams' requests or demands for Prometheus metrics and configuration changes. For instance:
- One department would like metrics retention for a period of 3 months whereas another department requested metrics retention for 6 months.
- One department requested
remote_writesto an external server for metrics matching one pattern and to a different server for metrics matching another pattern. This group changes their requirements every few weeks. - One department uses a Prometheus exporter to dump all their data to Prometheus for easy viewing in Grafana and is overloading the Prometheus server causing it to use many G-bytes of RAM which results in poor Prometheus query response time for other departments.
These scenarios are problematic for teams supporting existing OpenShift User Workload Monitoring. A single ConfigMap user-workload-monitoring-config is used to configure the User Workload Monitoring and the configuration is applicable to all user workload metrics. Only cluster administrators can modify this ConfigMap so there is overhead when departments require unique settings. Furthermore, some settings are global for the entire cluster and cannot be configured for a subset of cluster namespaces. This centralization of configuration can be beneficial in many cases because of its simplicity but in more complex setups and organizations it sometimes doesn’t provide enough flexibility.
OpenShift Cluster Observability Operator
To support more complex scenarios, Red Hat recently announced the Cluster Observability Operator (COO), a new OpenShift Operator designed to manage observability stacks on OpenShift clusters.
COO is now available as a technology preview for all OpenShift users, introducing the Red Hat Observability MonitoringStack custom resource definition (CRD) as an initial feature set, which lets you run highly available monitoring stacks consisting of Prometheus, Alertmanager, and Thanos Querier.
This article provides an example of how to use the Cluster Observability Operator.
COO installation
First, create an OpenShift project named coo-demo for resources in this demo. Run the following:
oc new-project coo-demoWe will use the OpenShift Operator Lifecycle Manager (OLM) to install the Cluster Observability Operator. In the OpenShift Administrator menu, select Operators and then OperatorHub. Search for cluster observability, as shown in Figure 1.
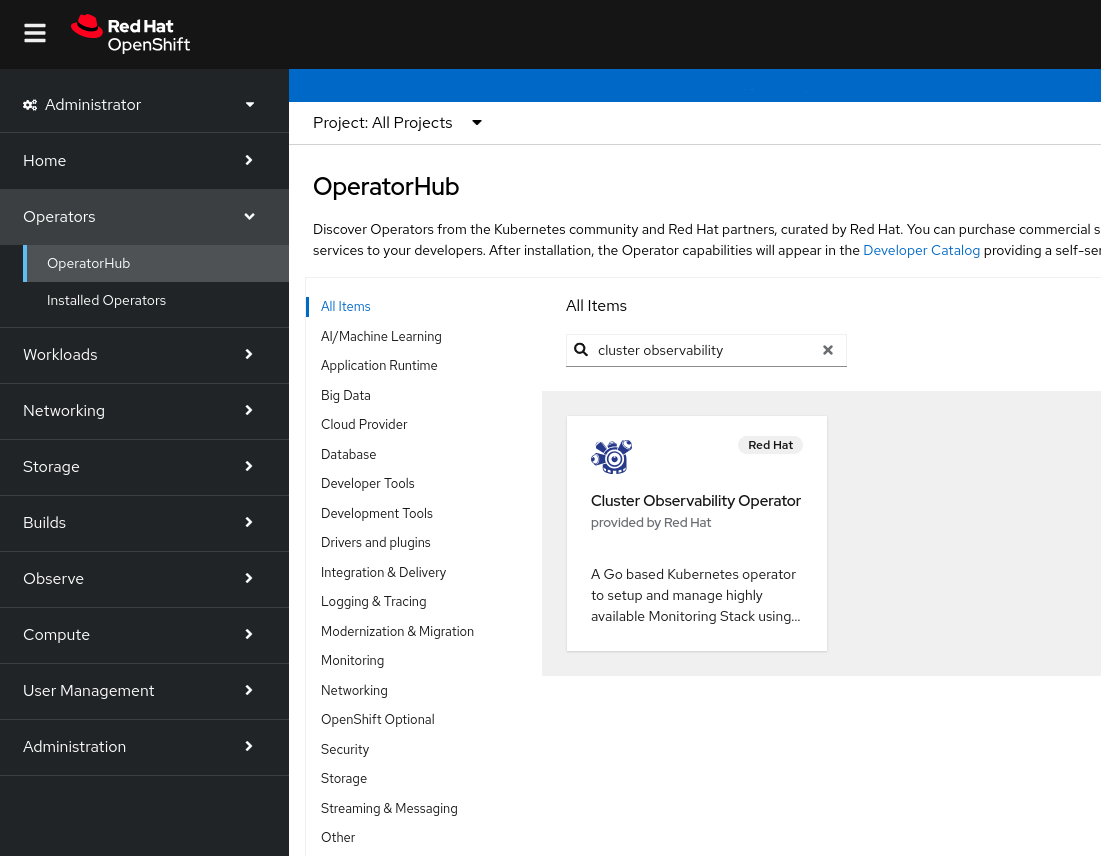
Select the operator and click Install. On the Install Operator page, accept all the default settings and click Install. Wait for the "Installed operator: ready for use" message to appear.
COO instance creation
Use the oc command to create a Red Hat Observability MonitoringStack (the equivalent of a Prometheus stack) using the CR description below. This specifications includes a single replica and will retain metrics for 2 days:
apiVersion: monitoring.rhobs/v1alpha1
kind: MonitoringStack
metadata:
 labels:
   coo: coo-monitoring-stack
 name: coo-monitoring-stack
spec:
 alertmanagerConfig:
   disabled: true
 prometheusConfig:
   replicas: 1
 retention: 2d
 resourceSelector:
   matchLabels:
     monitoredby: coo-monitoring-stack
Additional directives could be used to specify persistent storage. However, that is out of the scope of this demo.
We will create a Red Hat Observability ThanosQuerier instance to gather the data needed to evaluate PromQL queries using the CR description below:
kind: ThanosQuerier
apiVersion: monitoring.rhobs/v1alpha1
metadata:
 name: coo-demo
spec:
 selector:
   matchLabels:
     coo: coo-monitoring-stack
Create an OpenShift Route to the ThanosQuerier by running the following command:
oc expose service thanos-querier-coo-demoDemo application installation
We will now create a Python application that includes a very simple web server. The web server accepts requests to the root URL (/) and returns HTTP 200 (OK). For any other URL, the web service returns an HTTP 404 (not found). In addition, the application includes functions that keep track of the number of HTTP 200 and HTTP 404s returned and make these metrics available for our MonitoringStack to scrape.
Use the following CR description to create a Deployment with the Python application:
apiVersion: apps/v1
kind: Deployment
metadata:
 name: coo-demo
spec:
 replicas: 1
 selector:
   matchLabels:
     app: coo-demo
 template:
   metadata:
     labels:
       app: coo-demo
   spec:
     containers:
     - name: httpserver
       image: registry.access.redhat.com/ubi9/python-311:1
       command:
       - bash
       - -c
       - |2-
         pip install prometheus_client && python - <<EOF
         from http.server import BaseHTTPRequestHandler, HTTPServer
         from prometheus_client import start_http_server, Counter
         class HTTPRequestHandler(BaseHTTPRequestHandler):
           def do_GET(self):
             if self.path == '/':
               self.send_response(200)
               self.end_headers()
               self.wfile.write(b'<html>Hello!</html>\n')
               respCtr.labels(response='200').inc()
             else:
               self.send_error(404)
               respCtr.labels(response='404').inc()
         start_http_server(9000)
         respCtr = Counter('coo_responses','Responses',["response"])
         HTTPServer(("", 8080), HTTPRequestHandler).serve_forever()
         EOF
Create a Service for our Deployment above using the CR description below:
kind: Service
apiVersion: v1
metadata:
 labels:
   app: coo-demo
 name: coo-demo
spec:
 ports:
   - name: http
     port: 8080
   - name: metrics
     port: 9000
 selector:
     app: coo-demo
Create an OpenShift Route to our Python application by running the following command:
oc expose service coo-demoServiceMonitor installation
Create a Red Hat Observability ServiceMonitor to scrape metrics from our application created above using the following CR description. Note that the label key/value pair matches the resourceSelector in the Red Hat Observability MonitoringStack above:
apiVersion: monitoring.rhobs/v1
kind: ServiceMonitor
metadata:
 name: coo-demo
 labels:
   monitoredby: coo-monitoring-stack
spec:
 endpoints:
   - port: metrics
 selector:
   matchLabels:
     app: coo-demo
Wait for the three pods to reach a READY state (your pod names will differ):
$ oc get pods
NAME                                     READY STATUS  RESTARTS AGE
coo-demo-7bc8c649dc-7sww8                1/1   Running 0        3m37s
prometheus-coo-monitoring-stack-0        3/3   Running 0        2m1s
thanos-querier-coo-demo-7654cd6df9-wqbcg 1/1   Running 0        8s
Generate metrics data
Generate valid HTTP requests by running the following several times in a bash shell:
curl http://$(oc get route coo-demo -o jsonpath='{.spec.host}')/The HTML output will include a Hello! message.
Generate invalid HTTP requests by running the following several times in a bash shell:
curl http://$(oc get route coo-demo -o jsonpath='{.spec.host}')/notfoundThe HTML output will include an Error code: 404 message.
Viewing the metrics
Open your browser to the Red Hat Observability ThanosQuerier at the URL generated from the following command:
oc get route thanos-querier-coo-demo -o jsonpath='{"http://"}{.spec.host}{"\n"}'After a minute or two, check the number of requests recorded by entering the following PromQL query in the Expression field of the ThanosQuerier and then pressing Execute:
coo_responses_totalThe output should be similar to the following (Figure 2).
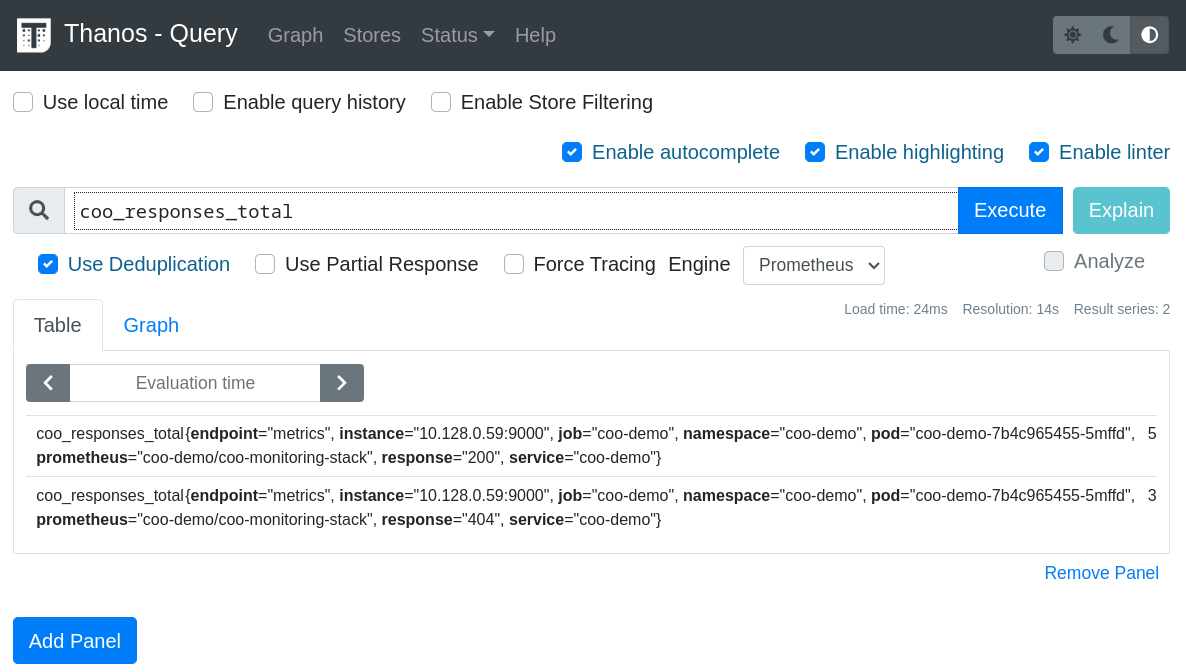
The totals shown for each response should be equal to the number of invocations of the application URLs above.
Summary and outlook
The Red Hat Cluster Observability Operator provides a full monitoring stack that each department in an organization can configure to meet its needs, thereby offloading work from the OpenShift platform support team.
Stay tuned for more great features to land in COO, as monitoring and alerting are just the beginning. Red Hat teams are currently working on integrating logging, distributed tracing, signal correlation, and UI features into COO.
Cleanup
To clean up CRs created in this demo, run the following:
oc delete deployment coo-demo
oc delete service coo-demo
oc delete monitoringstack.monitoring.rhobs coo-monitoring-stack
oc delete servicemonitor.monitoring.rhobs coo-demo
oc delete thanosqueriers.monitoring.rhobs coo-demo
oc delete routes coo-demo thanos-querier-coo-demo