Imagine having a feature that gives you—as a Red Hat Advanced Cluster Management for Kubernetes (RHACM) Cluster Admin—the option to gather feedback on how efficiently developers use namespaces across all your clusters. This information would empower you to adjust resource controls settings and even enforce best practices if needed. In the long term, this would contribute to large cost savings in your organization. That is where RHACM Right Sizing capabilities becomes an asset and helps you achieve this scenario.
RHACM Right Sizing complements other Red Hat features in Insights Advisor and Insights Cost Management that recommend your developers to follow best practices when deploying their workloads in the most efficient way. This way, you will be able to monitor whether the best practices set by your company are followed by the tenants of your clusters.
RHACM Right Sizing vs. Vertical Pod Autoscaler
The Vertical Pod Autoscaler (VPA) can already shed some light on right sizing questions, as it is a tool designed to adjust the resource requests and limits for pods based on their actual usage. Nonetheless, given its pod focus, VPA mainly focuses on developers’ needs and questions. It may help with:
- Dynamic resource allocation: VPA continuously monitors the resource utilization of pods running in a Kubernetes cluster. It collects metrics such as CPU and memory usage.
- Auto-adjustment of resource requests and limits: Based on the collected metrics, VPA adjusts the resource requests and limits of pods dynamically. Resource requests specify the amount of CPU and memory that a pod needs to run, while limits specify the maximum amount of resources that a pod can consume.
- Optimizing resource allocation: By adjusting the resource requests and limits, VPA ensures that each pod receives the resources it needs to perform efficiently without overprovisioning or underprovisioning. Overprovisioning leads to resource wastage, while underprovisioning can result in performance issues or even pod failures.
- Improved cluster efficiency: With VPA, Kubernetes clusters can achieve better resource utilization, leading to cost savings and improved overall efficiency. It helps in rightsizing the pods by aligning their resource requirements with their actual usage patterns.
- Automation: VPA automates the process of rightsizing pods, eliminating the need for manual intervention. This ensures that pods are always provisioned with the appropriate amount of resources, even as workload patterns change over time.
Although VPA offers significant benefits, it also presents a few shortcomings for platform engineering-focused optimizations scenarios, such as its pod-focus and its complex configuration. In order to fill those gaps, our team has worked extensively to enhance the current developer preview experience of RHACM right sizing functionalities.
Enhanced Developer Preview: Everything you need to know
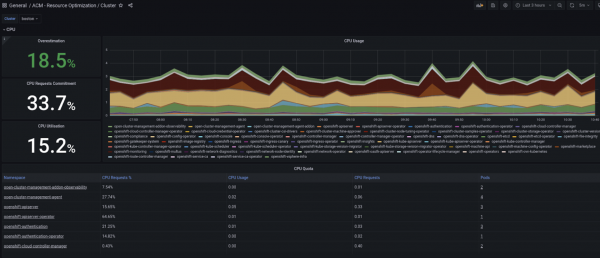
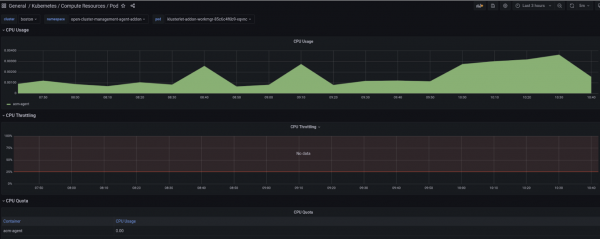
RHACM Observability already provides dashboards that are a great starting point for deep diving into capacity management. They provide predefined and optimized PromQL queries to analyze the existing fleet, with the option to drill down at the container level (see figures below). Those dashboards provide a comparison of actual utilization over the allocation. Nonetheless, they use point-in-time utilization values which do not allow us to identify those underutilized areas as utilization varies over time. Therefore, using values that take into account longer usage trends results to be a game changer.
With this context in mind, last year, the thanos-metric-analyzer tool was made available as a developer preview feature. This solution represents the initial efforts for providing right sizing capabilities to RHACM customers. The tool is able to connect to Thanos endpoints and compute the recommended CPU and memory settings, based on historical usage and resource request. The output of the tool is a CSV file with max usage values and recommendations for CPU and memory utilization. However, as part of the RHACM Right Sizing developer preview, no charts were made available to customers in the RHACM console. Figures 1 and 2 showcase the dashboards in the RHACM console.
Start by selecting the cluster you would like to explore and the relevant aggregation period from the dropdown menus that you find at the top left of the Grafana dashboard. The graph on the right side presents the real time CPU/Memory usage across all namespaces. The graph allows you to select a specific namespace, if needed, and easily detect spikes in CPU/Memory usage. Moreover, thanks to three panels on the left side, you can observe CPU/Memory recommendation and request actual values, as well as utilization in percentage points for your selected cluster and aggregation period. Lastly, the third section of the Grafana dashboards allows you to deep dive into CPU/Memory namespace-level recommendations (CPU/Memory Quota tables in Figures 3 and 4 below).
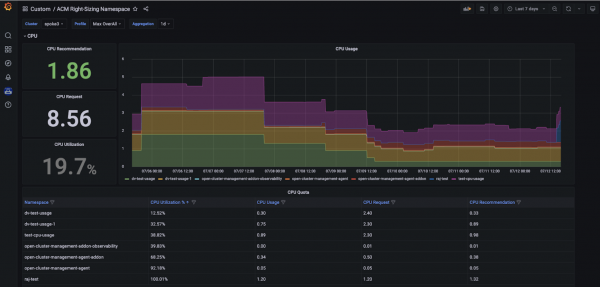
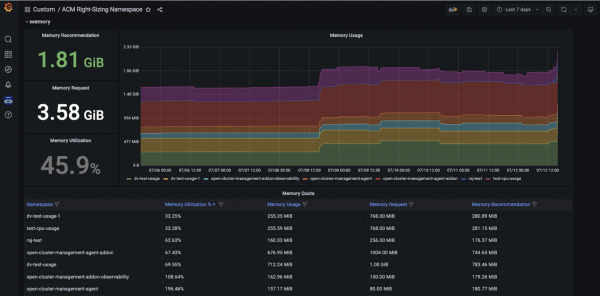
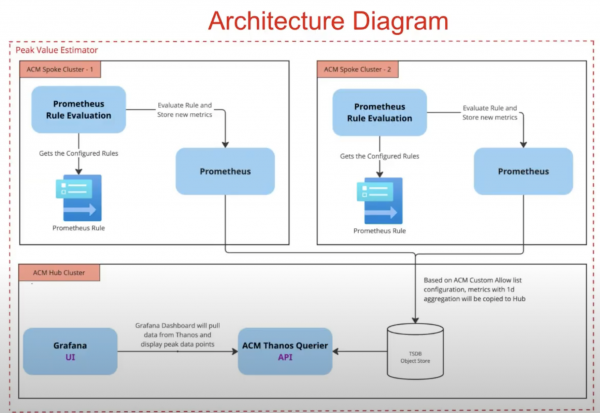
The RHACM Right Sizing recommendations presented above are calculated with the following approach (see Figure 5). Specifically:
- Prometheus Recording Rule—
PrometheusRule—is the engine behind CPU/memory Right Sizing recommendations. The rule can only be used for <=1d aggregation, due to low data retention (15 days). Note that this rule evaluation runs on each RHACM managed cluster. - Records for one day are then forwarded into each RHACM Hub using observability-metrics-custom-allowlist.
- The relevant data is then calculated in Grafana.
Disclaimers
The current enhanced developer preview of RHACM Right Sizing is characterized by the following:
- Prometheus rules are based on Cluster Name, NOT Cluster ID.
- CPU/Memory request, utilization and recommendation are showing max/peak values over the (last) selected number of aggregated days.
- Performance issues may occur while loading the Grafana dashboard.
- Historical data points are not backfilled. This means that after installing the RHACM Right Sizing component, the user/admin needs to wait some time to be able to investigate longer aggregation periods.
- Tested with RHACM 2.10 version.
Installation guide
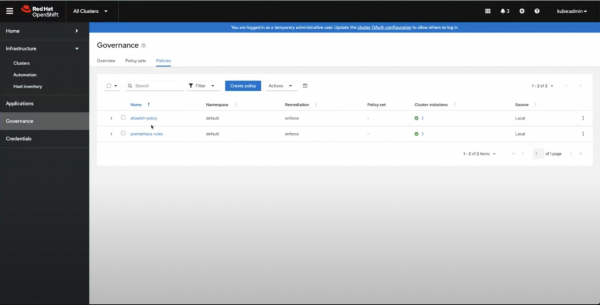
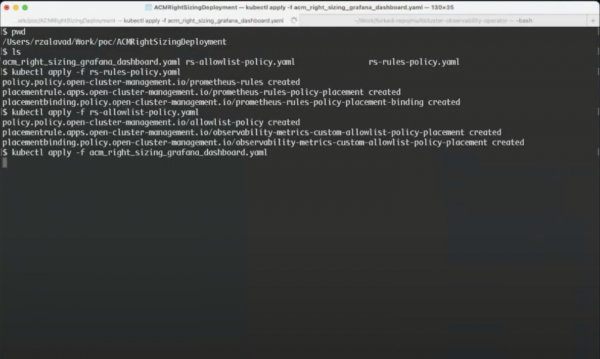
To make use of RHACM Right Sizing functionalities, users need to apply the needed policies into the relevant hub clusters (see Figure 6). Note that when applying the prometheus-rules policy, a Prometheus recording rule is created for each managed cluster. Similarly, when applying the allowlist policy, a relevant ConfigMap will be created for each managed cluster. A detailed overview of the required installation steps (including prerequisites and YAML content) is provided here.
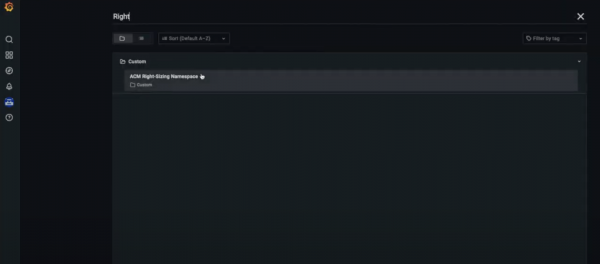
In addition to this, by applying the acm_right_sizing_grafana_dashboard YAML file (see detailed documentation), as shown in Figures 7 and 8, users will be able to access the relevant Grafana dashboards as part of the RHACM console.
Now you are set and ready to start exploring right sizing recommendations, as shown in the section above.
What's next?
RHACM Right Sizing is a great addition to RHACM’s optimizations solutions, targeting platform engineering teams. These namespace-level recommendations enable our customers to easily identify their biggest resource offenders, contributing to a more effective resource control.
Currently, we are working on providing a Technology Preview of RHACM Right Sizing. We value your feedback, which is crucial for enhancing our products. Share your questions and recommendations with us using the Red Hat OpenShift feedback form.
