A brief foray into containerized Java, this article describes the usage and implications of container-aware Java application deployments, and how to use it to your advantage of fully containerized deployments. We also cover the risks of decoupling the heap (off-heap) from the container limits. Finally, we will explain Red Hat OpenShift Container Platform limit settings and specific container-aware troubleshooting tools.
Java is container-aware
When deploying Java inside a container, sometimes we see questions such as:
- Should the user set max heap (Xmx)? What about the initial heap (Xms)? What about MaxRAM?
- Should we set MaxRAM to contain the full size of the memory?
The answer for most of those questions is no—for most use cases. The reason is that Java is container-aware.
This is a great feature that makes deployment easier by allowing the user not to be immediately concerned with the JVM size inside the container.
In fact, despite deploying inside a container, by ignoring or overwriting this feature one may incur not having a fully containerized deployment, which could be an anti-pattern in terms of container deployment. This could lead to scenarios such as cgroups OutOfMemory Kill (OOM-Kill), OutOfMemoryException (OOME), or even underutilization of resources.
We'll provide a thorough explanation of this in the next sections.
Introduction to Java container awareness
Container awareness means OpenJDK detects when it is running inside a container (via cgroups detection) and shapes its behavior to better operate within the container’s boundaries in terms of CPU and memory. This impacts not only how the OpenJDK sets its initial/max heap boundaries, but also threads settings, and the runtime garbage collector, as a consequence of being aware that it is running in a container.
In a nutshell, when the container starts and kicks the entry-point scripts the Java application is started inside the image, the initial script that deploys Java calculates the Xmx and Xms as a percentage of the container size and calculates the threads from the CPU details on the cgroup of the container providing container-awareness.
Throughout this article, we'll be referring to Red Hat build of OpenJDK containers specifically. For the purpose of this article, this means the OpenJDK containers as available in the Red Hat Ecosystem Catalog only. Also, the contents below might not be applicable even for images layering on top of Red Hat build of OpenJDK images.
Background in container awareness
In version JDK 8u191+, the JDK code introduced a streamlined cgroups container awareness feature. So as of 2018/2019, Java enabled container-aware feature, meaning that it detects the cgroups limit and uses that, in terms of CPU and memory, which for Java means setting up the heap and off-heap without explicitly setting Xmx flags. Thus, currently, Red Hat build of OpenJDK is started with a script (e.g. run-java.sh)that detects the cgroups from that pod it is running and sets the MaxRAMPercentage/InitialRAMPercentage as a percentage of the container for 50% or 80%. Thus, making the heap a percentage of the container size.
However, before that version, although there were some attempts, the JVM was not fully container-aware running inside a container. This means that previously, users needed to set those values manually, which would sometimes lead to mistakes and discrepancies, such as creating a JVM with 100 GB of heap/off-heap running in a container with 1 GB total size.
This means the JVM wouldn’t detect inside a container and would use OpenShift Container Platform (OCP) node limits instead.
Thus usage of non-container-aware Java can lead to memory settings decoupled from the container size.
These scenarios of decoupling between the size of the container and the Xmx (heap size) most often would result in:
cgroups OutOfMemory killer (cgroups OOM-Kill), where kernel's cgroups terminates a Java application that had crossed the memory boundaries inside a container. Those cgroups OOMKills won't be triggered by OCP events and deploying several non-container-aware applications in the same OCP node can result in a crash of the node or a panic state. Here is an example of cgroups OOMKill inside a sosreport:
Sosreport: sosreport-file Feb 29 00:37:01 example kernel: Memory cgroup out of memory: Killed process 19710321 (java) total-vm:3_109_804kB, anon-rss:95_480kB, file-rss:19920kB, shmem-rss:0kB, UID:1000940000 pgtables:548kB oom_score_adj:-997- An OutOfMemoryException (OOME), where Java has an inadequate heap size—i.e., it was deployed via Xmx with a smaller size than what it needed, even though the container size is much larger.
- Decreased efficiency, where Java uses much less space in total than the container size, so the container space is left without usage.
- Latency problems due to resource constraints set by Xmx (heap size) or inadequate threads settings, despite the fact the container has adequate resources, of which Java isn’t aware. Also, latencies can cause pod restarts in case the probes' thresholds are crossed.
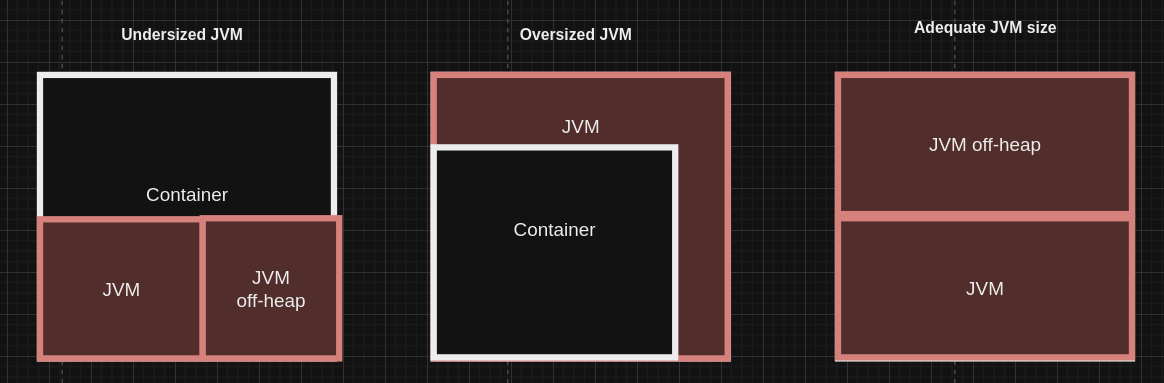
On the other hand, this decoupling is prevented in container-aware versions because the Red Hat build of OpenJDK starts and deduces the CPU container and memory size. The Xmx(max heap size)/Xms (min heap size) will be set from the container size limits—a percentage of the container, usually 50% of the container is set to the heap size. And newer OpenJDK images are bringing 80% of the container as heap size. This is depicted in Figure 1.
The Java application must be started with java-run.sh which sets the percentages for the 50% (or newer images 80%) for the heap. Otherwise, the default will be 25% of the container size. In other words:
- If the Java application is started using
run-java.shscript it will setMaxRAMPercentageas 50% of the container size as heap, whereas newer images will bring 80% of the container as the heap size. - If the Java application is just deployed inside the image, then it will detect the container limit and use the OpenJDK default of
MaxRAMPercentagewhich is 25% of the container.
To verify this see the application logs (container logs) will have the following line:
Starting the Java application using /opt/jboss/container/java/run/run-java.sh ...Note above is true for Red Hat’s OpenJDK containers, but may not be valid for generic OpenJDK-based container images like Eclipse Temurin containers or other OpenJDK-derived container images.
Comparing Java container-aware versus Java not container-aware
Oracle’s Java 8u191 has been modified to be container-aware, via JDK-8146115. This feature builds upon the previous attempt to enable container awareness.
Java will be able to detect from the cgroups files the following:
- Container memory limit
- Number of CPUs available in the container
Therefore, from the user's perspective:
- The CPU settings will be automatically deducted from the deployment's limit.
- The heap allocation is deduced from MaxRAMPercentage , which already comes by default in OpenJDK images at 50% heap (or 80% heap).
- There is no need to set Xmx, Xms, or even MaxRAM directly.
The differences are shown in Table 1.
| Java container aware (after 8u191+) | Java not container-aware (before 8u191) |
|---|---|
Users can and should set the container size on the deployment YAML. Users set the container CPU on the deployment YAML: | Users should set MaxRAM and Xmx*. Java will use the OCP node limits or else you need to set the threads manually: |
| Java application and container coupled | Java application and container decoupled |
| Java will have a CPU deduced from the container limits. | Java won’t have CPU deduced from the container, but from OCP node limits. |
| Java will have memory deduced from the container via cgroups. | Java won’t have memory deduced from container size. |
In a nutshell, we have a Xmx < MaxRAM <= container memory limit, as shown in Figure 2.
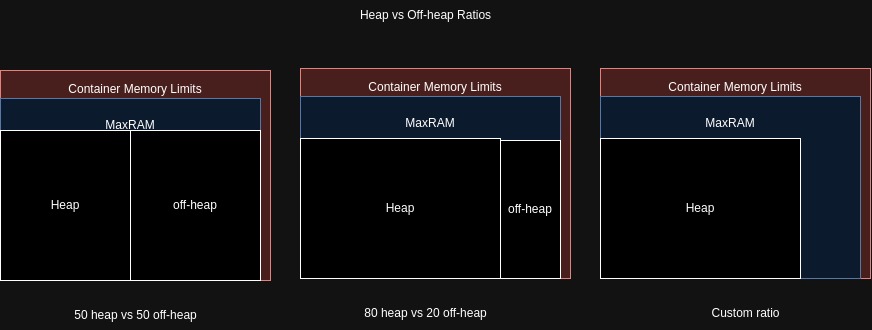
Note that:
- MaxRAM specifies the JVMs notion of "total physical memory" to use, heap, and off-heap.
- Xmx specifies the heap size.
- Off-heap space is the remaining
* MaxRAM and MaxRAMPercentage can be used as well. The portion between MaxRAM and Xmx (MaxRAM - Xmx) is to be used for non-heap memory, like code cache, thread stacks, metaspace, GC collector code.
Specific example
To see the behavior comparison, let's use the deployment YAMLs above (see Table 1):
containers:
  - name: app
    Image: ubi8-openjdk17/example
    resources:
      requests:
        memory: 2Gb
        cpu: 2
      limits:
        memory: 4Gb
        cpu: 4
In an OCP 4 node with 40GB of memory and 32 CPU cores, in which those containers would get scheduled to run. See the comparison below:
- For container-aware Java (with a container-aware JVM): you'd see the JVM use at most 2 cores (affecting thread pools) and 2GB of memory for heap and off-heap combined (regardless of the host size, as long as it's providing >=2GB of memory and >=2 CPU cores).
- For non-container-aware Java: With a limit of 2 CPUs and 2Gb of memory and a container-unaware JVM, the
-Xmxsetting would restrict the Java heap to 1GB, but would leave around ~39 GB to use for off-heap memory. Similarly, up to 32 cores would be available to the JVM (which likely also affects the sizing of thread pools and thus memory consumption).
Finally, the example above can be used not just to show Java will abide by the CPU resource limits instead of not CPU requests, but that MaxRAMPercentage is set for 50% of the container size, so the heap will be 50% of the container limit, in this case 2Gb.
Container awareness implications and tuning
Given the explanation of the concepts and comparison with previous versions, let's do a deep dive into the implications of this feature.
First and foremost from the middleware perspective, the usage of a container aware causes a coupling (correlation) between two variables: the container size and the JVM size. The user now only needs to define the container limits—not the JVM settings—and the JVM will nominally define and abide by those limits, thus coupled.
As a comparison, as explained, using non-container awareness causes a decoupling between the Java application size and the container size. This decoupling implies that every time the container size is changed, the heap size needs to be adjusted accordingly. Therefore, each value needs to be set separately: Xmx and container size.
Regarding tuning: It is important to note that if the user sets the Xmx on a container-aware Java, the default calculated heap size (Xmx/Xms) is overwritten, which may lead to an underutilized container that is not matched with the limit values for the deployment or over-utilized container JVM, later may causing OOM-kills and OOM Exceptions.
In order to override the heap size while still keeping it coupled, it is recommended to customize the -XX:MaxRAMPercentage=N instead of Xmx, because that makes the JVM set the MaxHeapSize relative to the container memory limit. Evidently, InitialRAMPercentage and MinRAMPercentage can be set accordingly.
By setting the heap percentage, naturally, the off-heap usage will be deduced as the remaining space and should not be ignored, which can include metaspace, threads, GC collector (the collector itself), modules loading (JDK 11 and JDK 17), shared libraries, and more. Off-heap is not infrequently used by applications such as Netty, Data Grid, or AMQ queues.
Before tuning those values (i.e., changing the MaxRAMPercentage), considering benchmarking the application thoroughly, otherwise leaving not enough space for native will result in cgroups OOMKill as well.
Finally, note that if MaxRAM is set, then that acts as the authoritative source of "Container total memory" or "Physical memory on any machine," provided it's less than the node has as actual physical memory. So if you don't specify MaxRAM, the JVM will deduce by looking at container values (via cgroups ) or the physical machine value. Given the container detection feature, we usually do not recommend MaxRAM usage anymore because that could decouple the heap vs container size, which was the case when the JVM was not container-aware for example.
OpenShift Container Platform limits versus requests
Because the container limits are so important as detailed above, it is of utmost importance to clarify what limits versus requests are for the OCP, kernel, and Java layers, given that each layer only considers certain aspects.
See each perspective when the user defines the container spec limits and requests (e.g., via deployment YAML):
(a) From the OCP 4's perspective, the container defined via YAML provides the specification for resource limit and request, which is used to delimit the CPU quota and period. Not declaring those values implies that Kubelet assigns default ones. Kubernetes scheduler takes into account requests settings, whereas limits are not taken into consideration. The concept of a request is exclusive to Kubernetes and gets translated into kernel’s cgroup and filesystem values with quotas and periods.
The definitions are shown in Table 2.
| Container setting | Purpose | Calculation |
|---|---|---|
| CPU request | Used by Kubelet for scheduling purposes to assign a certain container to a node. | Requests set cpu.share to break the usage of the main cgroups allocation. |
| CPU limits | Used as the binding allocation. CPU limits means time period of execution. | Limits set the quota of usage, which is based on time period and defaults to segments of 100ms. |
(b) From the kernel perspective, this is translated into quotas and periods by Kubelet upon the pod creation so for the kernel’s scheduler’s behavior, the number of threads is what matters for allocating tasks. For the kernel what will be relevant is: the threads to execute the process, i.e., the number of schedulable entities in a certain period. Note the type of CPU can also play a role in the number of threads. The kernel provides cgroups API in two versions: cgroups v1 and cgroups v2, both can present requests and limits values for applications.
(c) From the JVM perspective, OpenJDK JVM reads the cgroups in the containers and sets the memory and number of threads from the deployment spec limits (deployment YAML), not the requests. This value will be used for any thread pooling calculation that depends on the CPUs. Java will only take into consideration deployment limits.
Although older images use cgroupsv1, the latest Java image versions should use cgroups v2, but regardless they will always only abide by the deployment limits.
Given that for the Red Hat OpenJDK's JVM only limits are taken into consideration, i.e., CPU requests won’t be used by Java for any internal calculation. So in as much as the user can set in the pod definitions, the concept of quota and period, from Java's perspective only the CPU’s limits will matter, not requests for example. Although Java has a burstable workload, in the sense that dynamically the threads can demand more or less kernel time, the cgroups reading will be done at start-time, not dynamically, which makes Java inelastic (see details below).
Is Java elastic or inelastic?
Segue from the discussion on cgroups and limits above, one might wonder if the values set up during the bootstrap of the JVM can be altered or if they will be the same throughout the running of the application.
In a simplified matter, Java is inelastic from the CPU perspective and memory perspective, where Java uses the kernel's cgroups limits to detect the number of cores at startup. The CPU quota and period are determined by the pod's request and limits that are translated into cgroups' filesystem values.
In summary:
- The Red Hat's OpenJDK is container-aware and will abide by the CPU limits.
- Requests are a Kubernetes concept that is used by the scheduler and not by kubelet or Java, which uses only the CPU limits.
- MaxRAMPercentage comes set by default at OpenJDK images at 50% heap/50% off-heap (older images) or 80% heap/20% off-heap (latest images) when Java is started using
run-java.sh, which is true for most of our images. - Not using the script
run-java.shto start the application will result in OpenJDK's default of 25% of the container size for the heap. - Not using container limits will make the container limit to the OCP node itself, so the percentage of the memory used for the heap will be a percentage of the OCP node memory limit. Same with CPU calculations.
- The heap value is defined and cannot be changed on the fly after the JVM starts and won't increase or decrease unless you redeploy the container with new values.
- The number of garbage collection (GC) threads won't change dynamically either, and must also be defined/calculated at startup. Needless to say, the number of threads that are spawned from thread pools can fluctuate.
- Images that are built on top of OpenJDK should use
run-java.shby default but they may overwrite the behavior/percentages. For example by not starting Java viarun-java.sh, therefore using OpenJDK's default 25% of the container size.
This means for Red Hat's middleware products (e.g., Red Hat JBoss Enterprise Application Platform, Red Hat Data Grid, and most Java applications), the JVM behavior is inelastic.
Naturally, the explanation above is a simplification by a long margin because Java itself is mutable and elastic, i.e., it can dynamically change its behavior where broadly speaking in terms of complexity the JVM process is composed of many subsystems. The subsystem responsible for reading container limit values will pick up updated values (only provided it gets repeatedly called).
For example, the GC threads are inelastic, so JVM will do its sizing based on the properties it sees for physical memory at boot time, by detecting the cgroups settings.
Therefore for all intents and purposes on most middleware, JVM is inelastic. So the number of GC threads won’t fluctuate in time, leading to stability/performance issues within your application workloads.
Three additional aspects that are complementary to the discussion above:
- The Quality of Service (QoS) won't prevent a pod from being killed by cgroups even if it is set as Guaranteed QoS (see details below).
- The pod limits and requests are static values. Until Kubernetes 1.17 the spec container requests and limits were static values, so they didn’t change. Then upstream Kubernetes 1.27 (OCP 4.4+) introduces an alpha feature called resize, which makes requests and limits change without a container restart.
- The JVM can detect changes in the pods on the fly but detection is not the same as changing its behavior. For all intents and purposes, Red Hat’s OpenJDK considers the CPU/memory values at startup, and everything else is derived from those values (including the heap size). If the value changes with an update to cgroups file, the JVM will see it, but if it's no longer the same as was used at startup it's undefined how the JVM will behave.
Quality of Service (QoS) values
Although the Quality of Service of a pod can be used to prevent evictions, it won't prevent cgroups kills due to lack of resources. And therefore won't avoid issues with decoupling scenarios.
The Quality of Service (QoS) values can be adjusted according to the workload's criticality to prevent eviction and make fully usage of the CPU and memory settings.
For instance, Guaranteed QoS can reduce the likelihood of overcommitted nodes, and a more reliable scheduling of essential service applications avoiding outages by preventing the killing of a certain pod.
The Quality of Service definitions are as follows:
Guaranteed: Memory and CPU request and limits defined and matchBurstable: Memory and CPU request and limits defined do not matchBestEffort: No memory and CPU request and limits defined.
Evidently, depending on OCP cluster availability and other applications, it can be beneficial not to have all deployments as Guaranteed QoS allowing a more flexible/burstable scheduling deployment of pods per node. However, most applications rarely will use a high number of CPUs throughout the day and spike only sporadically.
However, for particularly critical workloads, Red Hat may recommend deploying them as "Guaranteed" QoS, but taking into consideration that using Guaranteed QoS might be overkill for less critical applications and won't prevent cgroups OutOfMemoryKills from finishing the container.
For more information on overcommitting resources, refer to the OpenShift 4.14 documentation.
Tools and outputs
Finally, in terms of tools for investigations, which tools can be useful for container-aware investigation?
Outputs that are not container-aware will return the OCP node information, such as:
lscpunproc(number of CPUs)free -m(show the amount of memory on the node)- Verify the pod logs to see if
run-java.shis being used or 25% default's OpenJDK is used - From the heap size used it is possible to verify if the container limits are being set or if the OCP Node is being used
Outputs that are container-aware will return the specific container information, such as:
VM.info--XshowSettings:system
The next section lists a few outputs that are container-aware and not container-aware.
Outputs that are not container-aware
In as much as the user could execute some command inside the container, they are not necessarily container-aware and might return the OCP node values instead of the container limits.
lscpu
lscpu shows the OCP node values (where the container runs), and it isn’t a container-aware output:
[root@rhel8tester ~]# lscpu
Architecture:        x86_64
CPU op-mode(s):      32-bit, 64-bit
Byte Order:          Little Endian
CPU(s):              2 <------------------- that's the number of cpus from the Node
On-line CPU(s) list: 0,1
Thread(s) per core:  1
Core(s) per socket:  1
Socket(s):           2
NUMA node(s):        1
Outputs that are container-aware
Use VM.info to collect information from Java deployed inside a container, it will bring a large amount of useful information: gc settings, exceptions, native allocation, and VM details.
Example of VM.info cgroups section—therefore container aware:
container (cgroup) information:
    container_type: cgroupv1 <------------- cgroups version
    cpu_cpuset_cpus: 0-127
    cpu_memory_nodes: 0-7
    active_processor_count: 1 <------------ active processor
    cpu_quota: -1 <------------------------ no quota limit
    cpu_period: 100000 <------------------- cpu period set for 100000
    cpu_shares: 51 <----------------------- cpu shares for 51
    memory_limit_in_bytes: 536870912
    memory_and_swap_limit_in_bytes: 536870912
    memory_soft_limit_in_bytes: -1 <------- soft limit
    memory_usage_in_bytes: 125108224
memory_max_usage_in_bytes: 126193664-XshowSettings:system: This setting can be used to see the detected container limits.
Conclusion
After versions JDK 8u191+, there is indeed a paradigm shift where the Java applications are container-aware, meaning the JVM can detect container limits and impose those limits. This is a great feature when doing a deployment inside OCP 4 using Red Hat’s OpenJDK images and associated images.
If before the user needed to manually set Xmx/Xmx for heap settings, that’s not the case anymore: container size and JVM settings are coupled, thanks to the JVM reading the cgroups' limits in the pods. Therefore users can set now percentages of container for the heap (and consequently off-heap) and avoid situations of decoupling. Some scenarios of decoupling are explained in this article as well and can be avoided using adequate MaxRAMPercentage settings. Red Hat's OpenJDK Java initialization scripts run-java.sh provide a larger usage of the container for the heap vs off-heap.
A one-by-one comparison of container-aware and non-container-aware applications, including Xmx and MaxRAM implications/recommendations is explained. Given the heap is now a percentage of the container, the off-heap usage needs to be considered when allocating the heap size via percentage, where off-heap should also be considered when customizing the percentages.
Despite being very useful, OCP settings such as QoS will not prevent decoupling scenarios such as cgroups OOMKills from happening. This gives more importance to benchmarking the application's usage to verify the adequate ratio heap vs off-heap and avoid issues, such as not allocating enough off-heap, which can lead to cgroups OOMKills as well.
Finally, we discuss tools that can be used for more details on containers and others that are not container-aware, including limits, Kubernetes’ requests, and cgroups details and implications for Java.
All things considered, this article is very relevant for Java applications migrating to container or DevOps teams aiming to take advantage of container-aware features. Ultimately, container-aware features simplify the development and operation of applications and provide one less worry when doing a Java deployment.
Additional resources
To learn more, read Java 17: What’s new in OpenJDK's container awareness.
For any other specific inquiries, please open a case with Red Hat support. Our global team of experts can help you with any issues.
Special thanks to Severin Gehwolf, Rob Manes, Will Russell, and Alexander Barbosa for their quintessential contributions and outstanding review of this article.
Last updated: September 20, 2024