Open vSwitch (OVS), which many data centers run on Linux systems for advanced networking functions, adds a certain amount of overhead for new datapath flows. This article introduces the upcall_cost.py script, written in Python, which tracks packets through the kernel's invocation of OVS and displays statistics that can help with troubleshooting performance in applications and data centers, as well as the kernel and OVS itself.
My interest in this question was triggered when some people argued that it takes too long for the kernel module to bring a packet to the ovs-vswitchd in userspace to do the lookup. However, I have not seen anyone backing up this complaint with data. This article offers tools that can help research this question and many others. I'll describe the script and its output, then show data from two interesting scenarios: A 16-node Red Hat OpenShift cluster and a lab benchmark.
The upcall_cost.py script
Up till now, there was no easy way to measure the overhead introduced by the OVS kernel module, whose tasks include sending packets to the ovs-vswitchd user space daemon for the OpenFlow lookup, programming the kernel datapath flow, and re-inserting the packets for forwarding. The upcall_cost.py script was introduced as part of an OVS patch series and demoed as part of the 2021 OVS conference presentation titled Debugging OVS using static tracepoints.
But just having a script to get these statistics does not make capturing and analyzing this data straightforward. Every environment and use case is different and hence might give different results. Later on, we will discuss some data based on a 16-cluster Red Hat OpenShift setup emulating a customer environment.
Running the upcall_cost.py script
I've devoted a section of this article to explaining how to run the script, because several of the options are important.
Make sure that, along with downloading the script, you have installed all the required Python modules. See the script's header for the requirements.
The script queries the configured OVS ports only at startup. So if you have a dynamic environment, you might need to modify the script or make sure all ports are configured before starting the script.
Executing the script with the --help option shows all the available options:
# ./upcall_cost.py --help
usage: upcall_cost.py [-h] [-b BUCKETS] [--buffer-page-count NUMBER]
                      [-D [DEBUG]] [-f [64-2048]] [--handler-filter HANDLERS]
                      [-P [64-2048]] [-p VSWITCHD_PID] [-q] [-r FILE] [--sets]
                      [-s EVENTS] [-w FILE]

optional arguments:
  -h, --help            show this help message and exit
  -b BUCKETS, --histogram-buckets BUCKETS
                        Number of buckets per histogram, default 20
  --buffer-page-count NUMBER
                        Number of BPF ring buffer pages, default 1024
  -D [DEBUG], --debug [DEBUG]
                        Enable eBPF debugging
  -f [64-2048], --flow-key-size [64-2048]
                        Set maximum flow key size to capture, default 64
  --handler-filter HANDLERS
                        Post processing handler thread filter
  -P [64-2048], --packet-size [64-2048]
                        Set maximum packet size to capture, default 256
  -p VSWITCHD_PID, --pid VSWITCHD_PID
                        ovs-vswitch's PID
  -q, --quiet           Do not show individual events
  -r FILE, --read-events FILE
                        Read events from FILE instead of installing
                        tracepoints
  --sets                Dump content of data sets
  -s EVENTS, --stop EVENTS
                        Stop after receiving EVENTS number of trace events
  -w FILE, --write-events FILE
                        Write events to FILE
Although the defaults are fine for most options, a few are worth discussing here.
First, I recommend running the script with the --write-events or -w option to save a copy of the trace information. This output can be used later to analyze the results.
Initially, you might want to see all the output, but it could be voluminous and introduce a delay. Therefore, after you have verified that events are coming in, I suggest running the command with the --quiet or -q option.
To make sure you don't miss any trace events, your BPF ring buffer needs to be configured to be large enough to keep the events. The following example shows that the default configured size of 1,024 pages is not big enough. This problem is indicated by the WARNING message as well as the counts in square brackets further down in the output showing how many events were missed:
# ./upcall_cost.py -q
- Compiling eBPF programs...
- Capturing events [Press ^C to stop]...
^C
- Analyzing results (35486 events)...

WARNING: Not all events were captured!
         Increase the BPF ring buffer size with the --buffer-page-count option.

=> Events received per type (usable/total) [missed events]:
  dpif_netlink_operate__op_flow_execute :       4009/      4009 [     45988]
  dpif_netlink_operate__op_flow_put     :         16/        16 [       112]
  dpif_recv__recv_upcall                :       7068/      7068 [     42928]
  ktrace__ovs_packet_cmd_execute        :       7581/      7581 [     42416]
  openvswitch__dp_upcall                :      16812/     16812 [    189917]
...
If you are losing events, increase the number of pages using the --buffer-page-count option until you no longer see the WARNING:
# ./upcall_cost.py -q --buffer-page-count 16385
- Compiling eBPF programs...
- Capturing events [Press ^C to stop]...
^C
- Analyzing results (151493 events)...

=> Events received per type (usable/total) [missed events]:
  dpif_netlink_operate__op_flow_execute :      31618/     31618 [         0]
  dpif_netlink_operate__op_flow_put     :        256/       256 [         0]
  dpif_recv__recv_upcall                :      31618/     31618 [         0]
  ktrace__ovs_packet_cmd_execute        :      31618/     31618 [         0]
  openvswitch__dp_upcall                :      56383/     56383 [         0]
...
What does the upcall_cost.py output mean?
To show upcall_cost.py in action, this section runs the script when 10 packets arrive at wire speed with incrementing source and destination IPv4 addresses. These packets will create 10 upcalls, where each will install a new datapath flow. The following example omits the --quiet option.
The initial output is:
$ ./upcall_cost.py
- Compiling eBPF programs...
- Capturing events [Press ^C to stop]...

EVENT                    COMM                  PID  CPU  TIME                EVENT DATA[dpif_name/dp_port/pkt_len/pkt_frag_len]
[openvswitch__dp_upcall] swapper/8               0 [008]  1802346.842674263: ovs-system           2   60    0
[openvswitch__dp_upcall] swapper/24              0 [024]  1802346.842674671: ovs-system           2   60    0
[openvswitch__dp_upcall] swapper/22              0 [022]  1802346.842674792: ovs-system           2   60    0
[openvswitch__dp_upcall] swapper/13              0 [013]  1802346.842674989: ovs-system           2   60    0
[openvswitch__dp_upcall] swapper/0               0 [000]  1802346.842675215: ovs-system           2   60    0
[openvswitch__dp_upcall] swapper/8               0 [008]  1802346.842685418: ovs-system           2   60    0
[openvswitch__dp_upcall] swapper/22              0 [022]  1802346.842686394: ovs-system           2   60    0
[openvswitch__dp_upcall] swapper/8               0 [008]  1802346.842688965: ovs-system           2   60    0
[openvswitch__dp_upcall] swapper/8               0 [008]  1802346.842692699: ovs-system           2   60    0
[dpif_recv__recv_upcall] handler10          409283 [024]  1802346.842702062: ovs-system           2   60
[dpif_recv__recv_upcall] handler8           409281 [009]  1802346.842702155: ovs-system           2   60
[dpif_recv__recv_upcall] handler15          409288 [014]  1802346.842703571: ovs-system           2   60
[dpif_recv__recv_upcall] handler1           409274 [022]  1802346.842710813: ovs-system           2   60
[dpif_recv__recv_upcall] handler8           409281 [009]  1802346.842732671: ovs-system           2   60
[dpif_recv__recv_upcall] handler10          409283 [024]  1802346.842734368: ovs-system           2   60
[..operate__op_flow_put] handler1           409274 [022]  1802346.842736406
[..ate__op_flow_execute] handler1           409274 [022]  1802346.842737759:                          60
[dpif_recv__recv_upcall] handler10          409283 [024]  1802346.842741405: ovs-system           2   60
[..operate__op_flow_put] handler8           409281 [009]  1802346.842741889
[..ate__op_flow_execute] handler8           409281 [009]  1802346.842743288:                          60
[..operate__op_flow_put] handler8           409281 [009]  1802346.842744921
[..operate__op_flow_put] handler15          409288 [014]  1802346.842745244
[..ate__op_flow_execute] handler8           409281 [009]  1802346.842745913:                          60
[..ate__op_flow_execute] handler15          409288 [014]  1802346.842746802:                          60
[dpif_recv__recv_upcall] handler10          409283 [024]  1802346.842747036: ovs-system           2   60
[dpif_recv__recv_upcall] handler10          409283 [024]  1802346.842752903: ovs-system           2   60
[..s_packet_cmd_execute] handler1           409274 [022]  1802346.842757603
[..s_packet_cmd_execute] handler15          409288 [014]  1802346.842758324
[..s_packet_cmd_execute] handler8           409281 [009]  1802346.842759437
[..operate__op_flow_put] handler10          409283 [024]  1802346.842761813
[..ate__op_flow_execute] handler10          409283 [024]  1802346.842763171:                          60
[..operate__op_flow_put] handler10          409283 [024]  1802346.842764504
[..s_packet_cmd_execute] handler8           409281 [009]  1802346.842765386
[..ate__op_flow_execute] handler10          409283 [024]  1802346.842765481:                          60
[..operate__op_flow_put] handler10          409283 [024]  1802346.842766751
[..ate__op_flow_execute] handler10          409283 [024]  1802346.842767685:                          60
[..operate__op_flow_put] handler10          409283 [024]  1802346.842768766
[..ate__op_flow_execute] handler10          409283 [024]  1802346.842769672:                          60
[..operate__op_flow_put] handler10          409283 [024]  1802346.842770857
[..ate__op_flow_execute] handler10          409283 [024]  1802346.842771819:                          60
[..s_packet_cmd_execute] handler10          409283 [024]  1802346.842784813
[..s_packet_cmd_execute] handler10          409283 [024]  1802346.842790567
[..s_packet_cmd_execute] handler10          409283 [024]  1802346.842793300
[..s_packet_cmd_execute] handler10          409283 [024]  1802346.842795959
[..s_packet_cmd_execute] handler10          409283 [024]  1802346.842798544
[openvswitch__dp_upcall] swapper/25              0 [025]  1802346.862490199: ovs-system           2   60    0
[dpif_recv__recv_upcall] handler11          409284 [011]  1802346.862515346: ovs-system           2   60
[..operate__op_flow_put] handler11          409284 [011]  1802346.862533071
[..ate__op_flow_execute] handler11          409284 [011]  1802346.862534409:                          60
[..s_packet_cmd_execute] handler11          409284 [011]  1802346.862546508
^C
Next, the output shows the total number of events received and their types. This kind of output also appeared in examples in the previous section because it indicates when there are potentially missed events:
- Analyzing results (50 events)...

=> Events received per type (usable/total) [missed events]:
  dpif_netlink_operate__op_flow_execute :         10/        10 [         0]
  dpif_netlink_operate__op_flow_put     :         10/        10 [         0]
  dpif_recv__recv_upcall                :         10/        10 [         0]
  ktrace__ovs_packet_cmd_execute        :         10/        10 [         0]
  openvswitch__dp_upcall                :         10/        10 [         0]
Next, the script starts correlating events. The following example shows 10 sets of correlated events, which is as expected, because we have sent 10 packets without a datapath flow, so they needed full processing:
- Matching DP_UPCALLs to RECV_UPCALLs |████████████████████████████████████████| 10/10 [100%] in 0.0s (478.15/s)

- Analyzing 10 event sets...
Next are statistics related to which handler threads processed the upcall by calling dpif_recv() and reading the data from the socket. These statistics might be interesting to see whether the upcalls are distributed evenly across threads. If not, this might be an interesting area for research. This imbalance could be perfectly fine because you might only have a limited set of flows, but it could also be the sign of a bug or misconfiguration:
=> Upcalls handled per thread:
  handler10                           :          5
  handler8                            :          2
  handler15                           :          1
  handler1                            :          1
  handler11                           :          1
Batching and event types
Before looking at the next set of histograms, we need to talk about the events being captured and their relationships. We'll look at five types of events, two executed in the kernel and three by OVS through Userland Statically Defined Tracing (USDT) probes.
The events generated within the kernel are:
openvswitch__dp_upcall: A kernel tracepoint, which appears every time the OVS kernel module wants to send a packet to userspace.ktrace__ovs_packet_cmd_execute: Akprobe, which appears every time the OVS kernel module receives a packet from userspace that it needs to execute, i.e. forward.
The events generated by USDT probes in OVS are:
dpif_recv__recv_upcall: An event that appears every time an upcall is read from the kernel.dpif_netlink_operate__op_flow_put: An event that appears every time the Netlink datapath is about to execute theDPIF_OP_FLOW_PUToperation as part of thedpif_operate()callback.dpif_netlink_operate__op_flow_execute: An event that appears every time the Netlink datapath is about to execute theDPIF_OP_FLOW_EXECUTEoperation as part of thedpif_operate()callback.
OVS usually reads upcall messages in the openvswitch__dp_upcall function in batches, with a maximum of 64 messages per batch. When OVS doesn't batch the upcalls, the sequence of events is:
openvswitch__dp_upcalldpif_recv__recv_upcalldpif_netlink_operate__op_flow_put1dpof_netlink_operate__op_flow_execute2
ktrace__ovs_packet_cmd_execute2
Note that the flow put operation, dpif_netlink_operate__op_flow_put, might be missing if the datapath flow was already pushed to the kernel. This can happen when two or more packets of the same flow are queued for slow-path processing.
Also note that the flow execution operations, dpof_netlink_operate__op_flow_execute and ace__ovs_packet_cmd_execute, might be missing if, for example, the packet was sent up for forwarding to the controller.
More often, OVS batches the received upcalls. To clarify the sequence in this case, we take the example of three upcalls called A, B, and C:
openvswitch__dp_upcallAopenvswitch__dp_upcallBopenvswitch__dp_upcallCdpif_recv__recv_upcallAdpif_recv__recv_upcallBdpif_recv__recv_upcallC- OVS is doing all the flow lookups/preprocessing for A, B, and C.
dpif_netlink_operate__op_flow_putAdpif_netlink_operate__op_flow_executeAdpif_netlink_operate__op_flow_putBdpif_netlink_operate__op_flow_executeBdpif_netlink_operate__op_flow_putCdpif_netlink_operate__op_flow_executeC- OVS sends the batched netlink message to the kernel.
ktrace__ovs_packet_cmd_executeAktrace__ovs_packet_cmd_executeBktrace__ovs_packet_cmd_executeC
Histograms
Now that we know the sequence of events, let's discuss the output of the first histogram. This one is straightforward: It shows the total number of sets (the total number of sequences for a single packet, as explained earlier), the minimum batch size, and the maximum batch size:
=> Histogram of upcalls per batch:
# NumSamples = 5; Min = 1; Max = 5
# each ∎ represents a count of 1
    1 [       3]: ∎∎∎                        33 [       0]:
    2 [       1]: ∎                          34 [       0]:
    3 [       0]:                            35 [       0]:
    4 [       0]:                            36 [       0]:
    5 [       1]: ∎                          37 [       0]:
    6 [       0]:                            38 [       0]:
    7 [       0]:                            39 [       0]:
    8 [       0]:                            40 [       0]:
    9 [       0]:                            41 [       0]:
   10 [       0]:                            42 [       0]:
   11 [       0]:                            43 [       0]:
   12 [       0]:                            44 [       0]:
   13 [       0]:                            45 [       0]:
   14 [       0]:                            46 [       0]:
   15 [       0]:                            47 [       0]:
   16 [       0]:                            48 [       0]:
   17 [       0]:                            49 [       0]:
   18 [       0]:                            50 [       0]:
   19 [       0]:                            51 [       0]:
   20 [       0]:                            52 [       0]:
   21 [       0]:                            53 [       0]:
   22 [       0]:                            54 [       0]:
   23 [       0]:                            55 [       0]:
   24 [       0]:                            56 [       0]:
   25 [       0]:                            57 [       0]:
   26 [       0]:                            58 [       0]:
   27 [       0]:                            59 [       0]:
   28 [       0]:                            60 [       0]:
   29 [       0]:                            61 [       0]:
   30 [       0]:                            62 [       0]:
   31 [       0]:                            63 [       0]:
   32 [       0]:                            64 [       0]:
The next four histograms have a slightly different format, but still show the number of samples (sets) and the minimum and maximum value as before. In addition, the output shows some statistical properties: mean, variance, standard deviation (SD), and median. All times are in microseconds.
The first histogram we'll examine shows the delta between the openvswitch__dp_upcall and dpif_recv__recv_upcall events: In other words, the time it takes from the kernel queueing the upcall data till the ovs-vswitchd reads it from the Netlink socket:
=> Kernel upcall action to vswitchd receive (microseconds):
# NumSamples = 10; Min = 25.15; Max = 60.20
# Mean = 42.472500; Variance = 206.186660; SD = 14.359201; Median 40.937500
# each ∎ represents a count of 1
   25.1470 -    26.8998 [     1]: ∎
   26.8998 -    28.6527 [     3]: ∎∎∎
   28.6527 -    30.4055 [     0]:
   30.4055 -    32.1584 [     0]:
   32.1584 -    33.9112 [     0]:
   33.9112 -    35.6641 [     1]: ∎
   35.6641 -    37.4169 [     0]:
   37.4169 -    39.1698 [     0]:
   39.1698 -    40.9226 [     0]:
   40.9226 -    42.6755 [     0]:
   42.6755 -    44.4283 [     0]:
   44.4283 -    46.1812 [     0]:
   46.1812 -    47.9340 [     1]: ∎
   47.9340 -    49.6869 [     0]:
   49.6869 -    51.4398 [     0]:
   51.4398 -    53.1926 [     0]:
   53.1926 -    54.9454 [     0]:
   54.9454 -    56.6983 [     1]: ∎
   56.6983 -    58.4511 [     1]: ∎
   58.4511 -    60.2040 [     2]: ∎∎
The following histogram shows the reverse of the previous one, meaning the delta between the dpif_netlink_operate__op_flow_execute and ktrace__ovs_packet_cmd_execute events: In other words, the time it takes from the ovs-vswitchd queuing the DPIF_OP_FLOW_EXECUTE operation till the OVS kernel module receives it:
=> vswitchd execute to kernel receive (microseconds):
# NumSamples = 10; Min = 11.52; Max = 26.73
# Mean = 20.444200; Variance = 29.230519; SD = 5.406526; Median 20.743000
# each ∎ represents a count of 1
   11.5220 -    12.2821 [     2]: ∎∎
   12.2821 -    13.0423 [     0]:
   13.0423 -    13.8025 [     0]:
   13.8025 -    14.5626 [     0]:
   14.5626 -    15.3228 [     0]:
   15.3228 -    16.0829 [     0]:
   16.0829 -    16.8431 [     1]: ∎
   16.8431 -    17.6032 [     0]:
   17.6032 -    18.3634 [     0]:
   18.3634 -    19.1235 [     0]:
   19.1235 -    19.8837 [     2]: ∎∎
   19.8837 -    20.6438 [     0]:
   20.6438 -    21.4040 [     0]:
   21.4040 -    22.1641 [     1]: ∎
   22.1641 -    22.9243 [     0]:
   22.9243 -    23.6844 [     0]:
   23.6844 -    24.4445 [     0]:
   24.4445 -    25.2047 [     1]: ∎
   25.2047 -    25.9649 [     1]: ∎
   25.9649 -    26.7250 [     2]: ∎∎
The following histogram shows the total time it takes from the openvswitch__dp_upcall event till the ktrace__ovs_packet_cmd_execute event, minus the time ovs-vswitchd spends doing the actual flow lookup/preparation. Put mathematically, the value reflects:
ΔT=(ktrace__ovs_packet_cmd_execute − openvswitch__dp_upcall) - (dpif_netlink_operate__op_flow_put − dpif_recv__recv_upcall)
=> Upcall overhead (total time minus lookup) (microseconds):
# NumSamples = 10; Min = 38.58; Max = 87.89
# Mean = 64.094400; Variance = 361.183667; SD = 19.004833; Median 61.768500
# each ∎ represents a count of 1
   38.5840 -    41.0494 [     1]: ∎
   41.0494 -    43.5147 [     1]: ∎
   43.5147 -    45.9801 [     1]: ∎
   45.9801 -    48.4454 [     0]:
   48.4454 -    50.9108 [     1]: ∎
   50.9108 -    53.3761 [     0]:
   53.3761 -    55.8415 [     0]:
   55.8415 -    58.3068 [     1]: ∎
   58.3068 -    60.7722 [     0]:
   60.7722 -    63.2375 [     0]:
   63.2375 -    65.7028 [     0]:
   65.7028 -    68.1682 [     1]: ∎
   68.1682 -    70.6335 [     0]:
   70.6335 -    73.0989 [     0]:
   73.0989 -    75.5643 [     0]:
   75.5643 -    78.0296 [     0]:
   78.0296 -    80.4950 [     0]:
   80.4950 -    82.9603 [     1]: ∎
   82.9603 -    85.4257 [     1]: ∎
   85.4257 -    87.8910 [     2]: ∎∎
The final histogram shows the total time it takes from the openvswitch__dp_upcall event till the ktrace__ovs_packet_cmd_execute event:
=> Kernel upcall to kernel packet execute (microseconds):
# NumSamples = 10; Min = 56.31; Max = 116.30
# Mean = 93.283600; Variance = 323.670661; SD = 17.990849; Median 95.245000
# each ∎ represents a count of 1
   56.3090 -    59.3087 [     1]: ∎
   59.3087 -    62.3085 [     0]:
   62.3085 -    65.3083 [     0]:
   65.3083 -    68.3080 [     0]:
   68.3080 -    71.3077 [     0]:
   71.3077 -    74.3075 [     0]:
   74.3075 -    77.3072 [     0]:
   77.3072 -    80.3070 [     1]: ∎
   80.3070 -    83.3067 [     1]: ∎
   83.3067 -    86.3065 [     2]: ∎∎
   86.3065 -    89.3063 [     0]:
   89.3063 -    92.3060 [     0]:
   92.3060 -    95.3057 [     0]:
   95.3057 -    98.3055 [     0]:
   98.3055 -   101.3053 [     0]:
  101.3053 -   104.3050 [     0]:
  104.3050 -   107.3047 [     2]: ∎∎
  107.3047 -   110.3045 [     2]: ∎∎
  110.3045 -   113.3042 [     0]:
  113.3042 -   116.3040 [     1]: ∎
Runs with real-world data
The data we will present next was taken on a node within a 16-node OpenShift cluster running Open Virtual Network (OVN) on top of OVS, over the duration of two hours and 20 minutes. The goal was to simulate a real-world traffic set, using both TCP and UDP with a mix of streamed and request-response-like traffic.
Before we started the script, we made sure all pods needed in the cluster were up and running, so no OVS port modifications were required. (Some modifications did happen during the run, but those events were ignored).
Let's dump the output of the run and add some remarks to it:
# ./upcall_cost.py -q -r ovn_ocp_stats.dat
- Reading events from "ovn_ocp_stats.dat"...
- Analyzing results (309351 events)...

=> Events received per type (usable/total) [missed events]:
  dpif_netlink_operate__op_flow_execute :      65294/     65294 [         0]
  dpif_netlink_operate__op_flow_put     :      56135/     56135 [         0]
  dpif_recv__recv_upcall                :      64969/     64969 [         0]
  ktrace__ovs_packet_cmd_execute        :      65292/     65292 [         0]
  openvswitch__dp_upcall                :      57661/     64224 [         0]

- Matching DP_UPCALLs to RECV_UPCALLs |████████████████████████████████████████| 57661/57661 [100%] in 10.1s (5683.50/s)
WARNING: SKB from kernel had fragments, we could only copy/compare the first part!

- Analyzing 57538 event sets...
The first thing to notice is that the upcalls are not nicely distributed among the handler threads. There could be all kinds of reasons, which might be worth investigating. Because the saved events have a lot of data, including a packet fragment, it's possible to write an additional script the analyze the data:
=> Upcalls handled per thread:
  handler1                            :      26769
  handler2                            :      21067
  handler5                            :       5148
  handler6                            :       2665
  handler4                            :       9320
Second, the batch size is only 9, so there is probably not a high rate of upcalls coming in:
=> Histogram of upcalls per batch:
# NumSamples = 61069; Min = 1; Max = 9
# each ∎ represents a count of 14575
    1 [   58301]: ∎∎∎∎                       33 [       0]:
    2 [    2052]:                            34 [       0]:
    3 [     451]:                            35 [       0]:
    4 [     167]:                            36 [       0]:
    5 [      62]:                            37 [       0]:
    6 [      23]:                            38 [       0]:
    7 [      10]:                            39 [       0]:
    8 [       2]:                            40 [       0]:
    9 [       1]:                            41 [       0]:
   10 [       0]:                            42 [       0]:
   11 [       0]:                            43 [       0]:
   12 [       0]:                            44 [       0]:
   13 [       0]:                            45 [       0]:
   14 [       0]:                            46 [       0]:
   15 [       0]:                            47 [       0]:
   16 [       0]:                            48 [       0]:
   17 [       0]:                            49 [       0]:
   18 [       0]:                            50 [       0]:
   19 [       0]:                            51 [       0]:
   20 [       0]:                            52 [       0]:
   21 [       0]:                            53 [       0]:
   22 [       0]:                            54 [       0]:
   23 [       0]:                            55 [       0]:
   24 [       0]:                            56 [       0]:
   25 [       0]:                            57 [       0]:
   26 [       0]:                            58 [       0]:
   27 [       0]:                            59 [       0]:
   28 [       0]:                            60 [       0]:
   29 [       0]:                            61 [       0]:
   30 [       0]:                            62 [       0]:
   31 [       0]:                            63 [       0]:
   32 [       0]:                            64 [       0]:
The following four histograms show various measurements of time spent processing various parts of the upcalls. The last two show the difference between the total time and the total time minus the flow lookup time.
=> Kernel upcall action to vswitchd receive (microseconds):
# NumSamples = 57538; Min = 5.28; Max = 1017.34
# Mean = 37.127455; Variance = 449.345903; SD = 21.197781; Median 28.918000
# each ∎ represents a count of 591
    5.2830 -    55.8858 [ 44328]: ∎∎∎∎∎∎∎∎∎∎∎∎∎∎∎∎∎∎∎∎∎∎∎∎∎∎∎∎∎∎∎∎∎∎∎∎∎∎∎∎∎∎∎∎∎∎∎∎∎∎∎∎∎∎∎∎∎∎∎∎∎∎∎∎∎∎∎∎∎∎∎∎∎∎∎
   55.8858 -   106.4885 [ 13091]: ∎∎∎∎∎∎∎∎∎∎∎∎∎∎∎∎∎∎∎∎∎∎
  106.4885 -   157.0912 [    89]:
  157.0912 -   207.6940 [     7]:
  207.6940 -   258.2968 [     5]:
  258.2968 -   308.8995 [     3]:
  308.8995 -   359.5023 [     5]:
  359.5023 -   410.1050 [     2]:
  410.1050 -   460.7078 [     4]:
  460.7078 -   511.3105 [     0]:
  511.3105 -   561.9133 [     0]:
  561.9133 -   612.5160 [     0]:
  612.5160 -   663.1187 [     0]:
  663.1187 -   713.7215 [     0]:
  713.7215 -   764.3243 [     1]:
  764.3243 -   814.9270 [     0]:
  814.9270 -   865.5298 [     2]:
  865.5298 -   916.1325 [     0]:
  916.1325 -   966.7353 [     0]:
  966.7353 -  1017.3380 [     1]:
=> vswitchd execute to kernel receive (microseconds):
# NumSamples = 56446; Min = 2.34; Max = 991.14
# Mean = 25.006876; Variance = 186.347754; SD = 13.650925; Median 24.358000
# each ∎ represents a count of 732
    2.3440 -    51.7839 [ 54970]: ∎∎∎∎∎∎∎∎∎∎∎∎∎∎∎∎∎∎∎∎∎∎∎∎∎∎∎∎∎∎∎∎∎∎∎∎∎∎∎∎∎∎∎∎∎∎∎∎∎∎∎∎∎∎∎∎∎∎∎∎∎∎∎∎∎∎∎∎∎∎∎∎∎∎∎
   51.7839 -   101.2239 [  1394]: ∎
  101.2239 -   150.6638 [    71]:
  150.6638 -   200.1038 [     5]:
  200.1038 -   249.5437 [     2]:
  249.5437 -   298.9837 [     0]:
  298.9837 -   348.4236 [     0]:
  348.4236 -   397.8636 [     0]:
  397.8636 -   447.3035 [     0]:
  447.3035 -   496.7435 [     0]:
  496.7435 -   546.1834 [     1]:
  546.1834 -   595.6234 [     0]:
  595.6234 -   645.0634 [     0]:
  645.0634 -   694.5033 [     0]:
  694.5033 -   743.9433 [     0]:
  743.9433 -   793.3832 [     0]:
  793.3832 -   842.8231 [     0]:
  842.8231 -   892.2631 [     0]:
  892.2631 -   941.7030 [     1]:
  941.7030 -   991.1430 [     2]:
=> Upcall overhead (total time minus lookup) (microseconds):
# NumSamples = 51329; Min = 18.45; Max = 1051.58
# Mean = 66.283183; Variance = 748.900766; SD = 27.366051; Median 58.436000
# each ∎ represents a count of 442
   18.4520 -    70.1084 [ 33178]: ∎∎∎∎∎∎∎∎∎∎∎∎∎∎∎∎∎∎∎∎∎∎∎∎∎∎∎∎∎∎∎∎∎∎∎∎∎∎∎∎∎∎∎∎∎∎∎∎∎∎∎∎∎∎∎∎∎∎∎∎∎∎∎∎∎∎∎∎∎∎∎∎∎∎∎
   70.1084 -   121.7647 [ 17153]: ∎∎∎∎∎∎∎∎∎∎∎∎∎∎∎∎∎∎∎∎∎∎∎∎∎∎∎∎∎∎∎∎∎∎∎∎∎∎
  121.7647 -   173.4210 [   927]: ∎∎
  173.4210 -   225.0774 [    50]:
  225.0774 -   276.7337 [     6]:
  276.7337 -   328.3901 [     1]:
  328.3901 -   380.0464 [     2]:
  380.0464 -   431.7028 [     1]:
  431.7028 -   483.3591 [     2]:
  483.3591 -   535.0155 [     1]:
  535.0155 -   586.6718 [     1]:
  586.6718 -   638.3282 [     0]:
  638.3282 -   689.9845 [     0]:
  689.9845 -   741.6409 [     0]:
  741.6409 -   793.2972 [     1]:
  793.2972 -   844.9536 [     0]:
  844.9536 -   896.6099 [     1]:
  896.6099 -   948.2663 [     1]:
  948.2663 -   999.9226 [     2]:
  999.9226 -  1051.5790 [     2]:
=> Kernel upcall to kernel packet execute (microseconds):
# NumSamples = 56446; Min = 19.57; Max = 1306.49
# Mean = 149.825728; Variance = 4282.641028; SD = 65.441890; Median 144.253500
# each ∎ represents a count of 276
   19.5700 -    83.9161 [  8637]: ∎∎∎∎∎∎∎∎∎∎∎∎∎∎∎∎∎∎∎∎∎∎∎∎∎∎∎∎∎∎∎
   83.9161 -   148.2623 [ 20707]: ∎∎∎∎∎∎∎∎∎∎∎∎∎∎∎∎∎∎∎∎∎∎∎∎∎∎∎∎∎∎∎∎∎∎∎∎∎∎∎∎∎∎∎∎∎∎∎∎∎∎∎∎∎∎∎∎∎∎∎∎∎∎∎∎∎∎∎∎∎∎∎∎∎∎∎
  148.2623 -   212.6084 [ 18989]: ∎∎∎∎∎∎∎∎∎∎∎∎∎∎∎∎∎∎∎∎∎∎∎∎∎∎∎∎∎∎∎∎∎∎∎∎∎∎∎∎∎∎∎∎∎∎∎∎∎∎∎∎∎∎∎∎∎∎∎∎∎∎∎∎∎∎∎∎
  212.6084 -   276.9546 [  6135]: ∎∎∎∎∎∎∎∎∎∎∎∎∎∎∎∎∎∎∎∎∎∎
  276.9546 -   341.3007 [  1431]: ∎∎∎∎∎
  341.3007 -   405.6469 [   380]: ∎
  405.6469 -   469.9930 [   101]:
  469.9930 -   534.3392 [    34]:
  534.3392 -   598.6853 [    14]:
  598.6853 -   663.0315 [     6]:
  663.0315 -   727.3777 [     2]:
  727.3777 -   791.7238 [     0]:
  791.7238 -   856.0699 [     2]:
  856.0699 -   920.4161 [     2]:
  920.4161 -   984.7622 [     1]:
  984.7622 -  1049.1084 [     1]:
 1049.1084 -  1113.4545 [     2]:
 1113.4545 -  1177.8007 [     1]:
 1177.8007 -  1242.1468 [     0]:
 1242.1468 -  1306.4930 [     0]:
Figure 1 shows the spread of times as boxplots, with averages marked as red triangles and the medians as vertical orange lines. The values in the Total boxplot came from the "Kernel upcall to kernel packet execute (microseconds)" histogram shown earlier. The values in the Overhead boxplot came from the "Upcall overhead (total time minus lookup) (microseconds)" histogram and represent the time taken by the dpif_* calls. The mean total is 150 microseconds, and the mean overhead is 66, or 44% of the total. The median is similar: 144 total and 58 overhead, or 40% of the total.
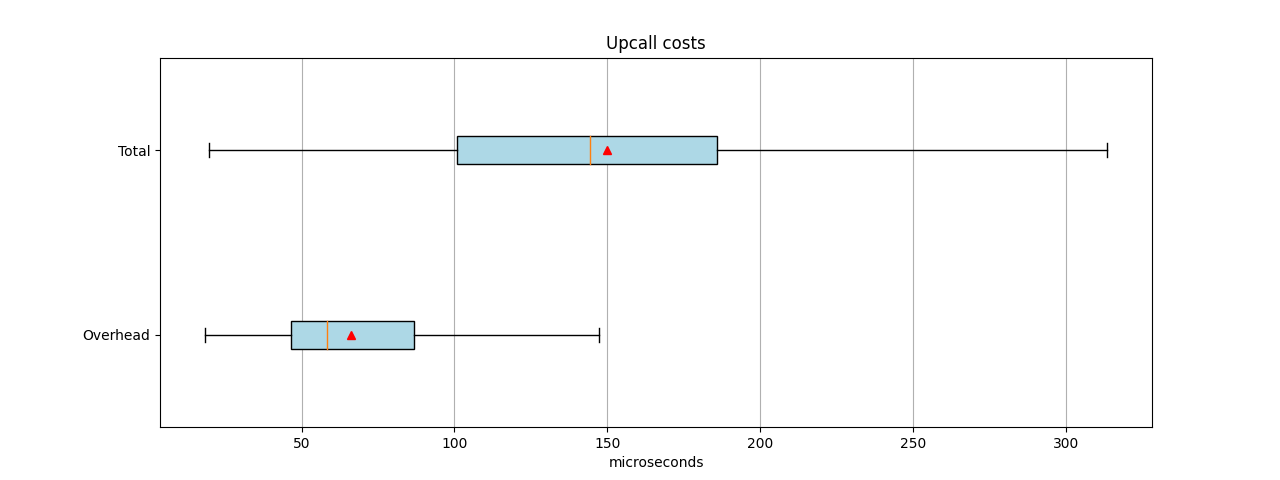
Although the overheads in Figure 1 look high, when you consider the small amount of absolute time required and know that the sequences could potentially do three kernel interactions, the overhead does not look too bad. Of course, there are outliers, but the script in the current form does not report any statistics on those.
Runs with test data
In the lab, we do a lot of benchmarking, which in most cases does not use a realistic traffic pattern. One of those tests is physical to virtual to physical (PVP), where we send a high amount of traffic, mostly at wire speed, toward the device under test (DUT) and measure the throughput. This high rate of unknown traffic puts a lot of stress on the lookup part of OVS. One catch is that packets are queued to userspace until the flow gets installed, which at wire speed leads to buffer overruns and in turn lost packets.
Here is an example of running an ovs_perf test with 64-byte packets and a total of 100 flows:
# upcall_cost.py -w pvp_64_batch64_full_20sec_random_100flows.cost -q --buffer-page-count 64000
- Compiling eBPF programs...
- Capturing events [Press ^C to stop]...
^C
- Analyzing results (56316 events)...

=> Events received per type (usable/total) [missed events]:
  dpif_netlink_operate__op_flow_execute   :      13835/     13835 [         0]
  dpif_netlink_operate__op_flow_put       :        200/       200 [         0]
  dpif_recv__recv_upcall                  :      13835/     13835 [         0]
  ktrace__ovs_packet_cmd_execute          :      13835/     13835 [         0]
  openvswitch__dp_upcall                  :      14611/     14611 [         0]
The first thing to notice here is the imbalance between the 14,611 events handled by openvswitch__dp_upcall and the 13,835 events handled by dpif_recv__recv_upcall and related calls. This means that 776 upcalls failed to be sent to userspace.
Note: I had to modify the ovs_pvp script to send random packet data, or else the packet would be matched wrongly; i.e., a missed openvswitch__dp_upcall would match to the first identical packet received by dpif_recv__recv_upcall.
Further output shows that 98% of the packets were batched together in batches of 64 packets:
- Analyzing 13807 event sets...
...

=> Histogram of upcalls per batch:
# NumSamples = 225; Min = 1; Max = 64
# each ∎ represents a count of 52
    1 [       2]:                            33 [       0]:
    2 [       0]:                            34 [       0]:
    3 [       0]:                            35 [       1]:
    4 [       0]:                            36 [       1]:
    5 [       0]:                            37 [       0]:
    6 [       0]:                            38 [       0]:
    7 [       0]:                            39 [       0]:
    8 [       1]:                            40 [       0]:
    9 [       0]:                            41 [       0]:
   10 [       0]:                            42 [       0]:
   11 [       0]:                            43 [       1]:
   12 [       0]:                            44 [       0]:
   13 [       0]:                            45 [       0]:
   14 [       0]:                            46 [       0]:
   15 [       0]:                            47 [       0]:
   16 [       0]:                            48 [       0]:
   17 [       1]:                            49 [       0]:
   18 [       1]:                            50 [       0]:
   19 [       1]:                            51 [       0]:
   20 [       0]:                            52 [       0]:
   21 [       0]:                            53 [       0]:
   22 [       2]:                            54 [       0]:
   23 [       0]:                            55 [       0]:
   24 [       0]:                            56 [       1]:
   25 [       0]:                            57 [       0]:
   26 [       1]:                            58 [       0]:
   27 [       1]:                            59 [       0]:
   28 [       0]:                            60 [       0]:
   29 [       0]:                            61 [       0]:
   30 [       0]:                            62 [       0]:
   31 [       0]:                            63 [       0]:
   32 [       0]:                            64 [     211]: ∎∎∎∎
A histogram of the total time follows:
=> Kernel upcall to kernel packet execute (microseconds):
# NumSamples = 13807; Min = 622.86; Max = 100147.68
# Mean = 29367.911161; Variance = 810227590.080283; SD = 28464.497011; Median 17470.188000
# each ∎ represents a count of 51
  622.8620 -  5599.1031 [  3834]: ∎∎∎∎∎∎∎∎∎∎∎∎∎∎∎∎∎∎∎∎∎∎∎∎∎∎∎∎∎∎∎∎∎∎∎∎∎∎∎∎∎∎∎∎∎∎∎∎∎∎∎∎∎∎∎∎∎∎∎∎∎∎∎∎∎∎∎∎∎∎∎∎∎∎∎
 5599.1031 - 10575.3443 [  1209]: ∎∎∎∎∎∎∎∎∎∎∎∎∎∎∎∎∎∎∎∎∎∎∎
10575.3443 - 15551.5854 [  1264]: ∎∎∎∎∎∎∎∎∎∎∎∎∎∎∎∎∎∎∎∎∎∎∎∎
15551.5854 - 20527.8266 [  1036]: ∎∎∎∎∎∎∎∎∎∎∎∎∎∎∎∎∎∎∎∎
20527.8266 - 25504.0678 [   550]: ∎∎∎∎∎∎∎∎∎∎
25504.0678 - 30480.3089 [   640]: ∎∎∎∎∎∎∎∎∎∎∎∎
30480.3089 - 35456.5500 [   576]: ∎∎∎∎∎∎∎∎∎∎∎
35456.5500 - 40432.7912 [   576]: ∎∎∎∎∎∎∎∎∎∎∎
40432.7912 - 45409.0324 [   576]: ∎∎∎∎∎∎∎∎∎∎∎
45409.0324 - 50385.2735 [   576]: ∎∎∎∎∎∎∎∎∎∎∎
50385.2735 - 55361.5146 [   192]: ∎∎∎
55361.5146 - 60337.7558 [   315]: ∎∎∎∎∎∎
60337.7558 - 65313.9970 [   261]: ∎∎∎∎∎
65313.9970 - 70290.2381 [   384]: ∎∎∎∎∎∎∎
70290.2381 - 75266.4792 [   320]: ∎∎∎∎∎∎
75266.4792 - 80242.7204 [   256]: ∎∎∎∎∎
80242.7204 - 85218.9615 [   320]: ∎∎∎∎∎∎
85218.9615 - 90195.2027 [   320]: ∎∎∎∎∎∎
90195.2027 - 95171.4438 [   262]: ∎∎∎∎∎
95171.4438 - 100147.6850 [   340]: ∎∎∎∎∎∎
A histogram of the same events follows with the batch size forced down to a single packet:
=> Kernel upcall to kernel packet execute (microseconds):
# NumSamples = 14861; Min = 31.18; Max = 170137.33
# Mean = 41191.399403; Variance = 1889961006.419044; SD = 43473.681767; Median 21085.577000
# each ∎ represents a count of 41
   31.1810 -  8536.4883 [  3019]: ∎∎∎∎∎∎∎∎∎∎∎∎∎∎∎∎∎∎∎∎∎∎∎∎∎∎∎∎∎∎∎∎∎∎∎∎∎∎∎∎∎∎∎∎∎∎∎∎∎∎∎∎∎∎∎∎∎∎∎∎∎∎∎∎∎∎∎∎∎∎∎∎∎
 8536.4883 - 17041.7955 [  3139]: ∎∎∎∎∎∎∎∎∎∎∎∎∎∎∎∎∎∎∎∎∎∎∎∎∎∎∎∎∎∎∎∎∎∎∎∎∎∎∎∎∎∎∎∎∎∎∎∎∎∎∎∎∎∎∎∎∎∎∎∎∎∎∎∎∎∎∎∎∎∎∎∎∎∎∎∎
17041.7955 - 25547.1028 [  1880]: ∎∎∎∎∎∎∎∎∎∎∎∎∎∎∎∎∎∎∎∎∎∎∎∎∎∎∎∎∎∎∎∎∎∎∎∎∎∎∎∎∎∎∎∎∎
25547.1028 - 34052.4100 [   841]: ∎∎∎∎∎∎∎∎∎∎∎∎∎∎∎∎∎∎∎∎
34052.4100 - 42557.7172 [   997]: ∎∎∎∎∎∎∎∎∎∎∎∎∎∎∎∎∎∎∎∎∎∎∎∎
42557.7172 - 51063.0245 [   937]: ∎∎∎∎∎∎∎∎∎∎∎∎∎∎∎∎∎∎∎∎∎∎
51063.0245 - 59568.3317 [   888]: ∎∎∎∎∎∎∎∎∎∎∎∎∎∎∎∎∎∎∎∎∎
59568.3317 - 68073.6390 [   134]: ∎∎∎
68073.6390 - 76578.9462 [   331]: ∎∎∎∎∎∎∎∎
76578.9462 - 85084.2535 [   294]: ∎∎∎∎∎∎∎
85084.2535 - 93589.5607 [   233]: ∎∎∎∎∎
93589.5607 - 102094.8680 [   238]: ∎∎∎∎∎
102094.8680 - 110600.1753 [   249]: ∎∎∎∎∎∎
110600.1753 - 119105.4825 [   230]: ∎∎∎∎∎
119105.4825 - 127610.7897 [   223]: ∎∎∎∎∎
127610.7897 - 136116.0970 [   230]: ∎∎∎∎∎
136116.0970 - 144621.4043 [   273]: ∎∎∎∎∎∎
144621.4043 - 153126.7115 [   248]: ∎∎∎∎∎∎
153126.7115 - 161632.0188 [   230]: ∎∎∎∎∎
161632.0188 - 170137.3260 [   247]: ∎∎∎∎∎∎
I had expected that the maximum time for a single packet batch would be less than it was for the 64-packet batch, because I removed the relatively long delay of doing 64 flow lookups before the packets get sent out. However, I guess that the stress on the kernel—which these statistics don't show—could make up for the time saved.
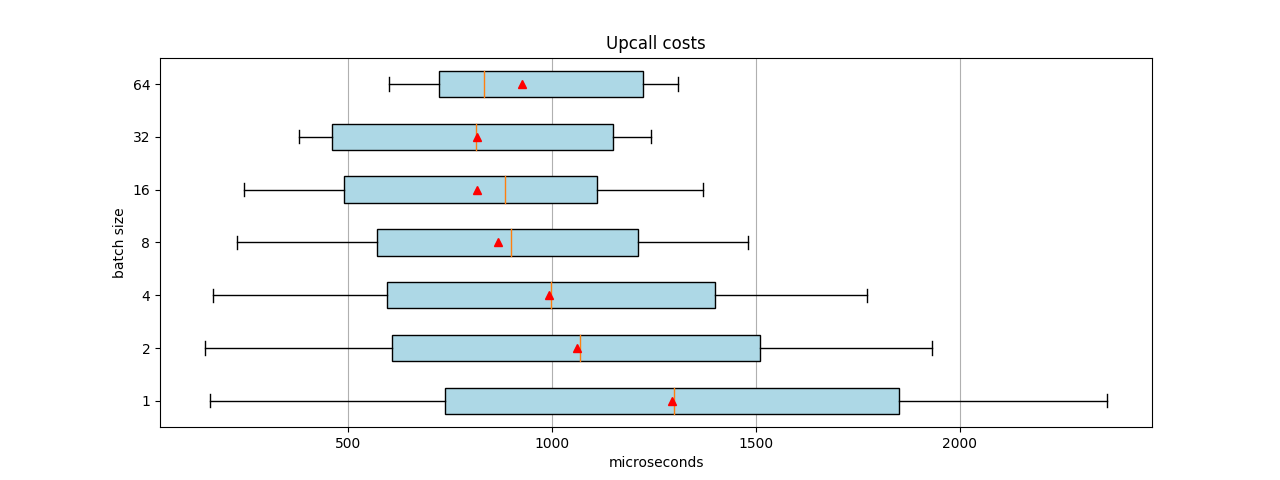
Figure 2 was created using the same method as before, but instead of continuously sending packets at wire speed, we sent in 1,000 packets/flows and stopped. That is, OVS does just the learning part. In addition, we set the number of handler threads to 1. Because of the wide ranges, we represented the microseconds on the X axis exponentially. This is why the averages in the boxplots appear skewed toward the right.

Smaller batch sizes enjoyed lower median execution times. In other words, 50% of the batch sizes are handled faster, but others take longer. This is probably because decreasing the receiving batch size also decreases the batching of the flow addition and execution messages toward the kernel. In addition, the total time per flow also increases over time, because we sent in more frames than the CPU can handle.
To alleviate this CPU load, we tried one more test that sent 100 packets, physical to virtual (PV) only. Figure 3 shows the results.
Whereas Figure 2 showed that a batch size of 64 offers the best mean and median performance, Figure 3 suggests that a batch size of 32 is better. These measurements include the total time it takes before all the flows are programed in the kernel module, when no upcalls are happening.
We could go on forever looking at more data, such as the total time it takes before all packets are handled by the kernel, the frequency and spread of the upcalls, etc. We could look at just the total time it costs to process the lookup by removing the openvswitch__dp_upcall from the set. This change would probably give better results for smaller batch sizes, but output from that run of the script would not show the longer time it takes to program all flows in the system, and thus would not show the complete picture of a system under stress.
My sample runs have shown what I want to emphasize in this article: The way the upcalls are generated highly influences the outcome of the upcall costs.
Conclusion
This article has shown the value of measuring the cost of upcalls, giving you good insight into your system's behavior. With the upcall_cost.py script available, monitoring OVS overhead is now possible on a fine-grained level.
Upcall costs differ between an average system and an overloaded one. It would be of interest to the community to capture and share upcall statistics. With this data, we could further tailor OVS to better behave in the most common scenarios. Try the upcall_cost.py script on your systems and work with us.