Introduction
There are infinite ways to test Virtual Switches, all tailored to expose (or hide) a specific characteristic. The goal of our test is to measure performance under stress and be able to compare versions, which may or may not have hardware offload.
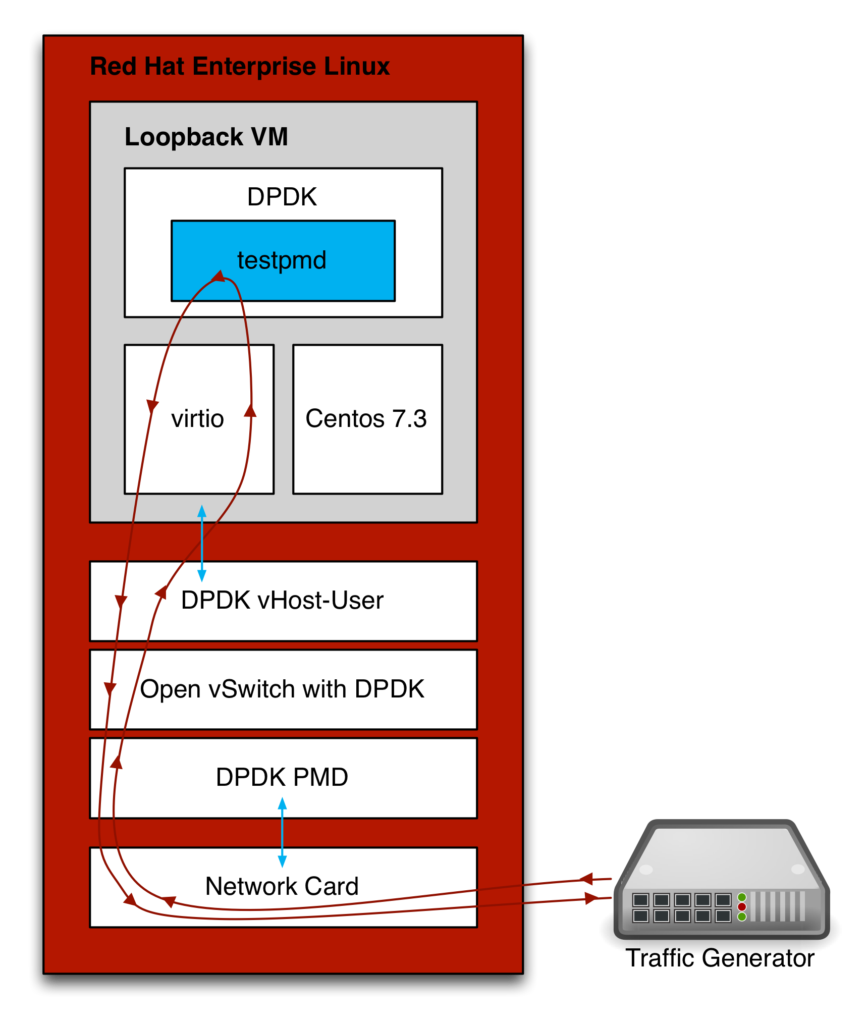
We will run the tests using the Physical to Virtual back to Physical topology. This configuration is also known as the PVP setup. The traffic will flow from a physical port to a virtual port on the Virtual Machine (VM), and then back to the physical port. The picture below shows the flow through Open vSwitch-DPDK, which we will use as an example throughout this blog post:
Traffic pattern and OpenFlow rules
The used traffic pattern and the configured OpenFlow rules can greatly influence the performance. For example:
- A traffic pattern that is not fairly distributed to the Multiqueue Network Interface Card's queues. Like when only the L2 fields (source and destination MAC addresses) in the traffic stream change.
- A single IPv4 /16 OpenFlow rule vs. 64K /32 rules.
So, depending on what aspects you want to test you configure traffic patterns and a set of OpenFlow rules. For our case, we just want to verify a bulk of traffic where each traffic stream has its own OpenFlow rule. Actually, we will have two OpenFlow rules for each traffic stream, one going to the Virtual Machine (VM) and one going back.
Due to some limitation on our traffic generator, we decided to only change the source and destination IPv4 addresses. This should not be a problem, as a number of streams we generate are causing a balanced distribution amongst the Multiqueue Network Interface Card's queues.
The packets we use for the purpose of this blog have an Ethernet II header (no VLAN), IPv4 header followed by an UDP header (with static ports). The size of the UDP data will be such that it fills the physical packet.
Especially for ASCII art lovers below is a representation of the packet. The fields in bold will change for each flow.
0                   1                   2                   3
0 1 2 3 4 5 6 7 8 9 0 1 2 3 4 5 6 7 8 9 0 1 2 3 4 5 6 7 8 9 0 1
+-+-+-+-+-+-+-+-+-+-+-+-+-+-+-+-+-+-+-+-+-+-+-+-+-+-+-+-+-+-+-+-+
| Destination MAC Address                                       |
+-+-+-+-+-+-+-+-+-+-+-+-+-+-+-+-+-+-+-+-+-+-+-+-+-+-+-+-+-+-+-+-+
| Destination MAC (continue)    | Source MAC Address            |
+-+-+-+-+-+-+-+-+-+-+-+-+-+-+-+-+-+-+-+-+-+-+-+-+-+-+-+-+-+-+-+-+
| Source MAC Address (continue)                                 |
+-+-+-+-+-+-+-+-+-+-+-+-+-+-+-+-+-+-+-+-+-+-+-+-+-+-+-+-+-+-+-+-+
| EtherType                     |
===============================IP4===============================
|Version|  IHL  |Type of Service|          Total Length         |
+-+-+-+-+-+-+-+-+-+-+-+-+-+-+-+-+-+-+-+-+-+-+-+-+-+-+-+-+-+-+-+-+
|         Identification        |Flags|      Fragment Offset    |
+-+-+-+-+-+-+-+-+-+-+-+-+-+-+-+-+-+-+-+-+-+-+-+-+-+-+-+-+-+-+-+-+
|  Time to Live |    Protocol   |         Header Checksum       |
+-+-+-+-+-+-+-+-+-+-+-+-+-+-+-+-+-+-+-+-+-+-+-+-+-+-+-+-+-+-+-+-+
|                       Source Address                          |
+-+-+-+-+-+-+-+-+-+-+-+-+-+-+-+-+-+-+-+-+-+-+-+-+-+-+-+-+-+-+-+-+
|                    Destination Address                        |
+-+-+-+-+-+-+-+-+-+-+-+-+-+-+-+-+-+-+-+-+-+-+-+-+-+-+-+-+-+-+-+-+
|                    Options                    |    Padding    |
===============================UDP===============================
|          Source Port          |       Destination Port        |
+-+-+-+-+-+-+-+-+-+-+-+-+-+-+-+-+-+-+-+-+-+-+-+-+-+-+-+-+-+-+-+-+
|            Length             |           Checksum            |
+-+-+-+-+-+-+-+-+-+-+-+-+-+-+-+-+-+-+-+-+-+-+-+-+-+-+-+-+-+-+-+-+
|   .... data ....                                              |
+-+-+-+-+-+-+-+-+-+-+-+-+-+-+-+-+-+-+-+-+-+-+-+-+-+-+-+-+-+-+-+-+
The VM will loopback the packets without modification to avoid wasting CPU cycles on the guest (see below). This will result in a single traffic stream (flowing in both directions), which gets associated with two OpenFlow rules (one for each direction). For the remaining of this blog post we will use the word flow to associate this pattern, i.e. 10 flows mean the traffic generator will create 10 traffic streams, and we configure 20 OpenFlow rules.
Setting up Red Hat Enterprise Linux
Here we assume you just finished installing Red Hat Enterprise Linux Server 7.3, including registration. We can now continue by enabling the two repositories we need. We need "Red Hat Enterprise Linux Fast Datapath 7" for Open vSwitch, and "Red Hat Virtualization 4" for Qemu. If you do not have access to these repositories, please contact your Red Hat representative.
subscription-manager repos --enable=rhel-7-fast-datapath-rpms
subscription-manager repos --enable=rhel-7-server-rhv-4-mgmt-agent-rpms
Installing the required packages
Next, we will install the required packages.
yum -y clean all
yum -y update
yum -y install driverctl git intltool libguestfs libguestfs-tools-c \
               libosinfo libvirt libvirt-python lshw openvswitch \
               python-ipaddr python-requests qemu-kvm-rhel
Tuning the host for Open vSwitch with DPDK
We need to dedicate some CPUs and huge page memory to the Open vSwitch's DPDK PMD threads and the Virtual Machine that will loopback the traffic. For quick benchmarking, I prefer to do the tuning manually. Alternatively, you can use tuned to do some of this for you.
As these CPUs should be dedicated to run Open vSwitch and the VM, they should be interrupted as minimal as possible. To accomplish this, we need to disable the timer ticks and general interrupt processing on those CPUs.
In our test scenario, we will reserve five CPUs for Open vSwitch, and another five for the Virtual Machine. We will use the CPUs numbered 1 to 10.
To reserve the huge page memory, the CPUs and disabling the timer ticks the following needs to be added to the kernel command line:
default_hugepagesz=1G hugepagesz=1G hugepages=16
isolcpus=1-10
nohz_full=1-10 rcu_nocbs=1-10 rcu_nocb_poll
In addition, we have to make sure iommu is enabled for the generic vfi-pci driver used by DPDK. As this is also a kernel command line option, we do it here:
iommu=pt intel_iommu=on
One way of getting these command line options applied is to edit the "/etc/default/grub" file and execute the grub2-mkconfig -o /boot/grub2/grub.cfg command.
NOTE: After configuring the command line options, you MUST reboot the host!
Disable IRQs from happening on the dedicated CPUs by removing them from the smp_affinity mask. In addition, we also disable IRQ re-balancing, and the NMI watchdog interrupts:
systemctl disable irqbalance
systemctl stop irqbalance
echo 0 > /proc/sys/kernel/nmi_watchdog
for I in /proc/irq/[0-9]*; do
    echo fffff801 > ${I}/smp_affinity >/dev/null 2>&1
done
NOTE: With this approach, it needs to be done after every reboot!
Setting up the Open vSwitch dedicated physical interface
In the Open vSwitch DPDK configuration the physical interface is under the direct control of DPDK, hence it needs to be removed from the kernel. To do this we first need to figure out the interface's PCI address. An easy way of doing this is using the lshw utility:
# lshw -c network -businfo
Bus info          Device      Class          Description
========================================================
pci@0000:01:00.0  em1         network        82599ES 10-Gigabit SFI/SFP+ Network
pci@0000:01:00.1  em2         network        82599ES 10-Gigabit SFI/SFP+ Network
pci@0000:05:00.0  p5p1        network        Ethernet Controller XL710 for 40GbE
pci@0000:05:00.1  p5p2        network        Ethernet Controller XL710 for 40GbE
pci@0000:07:00.0  em3         network        I350 Gigabit Network Connection
pci@0000:07:00.1  em4         network        I350 Gigabit Network Connection
For our performance test, we would like to use the 40GbE interface p5p1. You could use the dpdk-devbind utility to bind the interface to DPDK; however, this configuration will not survive a reboot. The preferred solution is to use driverctl:
# driverctl -v set-override 0000:05:00.0 vfio-pci
driverctl: setting driver override for 0000:05:00.0: vfio-pci
driverctl: loading driver vfio-pci
driverctl: unbinding previous driver i40e
driverctl: reprobing driver for 0000:05:00.0
driverctl: saving driver override for 0000:05:00.0

# lshw -c network -businfo
Bus info          Device      Class          Description
========================================================
pci@0000:01:00.0  em1         network        82599ES 10-Gigabit SFI/SFP+ Network
pci@0000:01:00.1  em2         network        82599ES 10-Gigabit SFI/SFP+ Network
pci@0000:05:00.0              network        Ethernet Controller XL710 for 40GbE
pci@0000:05:00.1  p5p2        network        Ethernet Controller XL710 for 40GbE
pci@0000:07:00.0  em3         network        I350 Gigabit Network Connection
pci@0000:07:00.1  em4         network        I350 Gigabit Network Connection
NOTE: Make sure iommu is enabled as explained above.
Disable SELinux
There is work in progress for Open vSwitch DPDK to play nicely with SELinux, but for now, the easiest way is to disable it.
sed -i -e 's/SELINUX=enforcing/SELINUX=permissive/' /etc/selinux/config
setenforce permissive
Setting up Open vSwitch
Start Open vSwitch and enable DPDK
Start Open vSwitch, and automatically start it after every reboot:
systemctl enable openvswitch
systemctl start openvswitch
Now that it's fired up, let's enable DPDK and assign the PMD cores.
ovs-vsctl set Open_vSwitch . other_config:dpdk-init=true
ovs-vsctl set Open_vSwitch . other_config:dpdk-socket-mem=2048
ovs-vsctl set Open_vSwitch . other_config:dpdk-lcore-mask=0x2
ovs-vsctl set Open_vSwitch . other_config:pmd-cpu-mask=0x3c
systemctl restart openvswitch
Bridge configuration
For the Physical to Virtual back to Physical(PVP) test, we only need one bridge with two ports. In addition, we will configure our interfaces with 4 receive queues:
ovs-vsctl add-br br0 -- set bridge br0 datapath_type=netdev
ovs-vsctl add-port br0 dpdk0 -- set Interface dpdk0 type=dpdk -- \
  set Interface dpdk0 ofport_request=1
ovs-vsctl add-port br0 vhost0 -- set Interface vhost0 type=dpdkvhostuser -- \
  set Interface vhost0 ofport_request=2
ovs-vsctl set interface dpdk0 options:n_rxq=4 \
  other_config:pmd-rxq-affinity="0:2,1:3,2:4,3:5"
ovs-vsctl set interface vhost0 options:n_rxq=4 \
  other_config:pmd-rxq-affinity="0:2,1:3,2:4,3:5"
Also, we need to change access rights to the vhost0 socket:
chmod 777 /var/run/openvswitch/vhost0
Setting up the Virtual Machine
We will use virsh to manage the one Virtual Machine we use for looping back the traffic. The Virtual Machine will be an instance of Centos 7.3 which we get using virt-builder.
Download a Virtual Machine image
We will download the Virtual Machine qcow2 image using virt-builder, setting the root password to centos:
mkdir -p /opt/images
cd /opt/images
export LIBGUESTFS_BACKEND=direct
virt-builder centos-7.3 --root-password password:centos -o centos_loopback.qcow2 --format qcow2
Get the latest version of virt-manager
Now that we have the disk image, we need to create the Virtual Machine profile. We do this with virt-install, which we will install from its GIT repository:
cd ~
git clone https://github.com/virt-manager/virt-manager.git
cd ~/virt-manager
python setup.py --no-update-icon-cache install
Create and configure the Virtual Machine Profile
First, we need to start and enable libvirtd:
systemctl enable libvirtd.service
systemctl start libvirtd.service
Setup as much as possible with a single call to virt-install:
virt-install --connect=qemu:///system \
  --network vhostuser,source_type=unix,source_path=/var/run/openvswitch/vhost0,source_mode=client,model=virtio,driver_queues=4 \
  --network network=default \
  --name=centos_loopback \
  --disk path=/opt/images/centos_loopback.qcow2,format=qcow2 \
  --ram 4096 \
  --memorybacking hugepages=on,size=1024,unit=M,nodeset=0 \
  --vcpus=5,cpuset=6,7,8,9,10 \
  --check-cpu \
  --cpu Haswell-noTSX,cell0.id=0,cell0.cpus=0,cell0.memory=4194304 \
  --numatune mode=strict,nodeset=0 \
  --nographics --noautoconsole \
  --import \
  --os-variant=rhel7
We need to tweak some Virtual Machine profile settings manually, as not all options are available through virt-install. This is related to memory sharing, and pinning of the Virtual Machine to dedicated CPUs. We will do this using virsh edit. Below are the commands used, and the diff of the applied changes:
virsh shutdown centos_loopback
virsh edit centos_loopback

diff:
@@ -18,2 +18,8 @@
 <vcpu placement='static' cpuset='6-10'>5</vcpu>
+ <cputune>
+ <vcpupin vcpu='0' cpuset='6'/>
+ <vcpupin vcpu='1' cpuset='7'/>
+ <vcpupin vcpu='2' cpuset='8'/>
+ <vcpupin vcpu='3' cpuset='9'/>
+ <vcpupin vcpu='4' cpuset='10'/>
+ </cputune>
 <numatune>
@@ -32,3 +38,3 @@
 <numa>
- <cell id='0' cpus='0' memory='4194304' unit='KiB'/>
+ <cell id='0' cpus='0' memory='4194304' unit='KiB' memAccess='shared'/>
 </numa></pre>
This small start-up script will be copied to the Virtual Machine for ease of use:
cat << ENDL > start_testpmd.sh
depmod -a
modprobe uio_pci_generic
echo 2048 > /sys/kernel/mm/hugepages/hugepages-2048kB/nr_hugepages
driverctl -v set-override 0000:00:02.0 uio_pci_generic
(while sleep 1; do echo show port stats 0; done | \
testpmd -c 0x1f -n 4 --socket-mem 1024,0 -w 0000:00:02.0 -- --burst 64 \
  --disable-hw-vlan -i --rxq=4 --txq=4 --rxd=4096 --txd=1024 \
  --coremask=0x1e --auto-start --port-topology=chained)
ENDL
Tweak the virtual machine such that it will have the interfaces named trough network manager, and install the DPDK packages on the next boot.
LIBGUESTFS_BACKEND=direct virt-customize -d centos_loopback \
  --upload start_testpmd.sh:/root/ \
  --firstboot-command 'nmcli c | grep -o --  "[0-9a-fA-F]\{8\}-[0-9a-fA-F]\{4\}-[0-9a-fA-F]\{4\}-[0-9a-fA-F]\{4\}-[0-9a-fA-F]\{12\}" | xargs -n 1 nmcli c delete uuid' \
  --firstboot-command 'nmcli con add con-name ovs-dpdk ifname eth0 type ethernet ip4 1.1.1.1/24' \
  --firstboot-command 'nmcli con add con-name management ifname eth1 type ethernet' \
  --firstboot-command 'chmod +x /root/start_testpmd.sh' \
  --firstboot-command 'yum install -y https://copr-be.cloud.fedoraproject.org/results/tredaell/dpdk/epel-7-x86_64/00522541-dpdk/dpdk-16.11.1-1.el7.centos.x86_64.rpm' \
  --firstboot-command 'yum install -y https://copr-be.cloud.fedoraproject.org/results/tredaell/dpdk/epel-7-x86_64/00522541-dpdk/dpdk-tools-16.11.1-1.el7.centos.x86_64.rpm' \
  --firstboot-command 'yum install -y driverctl'
Running the test
Looping back the traffic
We will start the virtual machine, and once attached to the console we log in and start the loopback.
virsh start centos_loopback
virsh console centos_loopback
Connected to domain centos_loopback
Escape character is ^]

CentOS Linux 7 (Core)
Kernel 3.10.0-514.el7.x86_64 on an x86_64

localhost login: root
Password:
Last login: Tue May 23 03:45:40 on ttyS0
[root@localhost ~]# ./start_testpmd.sh
   46.684337] Generic UIO driver for PCI 2.3 devices version: 0.01.0
EAL: Detected 5 lcore(s)
EAL: Probing VFIO support...
[   50.563993] Bits 55-60 of /proc/PID/pagemap entries are about to stop being page-shift some time soon. See the linux/Documentation/vm/pagemap.txt for details.
EAL: WARNING: cpu flags constant_tsc=yes nonstop_tsc=no -> using unreliable clock cycles !
EAL: PCI device 0000:00:02.0 on NUMA socket -1
EAL:   probe driver: 1af4:1000 net_virtio
Interactive-mode selected
previous number of forwarding cores 1 - changed to number of configured cores 4
Auto-start selected
USER1: create a new mbuf pool : n=179456, size=2176, socket=0
Configuring Port 0 (socket 0)
Port 0: 52:54:00:A0:2A:FC
Checking link statuses...
Port 0 Link Up - speed 10000 Mbps - full-duplex
Done
Start automatic packet forwarding
io packet forwarding - ports=1 - cores=4 - streams=4 - NUMA support disabled, MP over anonymous pages disabled
Logical Core 1 (socket 0) forwards packets on 1 streams:
  RX P=0/Q=0 (socket 0) -> TX P=0/Q=0 (socket 0) peer=02:00:00:00:00:00
Logical Core 2 (socket 0) forwards packets on 1 streams:
  RX P=0/Q=1 (socket 0) -> TX P=0/Q=1 (socket 0) peer=02:00:00:00:00:00
Logical Core 3 (socket 0) forwards packets on 1 streams:
  RX P=0/Q=2 (socket 0) -> TX P=0/Q=2 (socket 0) peer=02:00:00:00:00:00
Logical Core 4 (socket 0) forwards packets on 1 streams:
  RX P=0/Q=3 (socket 0) -> TX P=0/Q=3 (socket 0) peer=02:00:00:00:00:00

  io packet forwarding - CRC stripping disabled - packets/burst=64
  nb forwarding cores=4 - nb forwarding ports=1
  RX queues=4 - RX desc=4096 - RX free threshold=0
  RX threshold registers: pthresh=0 hthresh=0 wthresh=0
  TX queues=4 - TX desc=1024 - TX free threshold=0
  TX threshold registers: pthresh=0 hthresh=0 wthresh=0
  TX RS bit threshold=0 - TXQ flags=0xf00
testpmd> show port stats 0

  ######################## NIC statistics for port 0  ########################
  RX-packets: 0          RX-missed: 0          RX-bytes:  0
  RX-errors: 0
  RX-nombuf:  0
  TX-packets: 0          TX-errors: 0          TX-bytes:  0

  Throughput (since last show)
  Rx-pps:            0
  Tx-pps:            0
  ############################################################################
testpmd>
The start_testpmd.sh shell script will query the statistics every second, so you can see the packet coming in and going out of the interface.
Configuring the traffic generator
We configure the traffic generator to send packets with the required packet size at wire speed. Note that Open vSwitch will probably not be able to handle this traffic volume, but that's the purpose of this test.
As mentioned earlier we will use UDP packets where only the Source and Destination address are changing. The MAC addresses and UDP ports are static.
Assuming we need 10 traffic streams, we will use these IP addresses:
- ip_src=1.0.0.0, ip_dst=2.0.0.0
- ip_src=1.0.0.1, ip_dst=2.0.0.1
- ip_src=1.0.0.2, ip_dst=2.0.0.2
- ip_src=1.0.0.3, ip_dst=2.0.0.3
- ip_src=1.0.0.4, ip_dst=2.0.0.4
- ip_src=1.0.0.5, ip_dst=2.0.0.5
- ip_src=1.0.0.6, ip_dst=2.0.0.6
- ip_src=1.0.0.7, ip_dst=2.0.0.7
- ip_src=1.0.0.8, ip_dst=2.0.0.8
- ip_src=1.0.0.9, ip_dst=2.0.0.9
Setting up the OpenFlow rules
Looking at the above 10 traffic streams, we need the following 20 OpenFlow rules (10 in each direction):
ovs-ofctl del-flows br0
ovs-ofctl add-flow br0 "in_port=1,eth_type(0x800),nw_src=1.0.0.0,nw_dst=2.0.0.0,action=2"
ovs-ofctl add-flow br0 "in_port=1,eth_type(0x800),nw_src=1.0.0.1,nw_dst=2.0.0.1,action=2"
ovs-ofctl add-flow br0 "in_port=1,eth_type(0x800),nw_src=1.0.0.2,nw_dst=2.0.0.2,action=2"
ovs-ofctl add-flow br0 "in_port=1,eth_type(0x800),nw_src=1.0.0.3,nw_dst=2.0.0.3,action=2"
ovs-ofctl add-flow br0 "in_port=1,eth_type(0x800),nw_src=1.0.0.4,nw_dst=2.0.0.4,action=2"
ovs-ofctl add-flow br0 "in_port=1,eth_type(0x800),nw_src=1.0.0.5,nw_dst=2.0.0.5,action=2"
ovs-ofctl add-flow br0 "in_port=1,eth_type(0x800),nw_src=1.0.0.6,nw_dst=2.0.0.6,action=2"
ovs-ofctl add-flow br0 "in_port=1,eth_type(0x800),nw_src=1.0.0.7,nw_dst=2.0.0.7,action=2"
ovs-ofctl add-flow br0 "in_port=1,eth_type(0x800),nw_src=1.0.0.8,nw_dst=2.0.0.8,action=2"
ovs-ofctl add-flow br0 "in_port=1,eth_type(0x800),nw_src=1.0.0.9,nw_dst=2.0.0.9,action=2"

ovs-ofctl add-flow br0 "in_port=2,eth_type(0x800),nw_src=1.0.0.0,nw_dst=2.0.0.0,action=1"
ovs-ofctl add-flow br0 "in_port=2,eth_type(0x800),nw_src=1.0.0.1,nw_dst=2.0.0.1,action=1"
ovs-ofctl add-flow br0 "in_port=2,eth_type(0x800),nw_src=1.0.0.2,nw_dst=2.0.0.2,action=1"
ovs-ofctl add-flow br0 "in_port=2,eth_type(0x800),nw_src=1.0.0.3,nw_dst=2.0.0.3,action=1"
ovs-ofctl add-flow br0 "in_port=2,eth_type(0x800),nw_src=1.0.0.4,nw_dst=2.0.0.4,action=1"
ovs-ofctl add-flow br0 "in_port=2,eth_type(0x800),nw_src=1.0.0.5,nw_dst=2.0.0.5,action=1"
ovs-ofctl add-flow br0 "in_port=2,eth_type(0x800),nw_src=1.0.0.6,nw_dst=2.0.0.6,action=1"
ovs-ofctl add-flow br0 "in_port=2,eth_type(0x800),nw_src=1.0.0.7,nw_dst=2.0.0.7,action=1"
ovs-ofctl add-flow br0 "in_port=2,eth_type(0x800),nw_src=1.0.0.8,nw_dst=2.0.0.8,action=1"
ovs-ofctl add-flow br0 "in_port=2,eth_type(0x800),nw_src=1.0.0.9,nw_dst=2.0.0.9,action=1"
Send the traffic
Start sending the traffic, and watch the return rate on the traffic generator. If traffic is not returning you could check the traffic hitting the OpenFlow rules:
# ovs-ofctl dump-flows br0
NXST_FLOW reply (xid=0x4):
 cookie=0x0, duration=13.670s, table=0, n_packets=21117649, n_bytes=2618588476, idle_age=0, ip,in_port=1,nw_src=1.0.0.0,nw_dst=2.0.0.0 actions=output:2
 cookie=0x0, duration=13.445s, table=0, n_packets=21092896, n_bytes=2615519104, idle_age=0, ip,in_port=1,nw_src=1.0.0.1,nw_dst=2.0.0.1 actions=output:2
 cookie=0x0, duration=13.229s, table=0, n_packets=19727728, n_bytes=2446238272, idle_age=0, ip,in_port=1,nw_src=1.0.0.2,nw_dst=2.0.0.2 actions=output:2
 cookie=0x0, duration=13.011s, table=0, n_packets=19474480, n_bytes=2414835520, idle_age=0, ip,in_port=1,nw_src=1.0.0.3,nw_dst=2.0.0.3 actions=output:2
 cookie=0x0, duration=12.362s, table=0, n_packets=8768808, n_bytes=1087332192, idle_age=0, ip,in_port=1,nw_src=1.0.0.4,nw_dst=2.0.0.4 actions=output:2
 cookie=0x0, duration=12.167s, table=0, n_packets=8749840, n_bytes=1084980160, idle_age=0, ip,in_port=1,nw_src=1.0.0.5,nw_dst=2.0.0.5 actions=output:2
 cookie=0x0, duration=11.976s, table=0, n_packets=19274081, n_bytes=2389986044, idle_age=0, ip,in_port=1,nw_src=1.0.0.6,nw_dst=2.0.0.6 actions=output:2
 cookie=0x0, duration=11.594s, table=0, n_packets=19241248, n_bytes=2385914752, idle_age=0, ip,in_port=1,nw_src=1.0.0.7,nw_dst=2.0.0.7 actions=output:2
 cookie=0x0, duration=11.416s, table=0, n_packets=8678017, n_bytes=1076074108, idle_age=0, ip,in_port=1,nw_src=1.0.0.8,nw_dst=2.0.0.8 actions=output:2
 cookie=0x0, duration=11.275s, table=0, n_packets=8670176, n_bytes=1075101824, idle_age=0, ip,in_port=1,nw_src=1.0.0.9,nw_dst=2.0.0.9 actions=output:2
 cookie=0x0, duration=11.095s, table=0, n_packets=20746433, n_bytes=2572557692, idle_age=0, ip,in_port=2,nw_src=1.0.0.0,nw_dst=2.0.0.0 actions=output:1
 cookie=0x0, duration=10.628s, table=0, n_packets=20664334, n_bytes=2562377416, idle_age=0, ip,in_port=2,nw_src=1.0.0.1,nw_dst=2.0.0.1 actions=output:1
 cookie=0x0, duration=10.570s, table=0, n_packets=17456255, n_bytes=2164575620, idle_age=0, ip,in_port=2,nw_src=1.0.0.2,nw_dst=2.0.0.2 actions=output:1
 cookie=0x0, duration=10.487s, table=0, n_packets=17441918, n_bytes=2162797832, idle_age=0, ip,in_port=2,nw_src=1.0.0.3,nw_dst=2.0.0.3 actions=output:1
 cookie=0x0, duration=10.405s, table=0, n_packets=8557728, n_bytes=1061158272, idle_age=0, ip,in_port=2,nw_src=1.0.0.4,nw_dst=2.0.0.4 actions=output:1
 cookie=0x0, duration=10.344s, table=0, n_packets=8551536, n_bytes=1060390464, idle_age=0, ip,in_port=2,nw_src=1.0.0.5,nw_dst=2.0.0.5 actions=output:1
 cookie=0x0, duration=10.261s, table=0, n_packets=17106209, n_bytes=2121169916, idle_age=0, ip,in_port=2,nw_src=1.0.0.6,nw_dst=2.0.0.6 actions=output:1
 cookie=0x0, duration=10.191s, table=0, n_packets=17074570, n_bytes=2117246680, idle_age=0, ip,in_port=2,nw_src=1.0.0.7,nw_dst=2.0.0.7 actions=output:1
 cookie=0x0, duration=10.158s, table=0, n_packets=8529608, n_bytes=1057671392, idle_age=0, ip,in_port=2,nw_src=1.0.0.8,nw_dst=2.0.0.8 actions=output:1
 cookie=0x0, duration=10.133s, table=0, n_packets=8523789, n_bytes=1056949836, idle_age=0, ip,in_port=2,nw_src=1.0.0.9,nw_dst=2.0.0.9 actions=output:1
In addition, you can check the testpmd statistics:
testpmd> show port stats 0

  ######################## NIC statistics for port 0  ########################
  RX-packets: 2278543290 RX-missed: 0          RX-bytes:  282539370192
  RX-errors: 0
  RX-nombuf:  0
  TX-packets: 2241649130 TX-errors: 0          TX-bytes:  277964492120

  Throughput (since last show)
  Rx-pps:     14337207
  Tx-pps:     14151789
  ############################################################################
Results
Below is a graph showing performance results for various packet sizes and number of traffic flows for the test methodology described in this blog. Note that this is NOT a zero packet loss test, as we are pushing packets at wire speed. The graph also shows the systems CPU usage during these tests. The CPU data was captured using the pidstat and mpstat utilities.
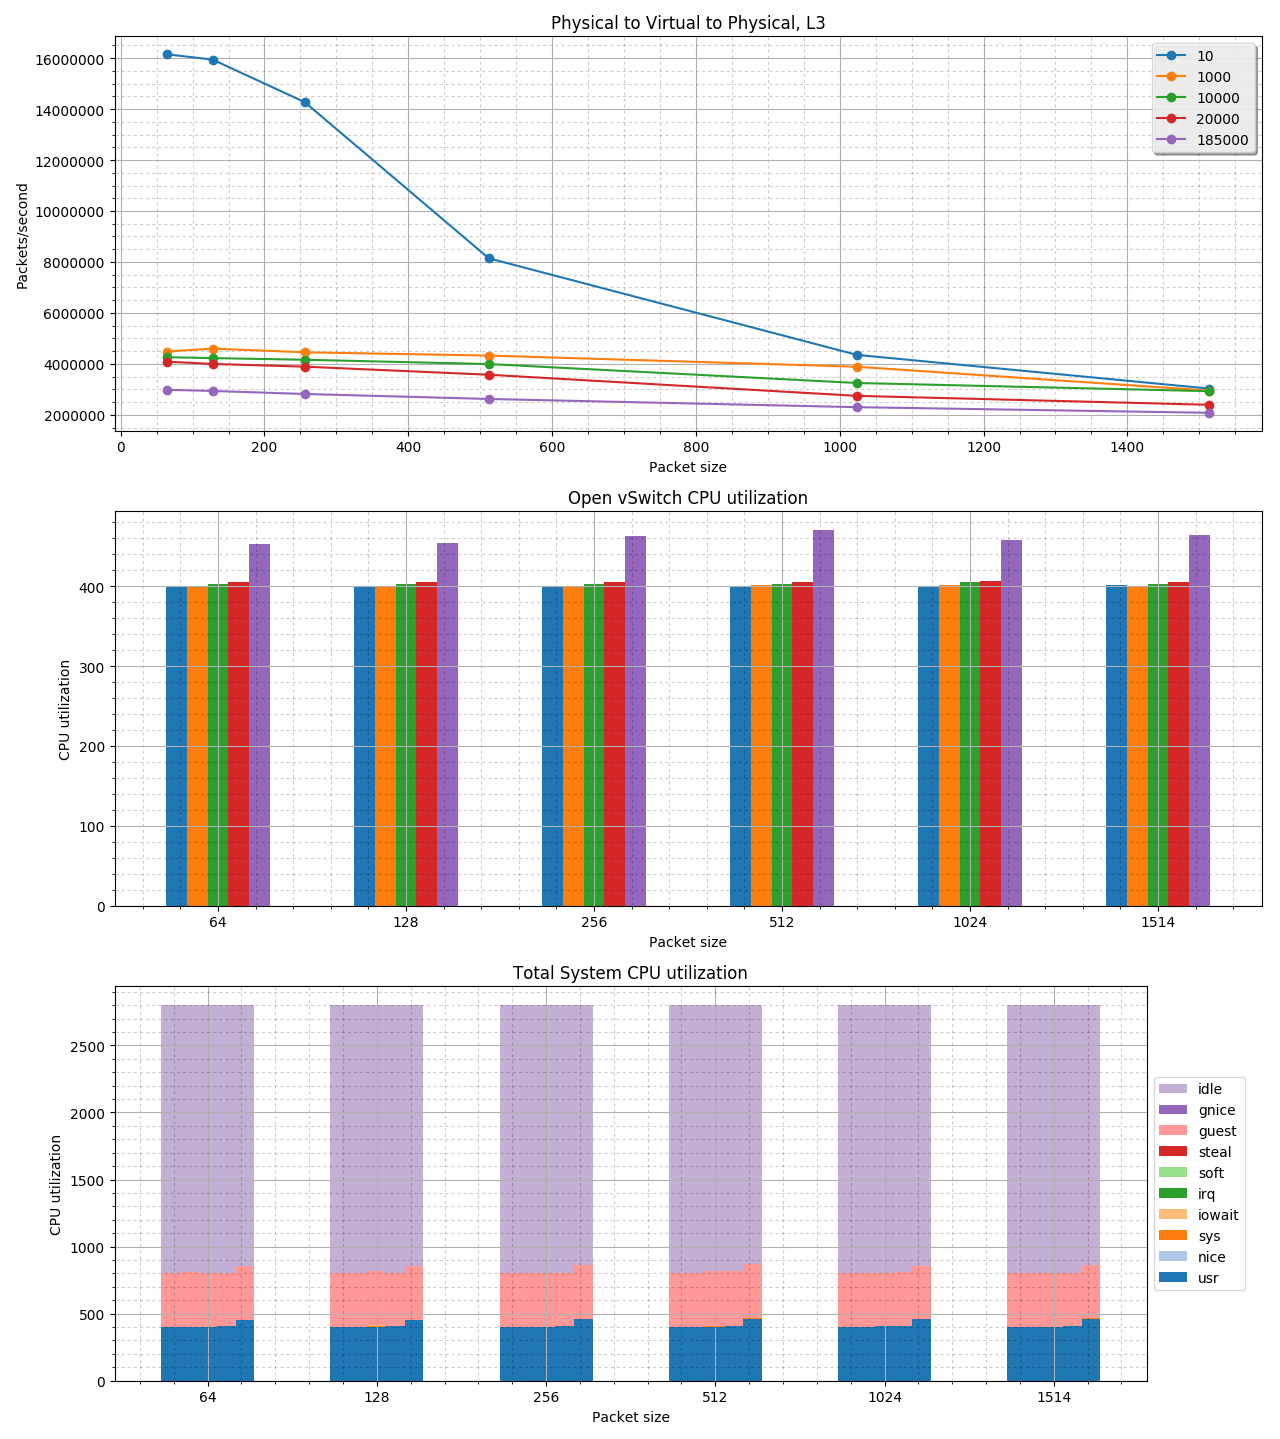
The following system configuration was used to gather these numbers and create the graph:
- Dell PowerEdge R730, single socket
- Intel Xeon E5-2690 v4 @ 2.60GHz
- 128G of system memory
- Intel XL710 2x 40G adapter
If you are thinking of using a PVP test to compare various versions of Open vSwitch, or various Open vSwitch hardware offload solutions, test them in such a way you are comparing apples to apples. To be more specific, on the same hardware configuration (or even better same machine). If you are comparing Open vSwitch DPDK versions, use the same number of PMD threads/interface queues. For testpmd on the Virtual Machine use the same options, i.e. a number of threads, interface queues, and the number of receive/transmit buffer descriptors, etc. etc., for all tests.
Last updated: February 22, 2024