Garbage collection is one of the great benefits of a high-level language. Garbage collection saves programmers from doing a lot of housekeeping, and it helps prevent the very serious errors that can arise from that housekeeping. However, garbage collection is performed by a background thread running at unpredictable times and can force the application to slow down or pause.
One of the most important aspects of performance in a production application is choosing the right garbage collector and configuring it optimally. Optimal choices depend on each application's behavior and requirements. Therefore, every Java developer should understand and follow recommended best practices for garbage collection.
This article is the beginning of a four-part series about garbage collection in Java. The article describes the process and different levels of garbage collection and offers a few ways to view garbage collection in action. Subsequent articles will delve into more detail, help you choose your garbage collector, and show you how to track its effects.
Read the series so far:
Part 1: Stages and levels of garbage collection
Part 2: How the JVM uses and allocates memory
Memory management and avoiding memory leaks
Memory management is the process of allocating new objects and deallocating or removing the objects when they are no longer needed. In C and C++, application programmers have to manually ensure memory management by freeing objects after they've been used. This manual task leads to high risks of a memory leak in the application because a developer may forget to delete objects after use. When an application suffers a memory leak, its memory consumption keeps growing and at a certain point the application might be unable to get free memory for allocating new objects. At that point, the application fails with an out-of-memory error. An even more debilitating error is referring to an object that the program has already freed; that can cause an immediate crash.
In contrast, languages such as Java run automated garbage collectors that remove each object from memory after its use. Java objects created by the application reside in a memory segment called the heap. As the program creates new objects and the heap gets full, the Java Virtual Machine (JVM) triggers garbage collection.
Basic garbage collection: Mark, sweep, compact
There are three basic steps in garbage collection:
- Mark: The garbage collector scans the heap memory segment and marks all the live objects—that is, objects to which the application holds references. All the objects that have no references to them are eligible for removal.
- Sweep: The garbage collector recycles all the unreferenced objects from the heap.
- Compact: The sweep step tends to leave many empty regions in heap memory, causing memory fragmentation. Therefore, the compact phase helps arrange the objects into the contiguous blocks at the start of the heap. This in turn helps with the allocation of new objects in sequence.
Garbage collection is more complicated than just running through these steps, however, because most objects are short-lived. Running the mark and compact steps frequently on all the objects on the heap would be inefficient and time-consuming. So, let's look at a more sophisticated garbage collection algorithm.
Generational garbage collection
To handle short-lived objects efficiently, we expand the simple garbage collection sequence I've just described by adding different levels for objects that have been present for different lengths of time. This algorithm is called generational garbage collection.
Generational garbage collection divides heap memory into two major partitions, the young (also called nursery) generation and the old (also called tenured) generation. There are also several types of garbage collection: minor collections for the young generation, major collections for the old generation, and full collections that do both minor and major collections along with compacting.
Young objects
All new objects are initially allocated to the young generation, which is subdivided into two partitions: Eden and survivor. The Eden partition is where all objects are put when they are new. After each cycle of garbage collection, all objects that remain in the Eden partition are moved to the survivor partition.
The survivor partition is further divided into two partitions called S0 and S1, also known as the FromSpace and the ToSpace.
The normal flow of object allocation is:
- At first, all the new objects are allocated in the Eden partition, while both survivor partitions are empty.
- When the Eden partition has filled up, causing a new allocation to fail, the JVM launches a minor garbage collection. After objects that are no longer needed are removed, all live objects are marked and moved to the S0 partition. Thus, the Eden partition is cleared while S1 is still empty.
- The next time Eden fills up and another minor garbage collection takes place, it marks all the live objects in the Eden and S0 partitions. Then all the live objects from Eden and S0 are moved into S1. Eden and S0 are left empty. At any given time, one of the survivor partitions (S0 or S1) is always empty.
- The next minor garbage collection carries out the same process as the one in Step 3, but moves objects from S1 to S0 instead of from S0 to S1. All the live objects are left in S0.
After the sequence just described, minor garbage collections alternate between Steps 3 and 4. After multiple minor garbage collections, when objects become long-lived in the young generation, they become eligible for promotion to the old generation.
Old objects
Garbage collections in the old generation are called major garbage collections, and perform marks and sweeps.
A full garbage collection cleans up both the young and old generations. It promotes all the live objects from the young generation to the old generation and compacts the old generation. A full garbage collection causes a stop-the-world pause to the application, to ensure that no new objects are allocated on the heap memory and that no existing objects become unreachable while the full garbage collection is performed.
Although garbage collection happens automatically in Java, one can explicitly ask the JVM to do a garbage collection with the System.gc() or Runtime.gc() methods. However, these methods don't guarantee garbage collection; it's totally dependent on the JVM. Requesting garbage collection with these methods is discouraged.
Monitoring garbage collection activity and heap use
There are several ways to monitor garbage collection activities and heap memory use.
Garbage collection logging
Garbage collection logs are often helpful in troubleshooting performance issues related to memory. These logs do not impose major overhead on the server, so enabling them is recommended in a production environment for the purpose of debugging. The document How do I enable Java garbage collection logging? explains how to enable garbage collection logs.
Monitoring garbage collection with jstat
The jstat command-line utility can be used to monitor garbage collection activity such as heap memory use, metaspace use, number of minor, major, and full garbage collection events, and garbage collection time. Run the following command, replacing $JAVA_PID with your application's process ID:
jstat -gc $JAVA_PID
Figure 1 illustrates the output.

Monitoring garbage collection with the jconsole user interface
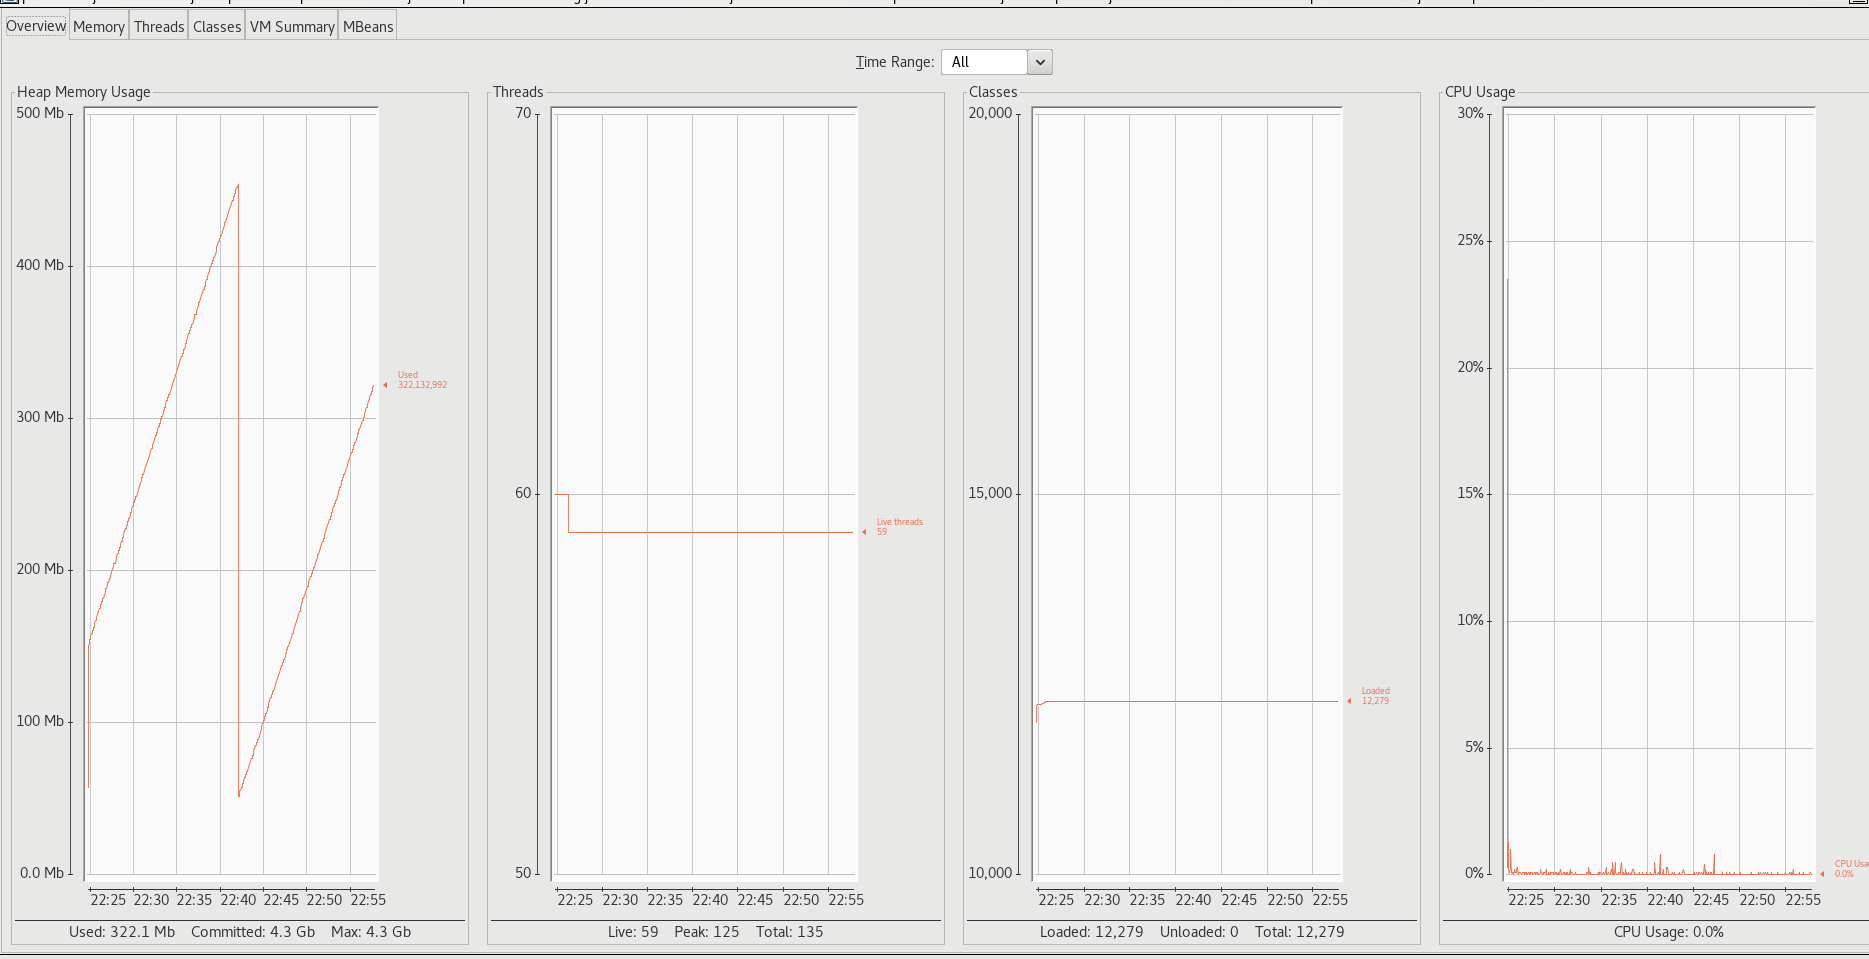
The jconsole command launches a graphical interface that shows aspects of a running Java application. You can monitor memory use, thread use, and CPU use there, as shown in Figure 2.
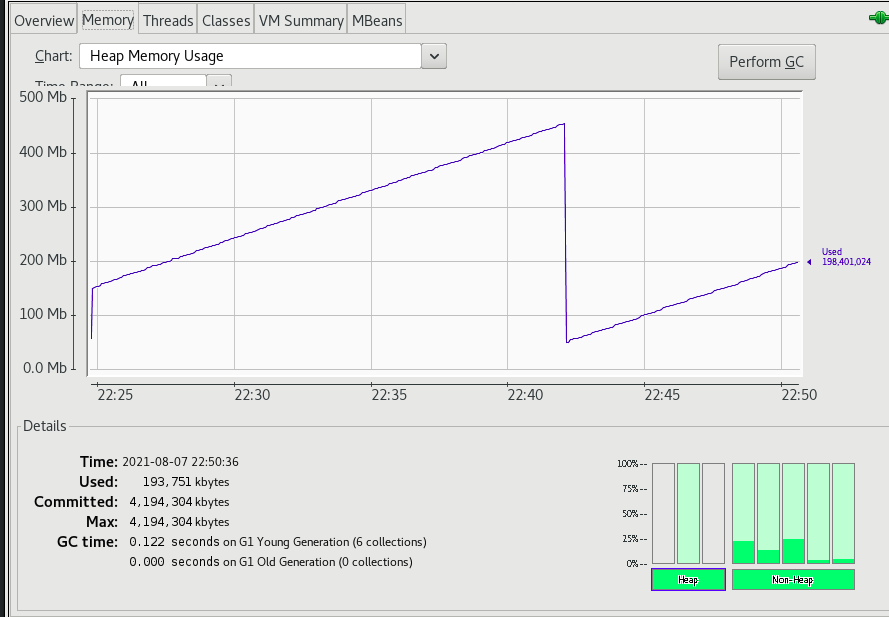
You can also trigger garbage collection from jconsole, as shown in Figure 3.
Conclusion
Memory management in Java is an automatic process that helps in allocating objects and deallocating them after use. Generational garbage collection classifies objects based on their lifespans and allocates objects accordingly to different generations. A number of tools let you monitor heap use and garbage collection.
Look for the next article in this series, which covers memory use in the JVM and its relationship to garbage collection.
Last updated: September 19, 2022