This is the second article in a series that explains garbage collection in Java and how to tweak it for optimal Java application performance. The previous article introduced the stages and levels of garbage collection (including generational garbage collection) and showed how to check garbage collection behavior in your applications. This article goes into more depth about memory use in the Java Virtual Machine (JVM) and how to control it.
Tracking memory use in the JVM
Garbage collection can have a negative and unpredictable impact on Java application performance if it is improperly tuned. For instance, when full collection events happen too often, they cause high CPU usage on the application server, resulting in poor application request processing.
If garbage collections are happening too often or contributing to a significant percentage of your CPU, the first thing to do is check whether your application is allocating memory unnecessarily. Excessive allocation is often due to a memory leak.
Next, test your application with the expected production load in a development environment to determine the maximum heap memory usage. Your production heap size should be at least 25% to 30% higher than the tested maximum to allow room for overhead.
Detecting out-of-memory errors
Enabling the -XX:HeapDumpOnOutOfMemoryError option generates a heap dump when an allocation from the Java heap could not be satisfied and the application fails with an OutOfMemoryError. The heap dump can help you find the cause.
The -XX:HeapDumpOnOutOfMemoryError option provides critical information about out-of-memory errors. Configuring the option doesn't have any performance impact on your environment, so you can enable it in a production environment. Having this option on is always recommended.
By default, the heap dump is created in a file called java_pidpid.hprof in the JVM's working directory. You can specify an alternative filename or directory with the -XX:HeapDumpPath option. You can also observe peak heap memory usage using JConsole. Also, see How to monitor Java memory usage of heap/permanent generation and gc activities.
Analyzing the heap dump
The heap dump can show whether large objects were retained for a long time. Sometimes, to find the cause of retention, you need to understand the application code and the circumstances that caused the out-of-memory error. The problem might be caused by a memory leak in the application code; otherwise, the problem is probably inadequate memory allocated for the application's peak loads.
Reasons for retaining large objects include:
- Single objects that absorb all the heap memory allocated to the JVM.
- Many small objects retaining memory.
- Large retention by a single thread, perhaps the thread associated with the
OutOfMemoryError.
After you've identified the source of the large retention, view the paths from the garbage collection roots to see what is keeping the objects alive. The garbage collection roots are objects outside the heap and therefore are never collected. The path to the garbage collection roots shows the reference chain that prevents the object on the heap from being garbage collected. The article 10 Tips for using the Eclipse Memory Analyzer offers advice for analyzing heap dumps and memory leaks in the Eclipse Memory Analyzer.
Also, see How do I analyze a Java heap dump for more details on analyzing the heap dump. If the application code is not the problem, increase the size of the Java heap to meet the load requirement.
JVM options that affect memory use
Parameters affecting the memory available to the JVM include:
-Xms: Sets the minimum and initial size of the heap.-Xmx: Sets the maximum size of the heap.-XX:PermSize: Sets the initial size of the Permanent Generation (perm) memory area. This option was available prior to JDK 8 but is no longer supported.-XX:MaxPermSize: Sets the maximum size of the perm memory area. This option was available prior to JDK 8 but is no longer supported.-XX:MetaspaceSize: Sets the initial size of Metaspace. This option is available starting in JDK 8.-XX:MaxMetaspaceSize: Sets the maximum size of Metaspace. This option is available starting in JDK 8.
Production environments often set the -Xms and -Xmx options to the same value so that the heap size is fixed and pre-allocated to the JVM.
See Oracle's list of java command options for more information about different JVM options and their use.
Calculating JVM memory consumption
Many programmers figure out the maximum heap value for their application's JVM correctly but discover that the JVM is using even more memory. The value of the -Xmx parameter specifies the maximum size of the Java heap, but that is not the only memory consumed by the JVM. Permanent Generation (the name prior to JDK 8) or Metaspace (the name from JDK 8 onward), the CodeCache, the native C++ heap used by other JVM internals, space for the thread stacks, direct byte buffers, garbage collection overhead, and other things are counted as part of the JVM's memory consumption.
You can calculate the memory used by a JVM process as follows:
JVM memory = Heap memory+ Metaspace + CodeCache + (ThreadStackSize * Number of Threads) + DirectByteBuffers + Jvm-native
Therefore, JVM memory usage can be more than the -Xmx value under peak business load.
Components of JVM memory consumption
The following list describes three important components of JVM memory:
- Metaspace: Stores information about the classes and methods used in the application. This storage area was called Permanent Generation or perm in the HotSpot JVM prior to JDK 8, and the area was contiguous with the Java heap. From JDK 8 onward, Permanent Generation has been replaced by Metaspace, which is not contiguous with the Java heap. Metaspace is allocated in native memory. The
MaxMetaspaceSizeparameter limits the JVM's use of Metaspace. By default, there is no limit for Metaspace, which starts with a very low size default and grows gradually as needed. Metaspace contains only class metadata; all live Java objects are moved to heap memory. So the size of Metaspace is much lower than Permanent Generation was. Usually, there is no need to specify the maximum Metaspace size unless you face a large Metaspace leak. - CodeCache: Contains native code generated by the JVM. The JVM generates native code for a number of reasons, including the dynamically generated interpreter loop, Java Native Interface (JNI) stubs, and Java methods that are compiled into native code by the Just-in-Time (JIT) compiler. The JIT compiler is the major contributor to the CodeCache area.
- ThreadStackSize: Sets the thread stack size in bytes by using the
-XX:ThreadStackSize=<size>option, which can also be specified as-Xss=<size>. Append the letterkorKto indicate kilobytes;morMto indicate megabytes; orgorGto indicate gigabytes. The default value for-XX:ThreadStackSizedepends on the underlying operating system and architecture.
How to check the thread stack size
You can check the current thread stack size with:
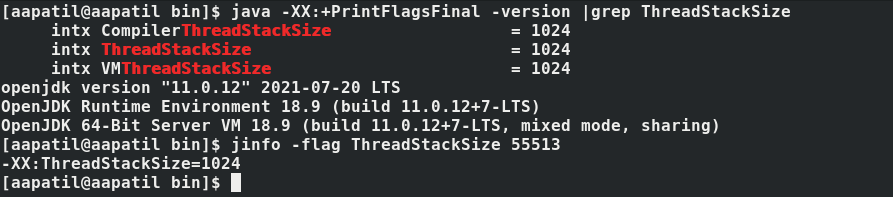
$ jinfo -flag ThreadStackSize JAVA_PID
Use the following command to check the default thread stack size:
$ java -XX:+PrintFlagsFinal -version |grep ThreadStackSize
Figure 1 shows the thread stack sizes displayed by the previous command.
Conclusion
Setting up the heap size in accordance with application requirements is the first step in configuring heap settings. The option limits the heap size. However, the JVM requires more memory beyond the heap size, including Metaspace, CodeCache, thread stack size, and native memory. So when you consider the JVM's memory usage, be sure to include these other parts of memory consumption.
The next article in this series covers the different garbage collectors and guidelines for choosing the best one for your application.
Last updated: October 20, 2023