Do you have a Java application that runs fine at first but slows down after a while, or it runs fine for a small number of files but performance degrades for large number of files? Maybe you have a memory leak.
About
When fixing memory leaks; If someone were to ask me: "If you knew back then what you know now, what would you tell yourself?". Well, I would say.....
Target Audience
While in general the approach described in this article is IDE & OS independent, I used Linux [Fedora] and Eclipse [Plugin development] in the screenshots & instructions.
Symptoms of a Memory leak
Works fast at first, but slows over time.
- Works fine with small data sets, severe performance issues with large data sets
- Ever increasing Old-Generation memory usage in your JVM
- Out-of-Memory Heap errors in your JVM
- Spontaneous crashes.
Common Memory leaks
A memory leak in Java (who would've thought heh?) can occur if you forget to close a resource, or a reference to an object is not released. e.g.
- File/Text buffers not closed. (as was in my case)
- Hash maps keeping references alive if
equals() and hashcode()are not implemented, e.g. -
import java.util.Map; public class MemLeak { public final String key; public MemLeak(String key) { this.key = key; } public static void main(String args[]) { try { Map map = System.getProperties(); for(;;) { map.put(new MemLeak("key"), "value"); } } catch(Exception e) { e.printStackTrace(); } } } - Inner classes that reference outer classes can leak. (make them static to avoid).
How does one go about fixing them?
There are two approaches. The first is a 'quick fix' attempt. If that fails then you'll have to go down the long road.
- 1) Quick fix: Eclipse Memory Leak Warnings (catches some leaks)
- 2) Manually disable & enable parts of your code and observe memory usage of your JVM using a JVM tool like VisualVM (or Jconsole, or Thermostat).
1) Quick fix: Eclipse Memory Leak warning/errors.
For code with JDK 1.5+ compliance, eclipse will throw warnings and errors at you for obvious cases of leaks. To be more precise, anything that implements closable (since 1.5) (e.g outputstream since 1.5) will throw a warning at you if its reference is destroyed but the object is not closed. However, the leak-detection isn't always enabled in eclipse projects. You might have to turn them on first. Go to your project settings and enable them as demonstrated:
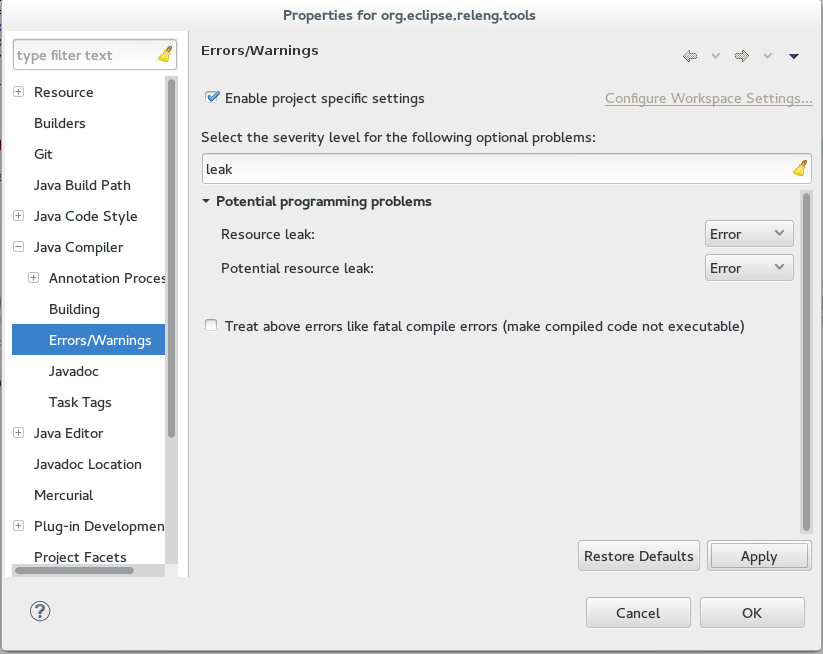
Now eclipse will outline memory leaks:
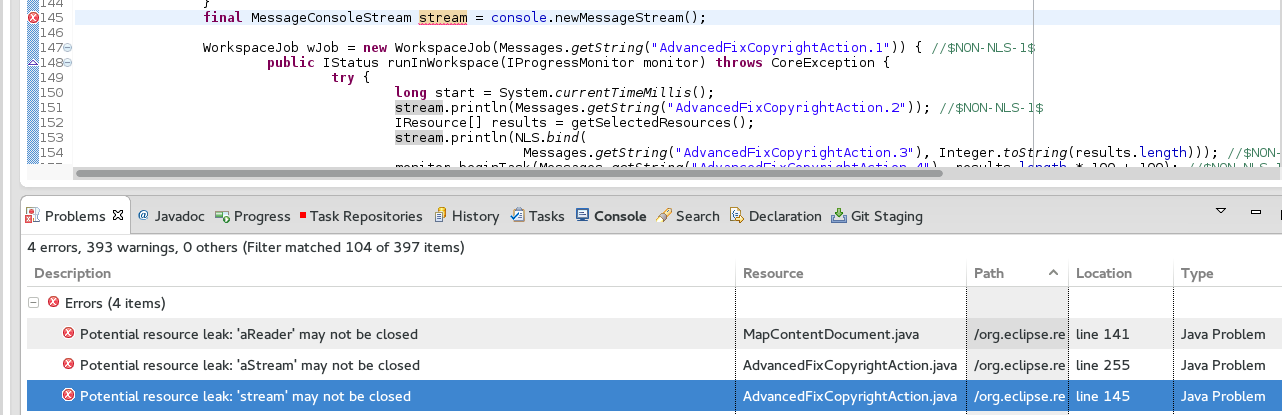
However, even with fancy Eclipse hocus pocus, not all file closures and leaks are detected. Especially when working with legacy (pre 1.5) code, you'll likely run into leaks because those were written before 'closable' was implemented. Or sometimes file opening/closures are nested so deeply that eclipse won't detect them. If you're in this place, you may want to try step 2.
2) Manually disable & enable parts of your code and observe memory usage of your JVM using a JVM tool like VisualVM.
If you got this far then you'll have to roll up your selves and do some manual labor. You could read all of your code and try to understand where the leak occurs. To help you with this process: I recommend to try using a tool like VisualVM. (But Thermostat and MAT also work.)
Configure VisualVM
- Download the tool
- Open terminal, navigate to .../visualvm_xyz/bin run the shell script
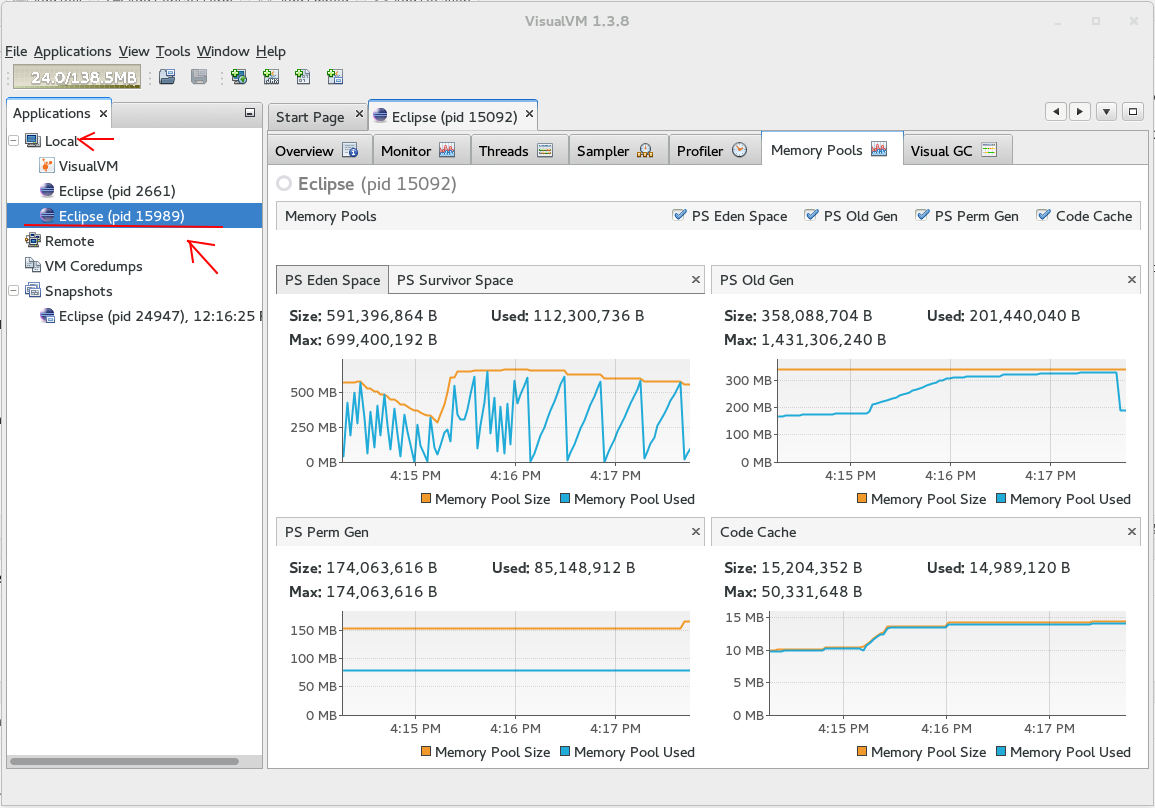
'./visualvm'(or visualvm.exe on windows). - You should see the main window. If you expand 'local' and double click on your running application (a child eclipse in my case), you can see its properties.
- Troubleshooting VisualVM on Fedora (skip this if it works well: For me, initially I couldn't connect to my JVM's, I couldn't take heap-dumps and profiling didn't work either. Here are some steps that might help:
- Make sure that you run it as your own user and not sudo.
- Perform a full update of your system
(sudo yum update). - Reboot helps :)
- Try to close all running Java applications. Launch VisualVM, then try your luck again.
- Add some plugins. Before VisualVM became useful to me, I first had to add some plugins. Go to Tools -> Plugins -> 'Available Plugins'. Select these plugins (feel free to browse and add more if you like):
- Memory Pools
- Visual GC
- Kill Application


Analyze running code with visualvm
- Now run your Java application,
- Attach VisualVM to your application.
- Perform the operation that causes the sluggish performance.
- Inspect the 'Monitor' and the 'memory pools' tab. If you see that your memory increases in the 'Monitor' tab, try pressing 'Perform GC' (garbage collection) and see if that decreases memory usage.
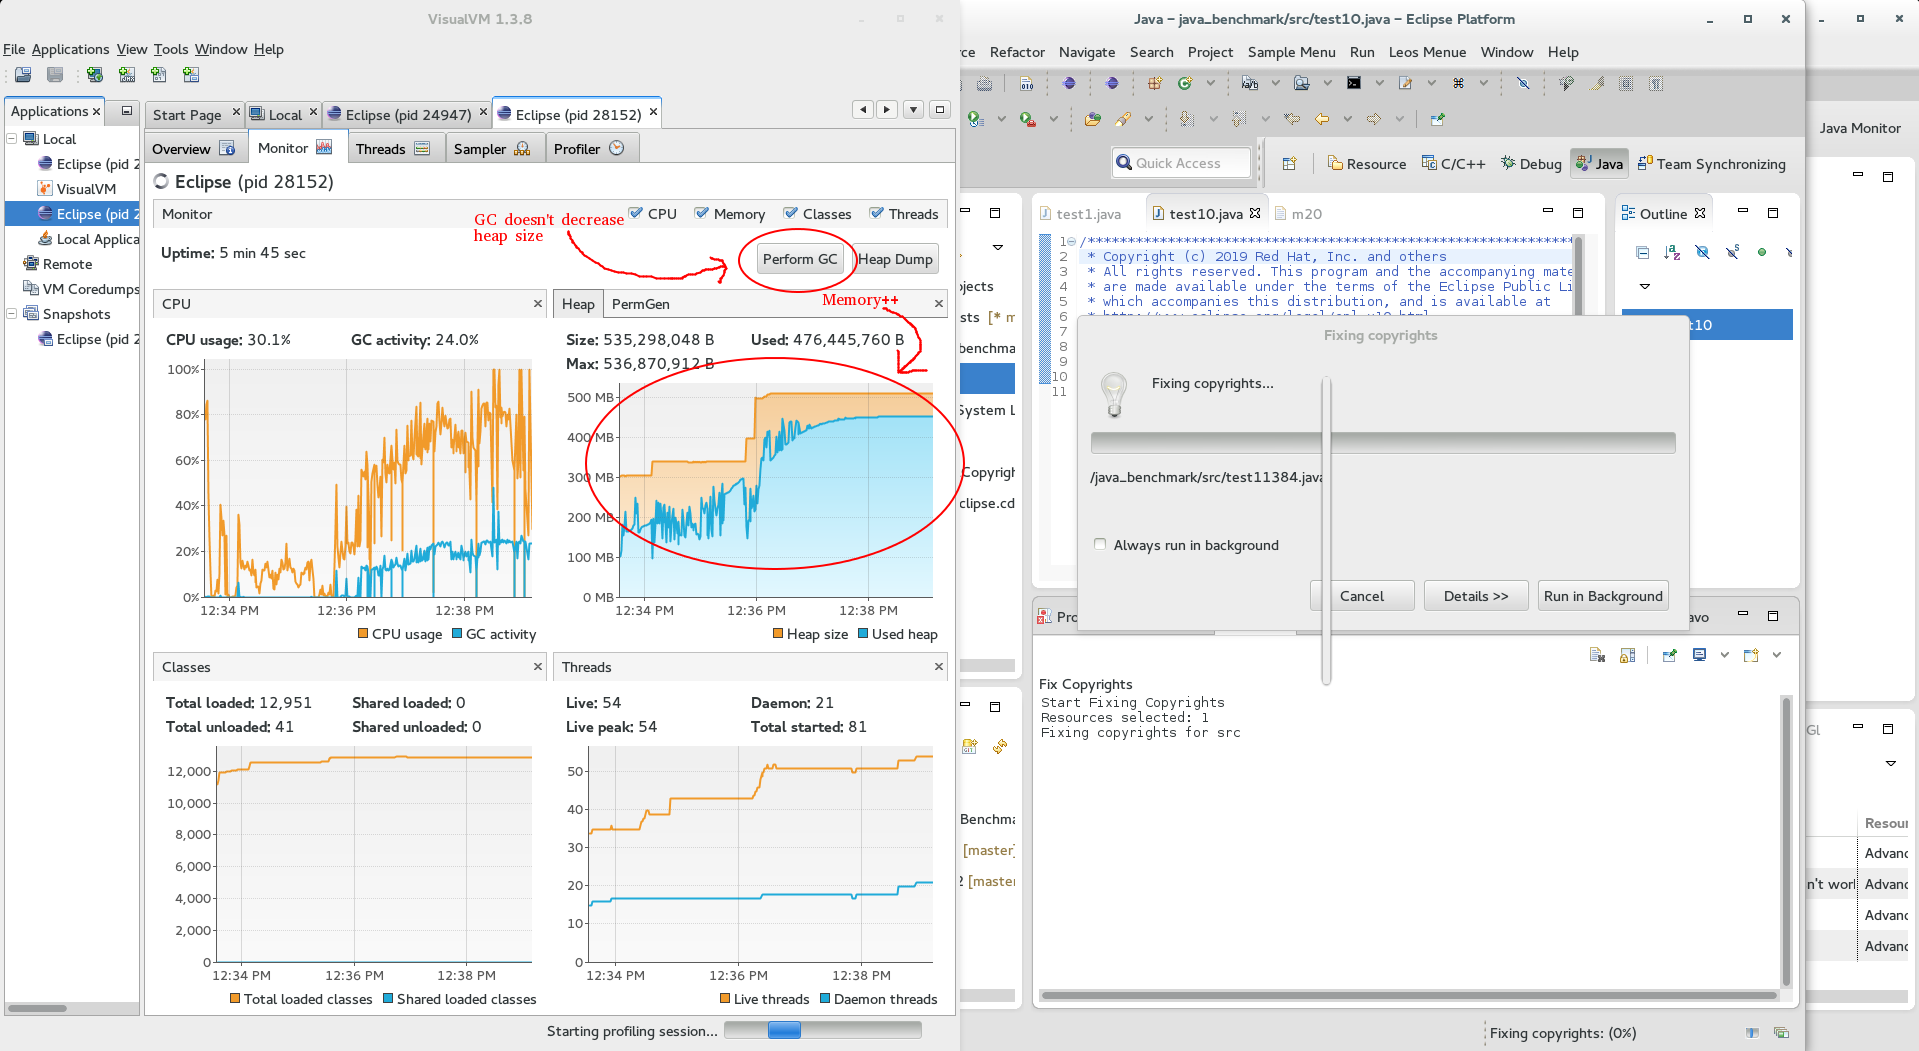 If not...
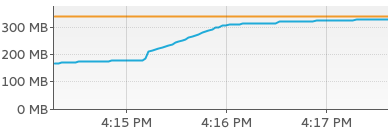
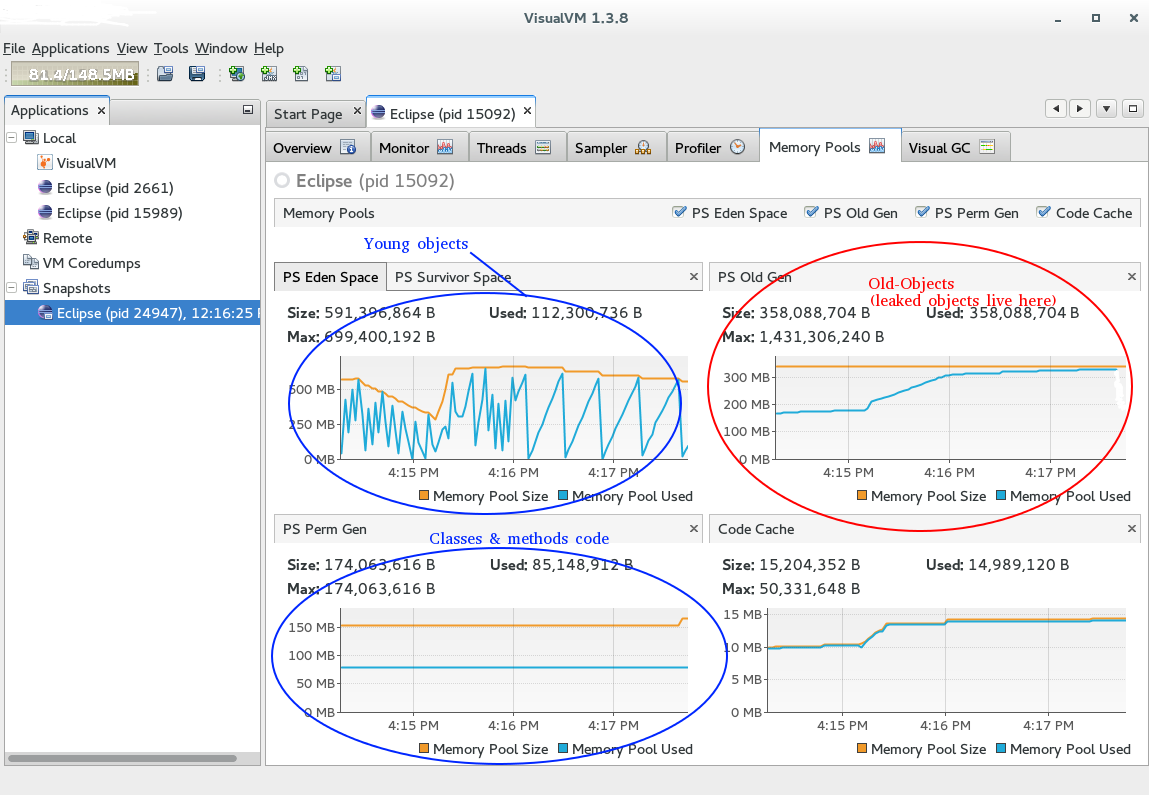
 - Then switch over to the 'memory pools' tab and inspect the 'Old Gen'. (Objects first hang around in "Eden", then transition through Survivor spaces, older objects move into the 'Old Gen' Pool. If something leaks, it'll be in the Old-Gen pool. Details)

- Now go back and comment out most of the code of your program to the point where the application just start & stops.
- Repeat until the application doesn't leak at all.
- Then through several iterations re-enable parts of your code and inspect VisualVM memory usage. When your application starts to leak again, go into the method that caused the memory leaks and narrow down further.
- Eventually you'll narrow down the problem to a single class, perhaps even a single method. Once you're there, carefully validate that all file-buffers are closed and Hashmaps are used properly.

Benchmarking your code
Sometimes it's hard to tell if your shiny new code is any better than the old code. In this case you may want to benchmark the performance of your application. Here is some code that you can insert into the right place to get info about run-time and number of garbage collection runs:
long start = System.currentTimeMillis();
..
 //your code
..
long end = System.currentTimeMillis();
System.out.println("Run time: " + Long.toString(end - start));
System.out.println(printGCStats());

public static String printGCStats() {
 long totalGarbageCollections = 0;
 long garbageCollectionTime = 0;
 for (GarbageCollectorMXBean gc : ManagementFactory.getGarbageCollectorMXBeans()) {
 long count = gc.getCollectionCount();

 if (count >= 0) {
 totalGarbageCollections += count;
 }

 long time = gc.getCollectionTime();

 if (time >= 0) {
 garbageCollectionTime += time;
 }
 }
 return "Garbage Collections: " + totalGarbageCollections + "n" +
 "Garbage Collection Time (ms): " + garbageCollectionTime;
}
As a note, if you test in your main Eclipse, it's recommended to test in a 'clean' child Eclipse instead. Or in some 'clean' instance of your Eclipse, because other plugins will get in the way of accurate timing.
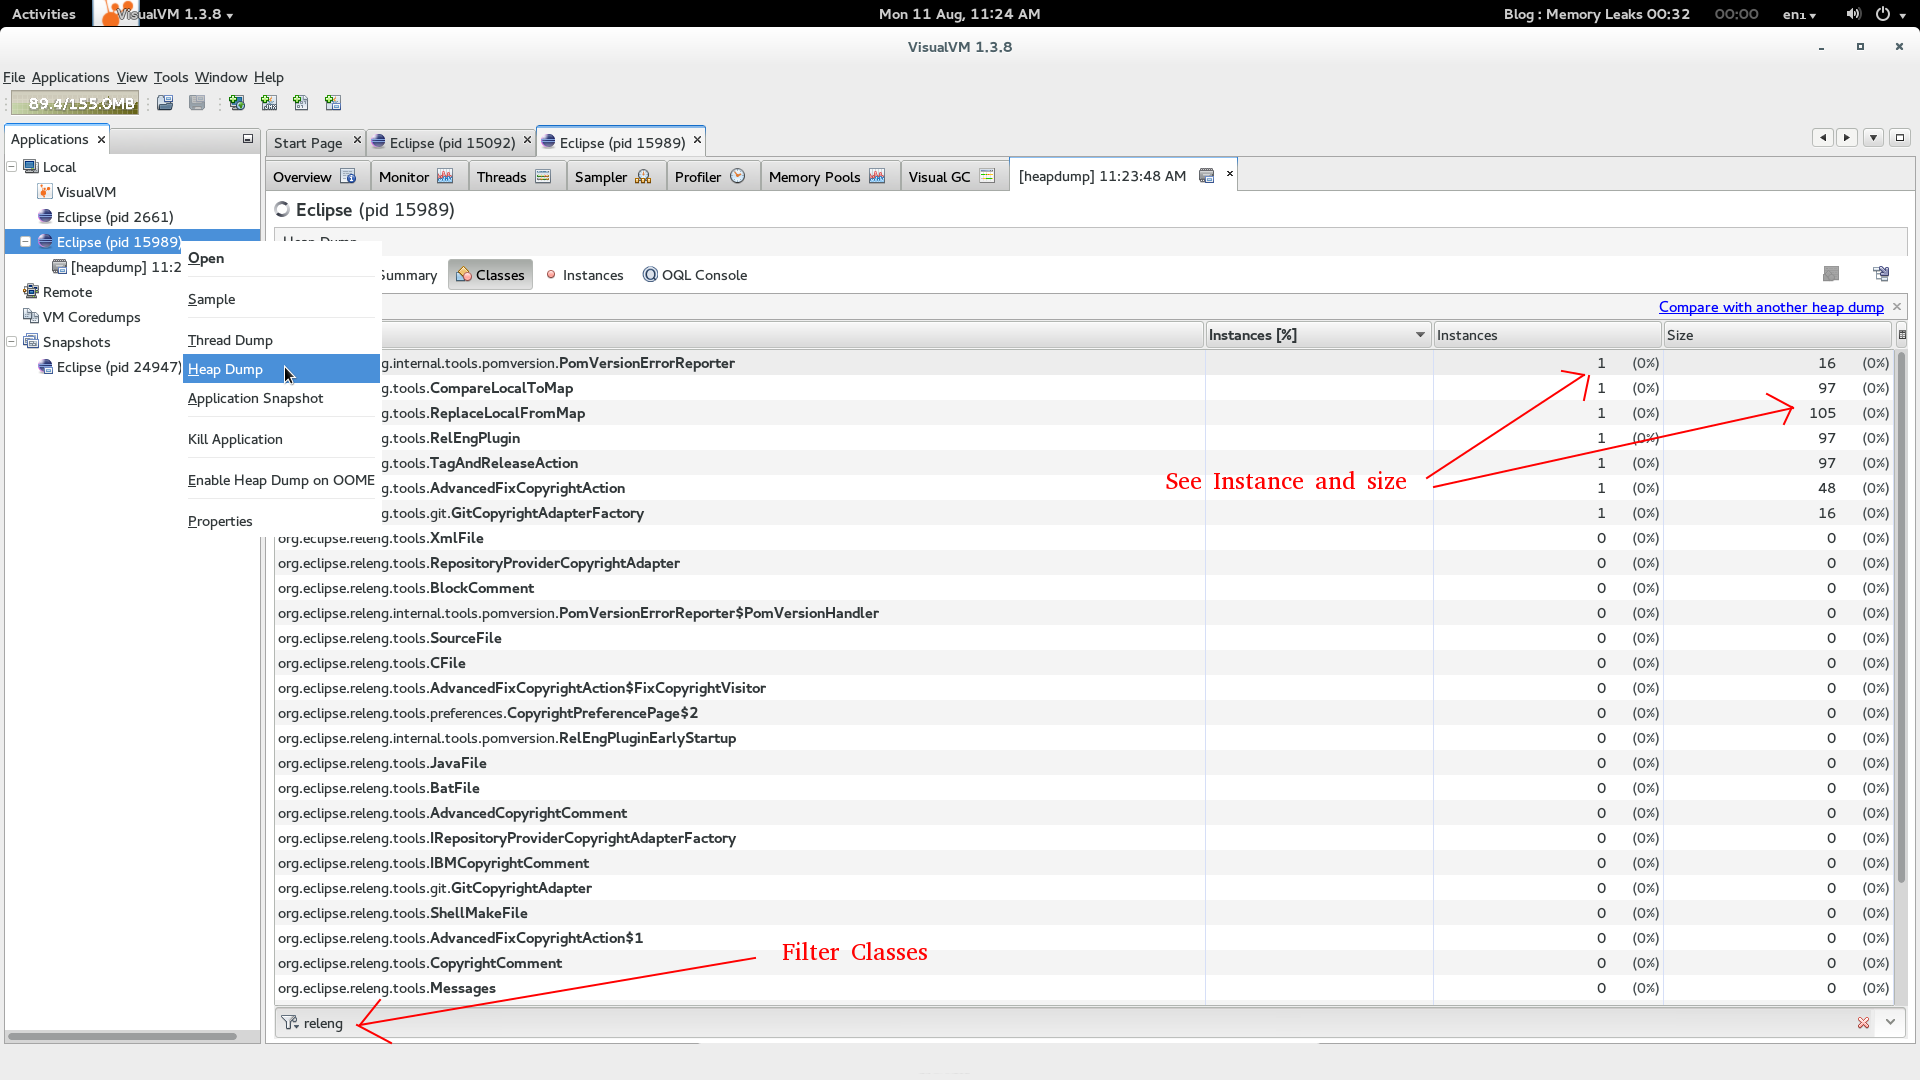
Additional help: Heap dumps
I personally haven't used this much, but folks rave about 'Heap-dumps'. At any time, you can take a heap-dump and then see how many instances of classes are open and how much space they utilize. You can double click on them to see their content. This is useful if you want to see how many objects your application generates.
Hold on, my application doesn't have leaks but it's still slow?
It's possible that you don't have any leaks in your code, but it's still very slow. In this case you'll have to profile your code. Code profiling is out of the scope of this article, but there is a great youtube lecture that explains how you can profile with Eclipse using free and paid profilers.
Where to go from here?
At this stage, try to spend a day or two actually fixing your memory leak. If you still have troubles, try reading some of these articles:
- Hunting Memory Leaks
- Memory leaks in Inner classes and this is also useful.
- The profiling youtube lecture mentioned above
- Skim over oracle's JVM GC guide.
Last updated: February 22, 2024