Redhat Developers  Logo
  • Products

    Featured

    • Red Hat Enterprise Linux
      Red Hat Enterprise Linux Icon
    • Red Hat OpenShift AI
      Red Hat OpenShift AI
    • Red Hat Enterprise Linux AI
      Linux icon inside of a brain
    • Image mode for Red Hat Enterprise Linux
      RHEL image mode
    • Red Hat OpenShift
      Openshift icon
    • Red Hat Ansible Automation Platform
      Ansible icon
    • Red Hat Developer Hub
      Developer Hub
    • View All Red Hat Products
    • Linux

      • Red Hat Enterprise Linux
      • Image mode for Red Hat Enterprise Linux
      • Red Hat Universal Base Images (UBI)
    • Java runtimes & frameworks

      • JBoss Enterprise Application Platform
      • Red Hat build of OpenJDK
    • Kubernetes

      • Red Hat OpenShift
      • Microsoft Azure Red Hat OpenShift
      • Red Hat OpenShift Virtualization
      • Red Hat OpenShift Lightspeed
    • Integration & App Connectivity

      • Red Hat Build of Apache Camel
      • Red Hat Service Interconnect
      • Red Hat Connectivity Link
    • AI/ML

      • Red Hat OpenShift AI
      • Red Hat Enterprise Linux AI
    • Automation

      • Red Hat Ansible Automation Platform
      • Red Hat Ansible Lightspeed
    • Developer tools

      • Red Hat Trusted Software Supply Chain
      • Podman Desktop
      • Red Hat OpenShift Dev Spaces
    • Developer Sandbox

      Developer Sandbox
      Try Red Hat products and technologies without setup or configuration fees for 30 days with this shared Openshift and Kubernetes cluster.
    • Try at no cost
  • Technologies

    Featured

    • AI/ML
      AI/ML Icon
    • Linux
      Linux Icon
    • Kubernetes
      Cloud icon
    • Automation
      Automation Icon showing arrows moving in a circle around a gear
    • View All Technologies
    • Programming Languages & Frameworks

      • Java
      • Python
      • JavaScript
    • System Design & Architecture

      • Red Hat architecture and design patterns
      • Microservices
      • Event-Driven Architecture
      • Databases
    • Developer Productivity

      • Developer productivity
      • Developer Tools
      • GitOps
    • Secure Development & Architectures

      • Security
      • Secure coding
    • Platform Engineering

      • DevOps
      • DevSecOps
      • Ansible automation for applications and services
    • Automated Data Processing

      • AI/ML
      • Data Science
      • Apache Kafka on Kubernetes
      • View All Technologies
    • Start exploring in the Developer Sandbox for free

      sandbox graphic
      Try Red Hat's products and technologies without setup or configuration.
    • Try at no cost
  • Learn

    Featured

    • Kubernetes & Cloud Native
      Openshift icon
    • Linux
      Rhel icon
    • Automation
      Ansible cloud icon
    • Java
      Java icon
    • AI/ML
      AI/ML Icon
    • View All Learning Resources

    E-Books

    • GitOps Cookbook
    • Podman in Action
    • Kubernetes Operators
    • The Path to GitOps
    • View All E-books

    Cheat Sheets

    • Linux Commands
    • Bash Commands
    • Git
    • systemd Commands
    • View All Cheat Sheets

    Documentation

    • API Catalog
    • Product Documentation
    • Legacy Documentation
    • Red Hat Learning

      Learning image
      Boost your technical skills to expert-level with the help of interactive lessons offered by various Red Hat Learning programs.
    • Explore Red Hat Learning
  • Developer Sandbox

    Developer Sandbox

    • Access Red Hat’s products and technologies without setup or configuration, and start developing quicker than ever before with our new, no-cost sandbox environments.
    • Explore Developer Sandbox

    Featured Developer Sandbox activities

    • Get started with your Developer Sandbox
    • OpenShift virtualization and application modernization using the Developer Sandbox
    • Explore all Developer Sandbox activities

    Ready to start developing apps?

    • Try at no cost
  • Blog
  • Events
  • Videos

Real-time debugging in Tekton pipelines

May 26, 2021
Vibhav Bobade
Related topics:
CI/CDDeveloper ToolsKubernetes
Related products:
Red Hat OpenShiftRed Hat OpenShift Container Platform

Share:

    Debugging CI/CD pipelines isn't always easy. This is especially true when a pipeline takes a long time to run, and the failing part you want to debug runs at the end of the pipeline. A feature introduced in a recent Tekton enhancement proposal (TEP) would let users stop the pipeline at any Step and debug in real time.

    This article looks at debugging TaskRuns in Tekton, the open source framework that integrates with Kubernetes to create cloud-native CI/CD pipelines. You can learn more about the basics of Tekton in this article by Joel Lord.

    The proposal, TEP-0042, outlines this feature with a proof of concept that describes how Tekton's composability and container support enable this functionality. For a thorough overview of these concepts, watch the talk, Russian Doll: Extending Containers with Nested Processes by Christie Wilson (Google) and Jason Hall (Red Hat).

    Debugging TaskRuns: TL;DR

    Debugging TaskRuns in Tekton is possible because of the composability provided by container-based pipelines it helps the user create. A Task runs as a Pod, and each Step in a Task runs in a container. With each Step running in a container, we can be sure that the delta of change in the container environment (which is not shared between Steps) is directly associated with the Step itself and nothing else. Anything else that might happen is a side effect, e.g., due to the injection of a sidecar container to the TaskRun. This makes Tekton great for debugging pipelines, as the cost to spin up a container is definitely far less than spinning up a cloud virtual machine (VM).

    With this in mind, TEP-0042 would extend the TaskRun Step life cycle (responsible for orchestrating TaskRun containers to run serially) and add capabilities to pause a TaskRun Step after a failure occurs.

    Modifying the life of a Step

    The life of a Step currently looks something like Figure 1.

    Diagram showing the life of a Step in Tekton: e.Go(), Wait for postFile, write err postFile, return err, exit.
    Figure 1: The life of a Step in Tekton.

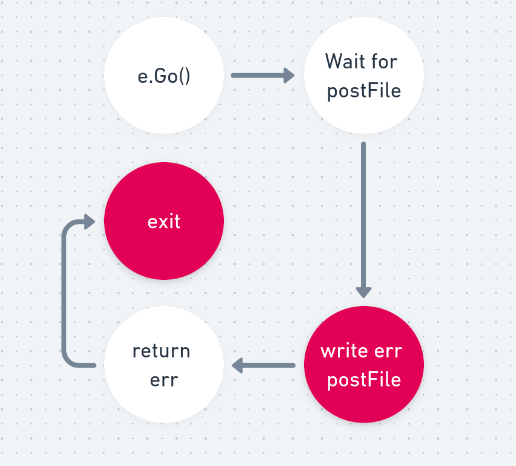
    The Step starts running when e.Go() runs. This is where Tekton invokes the entry point of the Step in the TaskRun and the child process (which is the actual Step) runs. If the child process runs successfully, we write a postFile that is used as a flag to convey the same. If it fails, we write an err postFile, which conveys a similar message.

    To halt this Step on failure, we must understand which parts of the Step react when the failure occurs; this is the write err postFile and exit shown in Figure 1. When a Step fails, the failure is marked by writing a <step-no>.err file to /tekton/tools/ directory in the Step container, which is shared with other containers in the Pod. This file is written by the background job in the entry point. The <step-no>.err file also lets the subsequent Steps know that there has been a failure, and eventually exits the TaskRun.

    This mechanism needs to be updated to support the discovery of Step failures and the ability to stop the Steps before it exits. This requires disabling the write err postFile. Instead of exiting the Step, it will wait for a flag that would exit the Step from the suspended state. The updated flow would look something like the diagram shown in Figure 2.

    Diagram showing proposed Step life cycle in Tekton when TaskRun failure occurs: e.Go(), Wait for postFile, return err, Wait for breakpoint exit.
    Figure 2: The proposed update to the Step life cycle in Tekton when TaskRun failure occurs.

    Once the Step is halted, the client can access the container environment for debugging.

    Conclusion

    In practice, the debugging solution is more nuanced than the overview provided here. Read the full TEP-0042 proposal for details.

    This topic is also the subject of a cdCon 2021 talk: Houston, We've Got a Problem!: How to Debug your Pipeline in Tekton.

    The debugging feature is expected to be available in Tekton later this year, with support across different Tekton clients, including the Red Hat OpenShift Pipelines command-line interface (tkn) and the Tekton dashboard. Get ready to debug Tekton pipelines in real time.

    Last updated: October 31, 2023

    Related Posts

    • Creating Pipelines with OpenShift 4.4’s new Pipeline Builder and Tekton Pipelines

    Recent Posts

    • Build container images in CI/CD with Tekton and Buildpacks

    • How to deploy OpenShift AI & Service Mesh 3 on one cluster

    • JVM tuning for Red Hat Data Grid on Red Hat OpenShift 4

    • Exploring Llama Stack with Python: Tool calling and agents

    • Enhance data security in OpenShift Data Foundation

    Red Hat Developers logo LinkedIn YouTube Twitter Facebook

    Products

    • Red Hat Enterprise Linux
    • Red Hat OpenShift
    • Red Hat Ansible Automation Platform

    Build

    • Developer Sandbox
    • Developer Tools
    • Interactive Tutorials
    • API Catalog

    Quicklinks

    • Learning Resources
    • E-books
    • Cheat Sheets
    • Blog
    • Events
    • Newsletter

    Communicate

    • About us
    • Contact sales
    • Find a partner
    • Report a website issue
    • Site Status Dashboard
    • Report a security problem

    RED HAT DEVELOPER

    Build here. Go anywhere.

    We serve the builders. The problem solvers who create careers with code.

    Join us if you’re a developer, software engineer, web designer, front-end designer, UX designer, computer scientist, architect, tester, product manager, project manager or team lead.

    Sign me up

    Red Hat legal and privacy links

    • About Red Hat
    • Jobs
    • Events
    • Locations
    • Contact Red Hat
    • Red Hat Blog
    • Inclusion at Red Hat
    • Cool Stuff Store
    • Red Hat Summit
    © 2025 Red Hat

    Red Hat legal and privacy links

    • Privacy statement
    • Terms of use
    • All policies and guidelines
    • Digital accessibility

    Report a website issue