
Grafana is an awesome visualization tool for seeing real-time metrics from your applications, and you can combine it with MicroProfile and similar tools to create one dashboard for multiple projects. Different projects use different names for metrics, however, so it is often necessary (and tedious) to handcraft the metrics for each project. Moreover, each project can expose its own custom metrics, and each MicroProfile vendor can also produce custom metrics, so there are many manual steps involved if you want to see all of your metrics in one place.
What if you could simply examine a running app and generate a dashboard with all of its exposed metrics? That is exactly what you can do with the MicroProfile Metrics Generator, a new open source tool that I created to dynamically generate Grafana dashboards for any MicroProfile project by capturing and monitoring all of your project metrics. Once you've created a dashboard, you can use it with Grafana, customize it to suit specific needs, and save it as a JSON file. You can also periodically regenerate your dashboards to bring in new metrics that you've exposed in your application.
In this article, you will learn how to do just that: Use the MicroProfile Metrics Generator to create a unified dashboard for all of your project's metrics.
Also, if you want to run the generator locally, you'll need to install Jsonnet and Grafonnet. If you want to run Grafana and Prometheus locally, you will also need a docker container.
About MicroProfile Metrics
The Eclipse MicroProfile project is split into multiple subprojects, one of which is MicroProfile Metrics. The MicroProfile Metrics specification defines a baseline set of metrics that are common across all MicroProfile-compatible projects. It also defines custom, per-vendor, and per-application metrics that developers can use to gather unique views into their running applications.
As an example, every MicroProfile vendor must expose the memory.usedHeap metric, which displays the amount of Java heap memory available for an app at any point in time. Vendors also have the option to expose vendor-specific metrics such as internal cache statistics. Application developers can also instrument their apps (for example, with Java annotations like @Timed) to collect metrics that are application-specific.
But, therein lies the problem: As a developer, you need documentation for both the vendor's and the application's metrics, and you won't know what metrics a MicroProfile application exposes unless that information was explicitly documented. As a result, many developers end up manually handcrafting dashboards for their projects and manually updating their dashboards as they add and remove metrics.
This is where the MicroProfile Metrics Generator comes into play.
The MicroProfile Metrics Generator
The MicroProfile specification defines a mechanism to list the metric metadata (name, description, units, and metric type) in a convenient RESTful endpoint. So, say that you have a running MicroProfile app with MicroProfile Metrics enabled, listening at http://localhost:8080. To access this metadata, you simply enter:
$ curl -X OPTIONS -H "Accept: application/json" http://localhost:8080/metrics
The OPTIONS /metrics endpoint works for any MicroProfile app, and gives you a set of metadata that looks something like this:
{
    "base": {
        "classloader.loadedClasses.count": {
            "unit": "none",
            "type": "gauge",
            "description": "Displays the number of classes that are currently loaded in the Java virtual machine.",
            "displayName": "Current Loaded Class Count",
            "tags": [
                [
                ]
            ]
        },
        ...
    },
    "vendor": { ... },
    "application": { ... }
}
Note the separate sections for base (required), vendor, and application metrics.
The MicroProfile Metrics Generator uses this output to create a Grafana dashboard that is compliant with the Grafana Dashboard JSON Model specification. It also uses the MicroProfile Metrics specification to craft appropriate OpenMetrics names that are used in the actual metrics output from the running app.
You can then use the output from this tool to generate the Grafana dashboard, all you have to do is pass the content from the OPTIONS /metrics endpoint to the tool. Another endpoint, GET /metrics, lets you see the point in time that the application exposed the metrics. In this case, you would enter the following to see the metrics from the running example application:
$ curl http://localhost:8080/metrics
Once you have connected to these endpoints, you can set up the metrics to be periodically read and consumed by a tool like Prometheus, which is currently the underlying tool for the generator. Prometheus stores the metrics and provides alerting and querying capabilities, which you can then access from a visualization tool like Grafana.
Generate an example combined dashboard
Let's walk through an example using the MicroProfile Metrics Generator's repository. You will need the following tools to complete this example:
- curl - For accessing the application's metrics.
- Git - To clone the repo.
- Grafana - To visualize the dashboard.
- Java - To run the sample application.
- Node.js - To run the generator's web front end.
- Prometheus - To scrape metrics from the application.
Note: If you want to try out an already-running version, check out the SmallRye MicroProfile Grafana Dashboard Generator for an easy test drive.
Run the MicroProfile Metrics Generator
Start by following the instructions in the README to get the MicroProfile Metrics Generator up and running. The MicroProfile Metrics Generator repository includes a sample application that you can use to generate metrics. It's a simple Quarkus application with a few added metrics. You can run the application from the repo's root directory with mvn quarkus:dev -f sampleapp. Quarkus includes the SmallRye MicroProfile implementation. You can learn more about it by reading the Quarkus MicroProfile Metrics guide.
Note: The end goal is to produce a JSON dashboard from JSON metadata, so what better tool to use than Jsonnet? You could do JSON-to-JSON mapping with Java, JavaScript, or another language, but Jsonnet is well suited for the task. The Grafonnet library just makes it less painful to generate Grafana JSON.
Generate a Grafana metrics dashboard
This example assumes you have a MicroProfile app with MicroProfile Metrics enabled, that is running on localhost:8080. You also have the MicroProfile Metrics Generator running on localhost:8081.
To see the application's raw metrics, enter:
$ curl http://localhost:8080/metrics
Next, generate the Metrics metadata:
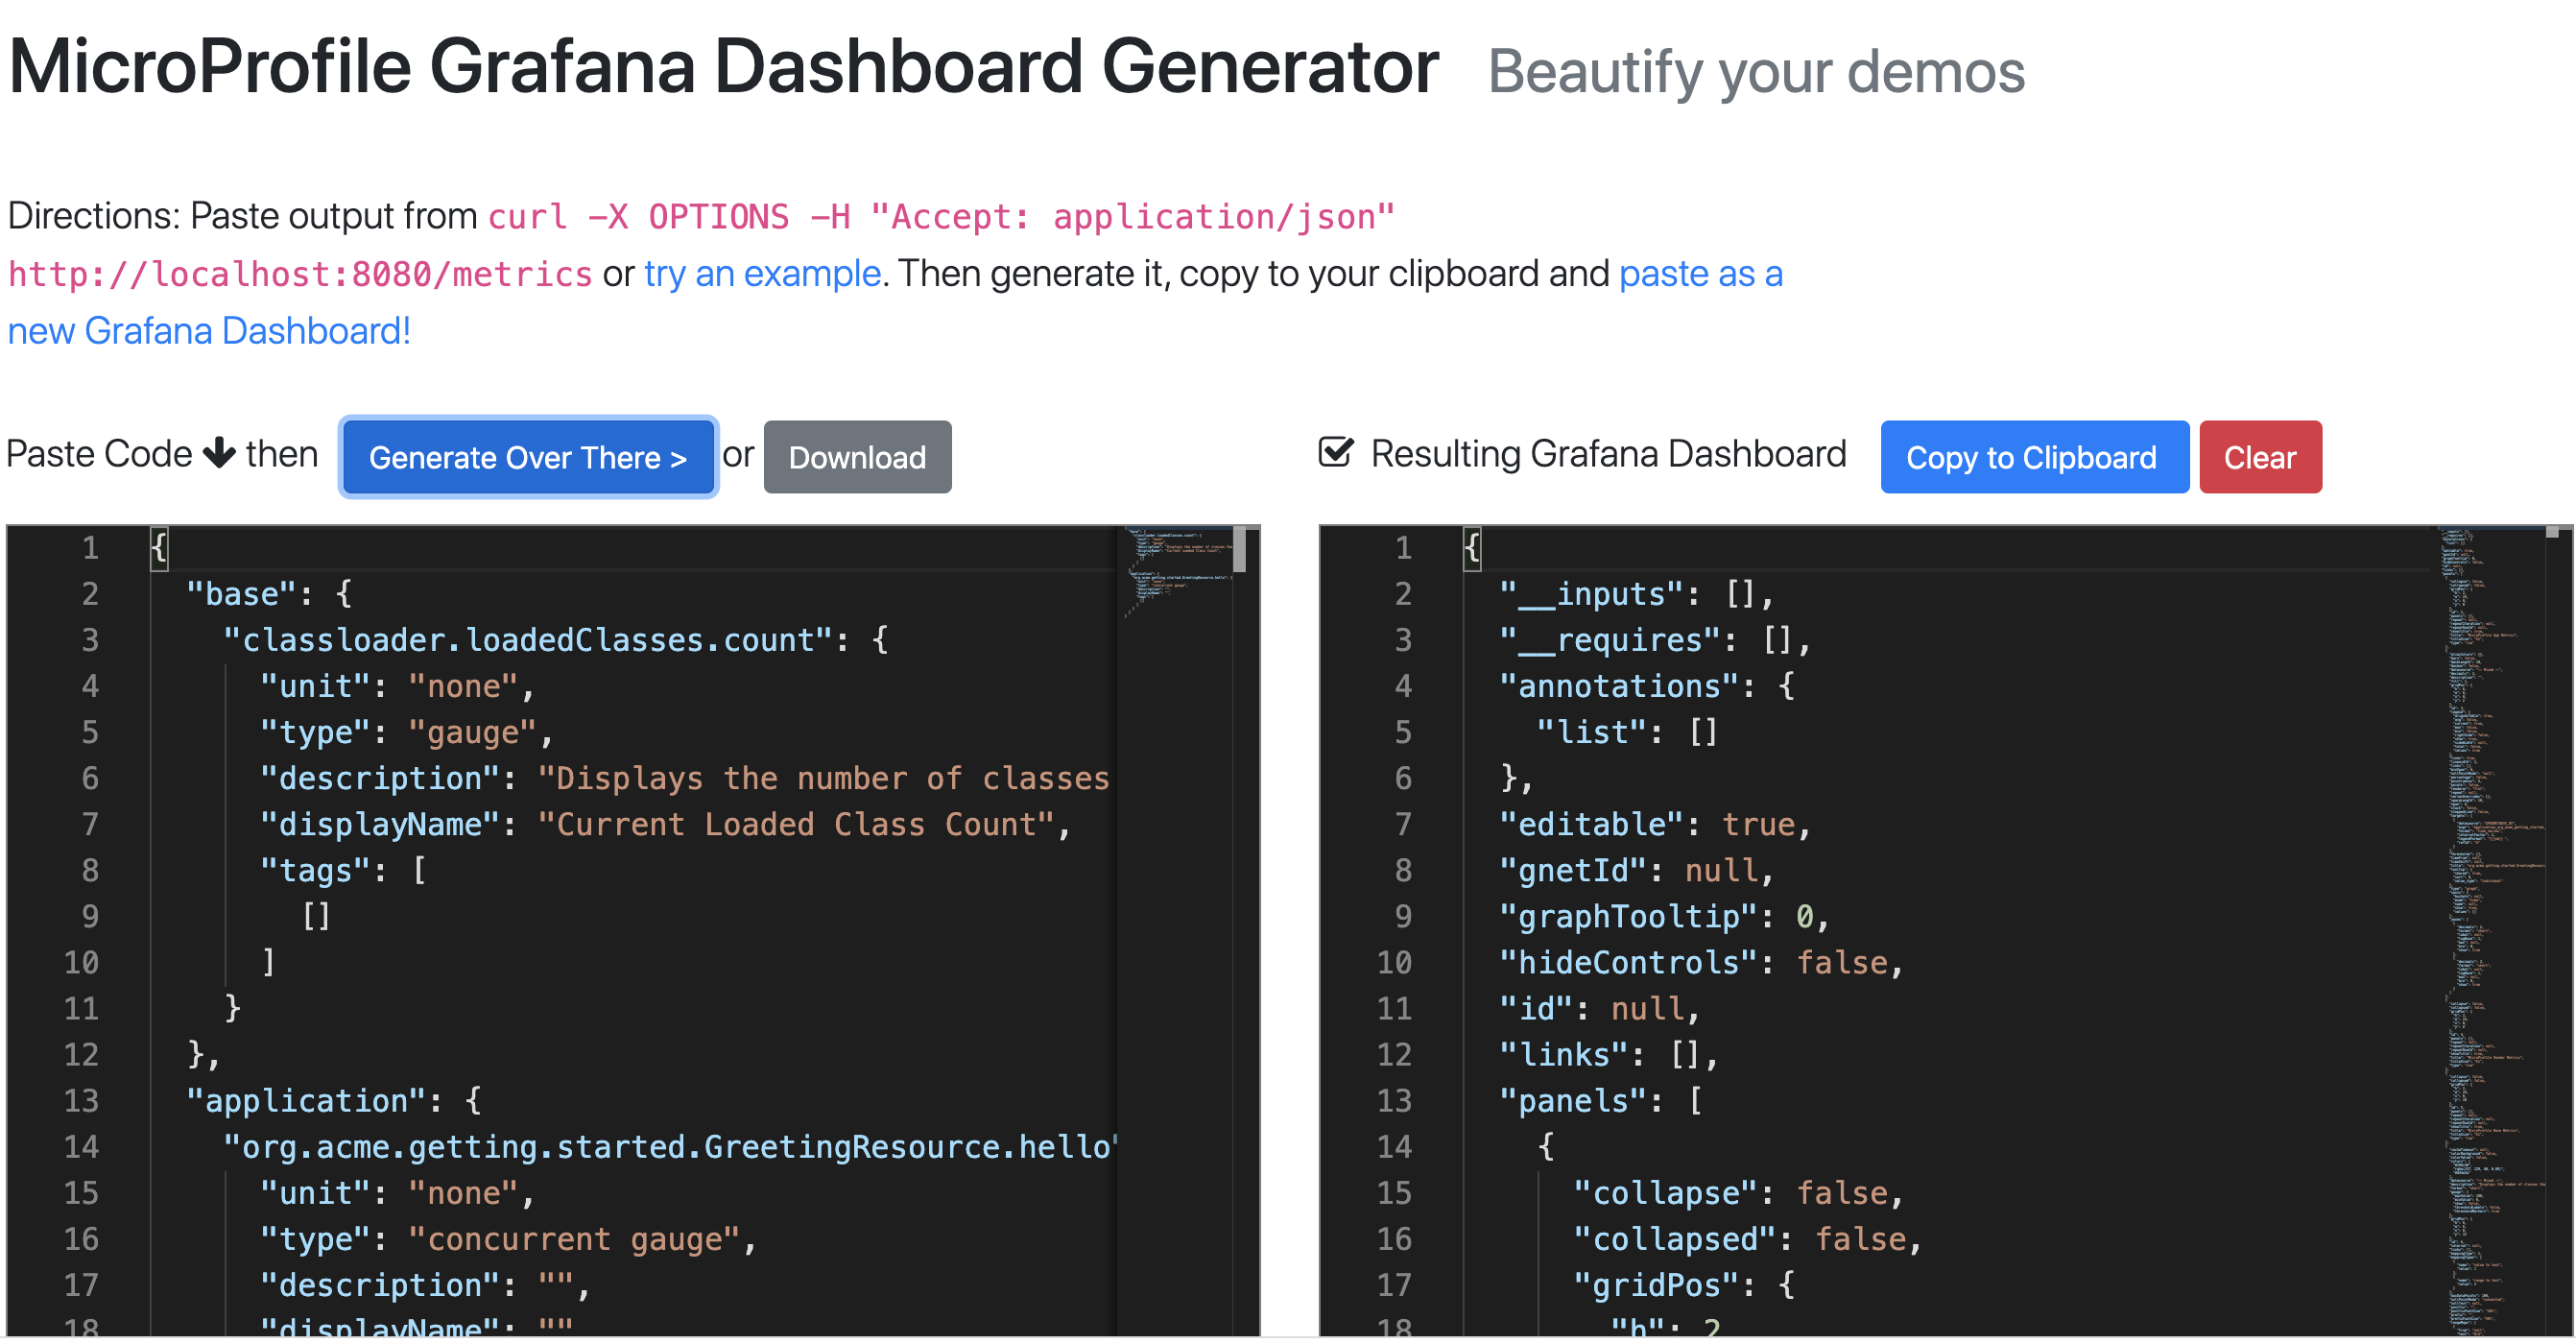
$ curl -X OPTIONS -H "Accept: application/json" http://localhost:8080/metrics
Now, access the generator front end at http://localhost:8081. Copy and paste the previous command's output into the left box, and click Generate. You will see something like the screenshot in Figure 1.
Import the Grafana dashboard with Prometheus
Note that before you proceed, you must have Grafana configured with a Prometheus data source. Prometheus, in turn, must be configured to scrape your application's /metrics endpoint. If you don't have Prometheus and Grafana running, you can use the example scripts, which require that you run them with docker (see the README for more details).
Now to import the dashboard. Copy the output on the generator's right side (Figure 1). Then, open Grafana and paste the content into the Grafana Dashboard Import box (see the README for more details). Alternatively, you can click the Download button on the left side of the generator's screen to download the .json file.
Figure 2 shows an example of a nice-looking Grafana dashboard that I generated using this tool:

You can also generate dashboards using the generator's /processRaw endpoint. Here's an example:
$ curl -X OPTIONS -H "Accept: application/json" http://localhost:8080/metrics | \
  curl -d @- http://localhost:8081/processRaw
Implementation details
The magic of the MicroProfile Metrics Generator is written in Jsonnet syntax, along with other typical programming constructs to get the job done. Jsonnet "consumes" JSON files that can be instrumented with programmatic expressions, which produces another JSON object.
For example:
$ echo '["hello world"]' | jsonnet -
[
   "hello world"
]
Nothing exciting there; but this is more interesting:
$ echo '[i for i in [1,2,3]]' | jsonnet -
[
   1,
   2,
   3
]
Note: Interesting design choices (like being hermetic) make it a tad more difficult to dynamically consume JSON with Jsonnet. Its syntax takes some adjustment, as well.
Notice the for loop. You can use lots of other programmatic elements to generate the JSON end object. Everything else is pretty standard: You just need a Node.js runtime and the tools to get Prometheus and Grafana running locally.
Wrap up
The MicroProfile Metrics Generator lets you dynamically generate Grafana dashboards for all of the metrics in a MicroProfile application. It's useful for demos or for generating metrics for your production apps. You can also use Prometheus and Grafana to set up alerts if your app is misbehaving. If you have ideas for improving the generator, I'd love to hear them.
Last updated: February 5, 2024