Project Thoth is an artificial intelligence (AI) R&D Red Hat research project as part of the Office of the CTO and the AI Center of Excellence (CoE). This project aims to build a knowledge graph and a recommendation system for application stacks based on the collected knowledge, such as machine learning (ML) applications that rely on popular open source ML frameworks and libraries (TensorFlow, PyTorch, MXNet, etc.). In this article, we examine the potential of project Thoth's infrastructure running in Red Hat Openshift and explore how it can collect performance observations.
Several types of observations are gathered from various domains (like build time, run time and performance, and application binary interfaces (ABI)). These observations are collected through the Thoth system and enrich the knowledge graph automatically. The knowledge graph is then used to learn from the observations. Project Thoth architecture requires multi-namespace deployment in an OpenShift environment, which is run on PnT DevOps Shared Infrastructure (PSI), a shared multi-tenant OpenShift cluster.
Thoth recommendations are provided through a Thamos CLI, which is a tool and library for communicating with Thoth back end. The recommendation engine for project Thoth is called Adviser.
There are the following main goals of Adviser (as of now):
- Provide a tool that can compute recommendations in project Thoth.
- Check provenance of installed packages (which package source indexes are used - this is not guaranteed by pip nor Pipenv).
- A tool called Dependency Monkey, which generates all the possible software stacks for a project respecting dependency resolution.
The recommendations for AI software stacks require the collection of performance observations across huge number of combinations of libraries in software stacks. To capture these performance differences, Thoth relies on microbenchmarks created specifically for Thoth requirements, called performance indicators (PIs).
To define these new type of benchmarks, we analyzed ML benchmarks (e.g., MLPerf, Baidu DeepBench, Stanford DAWN Deep Learning Benchmark (DAWNBench), The Deep Learning Cookbook), and we classified them into two categories:
- High-Level Test, also called macro-benchmarks, performed at the application level, so a real application, considering different datasets, models, hyperparameters tuning, OS libraries, hardware, etc., therefore considering the entire ML workload (e.g., ML Perf).
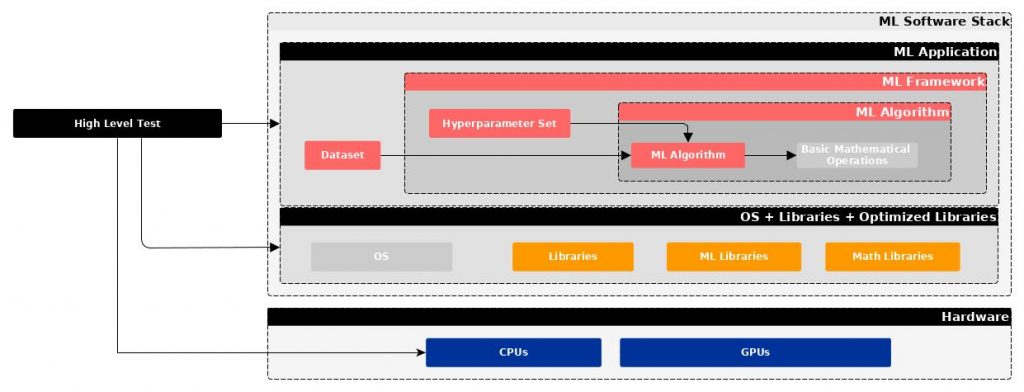
Figure 1: High-level test schema.
- Low-Level Test, also called microbenchmarks, focused on basic operations that constitute the backbone of the ML algorithms. (e.g., DeepBench).
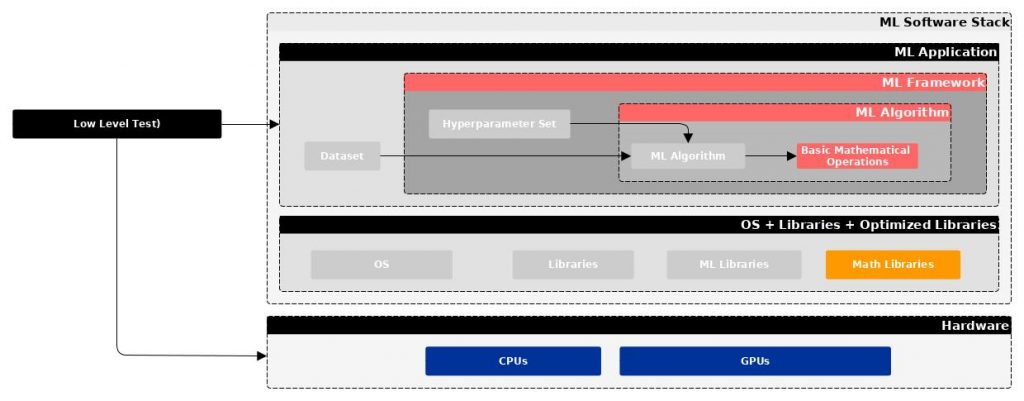
Figure 2: Low-level test schema.
We also analyzed ML applications and their algorithms, and through their decomposition in basic components, we arrived at the definition of the PI. The table below describes the Thoth PI with respect to existing ML benchmarks. We can immediately see that Thoth is uniquely focused on the software stacks; therefore, it's not overlapping with other existing efforts. The entire analysis was important to guarantee the requirements for Thoth: low evaluation time, software stack focused, ML framework focused, for training and inference.
| Benchmark
(High-Level Test) |
Thoth PI | Microbenchmark
(Low-Level Test) |
|
| Goal | Measure system performance for both training and inference from mobile devices to cloud services. | Evaluate Performance Indicators that can be used to recommend AI software stacks. | Benchmark operations that are important to deep learning on different hardware platforms. |
| Metrics |
|
|
|
| Time requested for benchmarking | ~hours, days | ~minutes, (hours?) | ~seconds, minutes |
| Using ML Frameworks | Yes | Yes | No |
| Phases of ML workflow | Training/Inference | Training/Inference | Training/Inference |
We can now define PIs as: scripts run to collect performance observations regarding AI software stacks for both training and inference minimizing the time of evaluation.
PIs are defined for each ML framework from the analysis of the ML applications and algorithms. Each PI has specific parameters that need to be tuned and tested to identify constraints that allow the minimization of errors due to the shared infrastructure on which they run.
The next sections show how PIs are evaluated using Red Hat OpenShift and the automated process that is triggered once a new version of an ML library is released. Moreover, they will show the preliminary results obtained in order to guarantee transparency, reliability, and accuracy to Thoth users. These results will show that we are able to identify differences in software stack performance, and therefore that we can use these observations to recommend software stacks with higher performance.
How do we run these benchmarks for AI applications?
The performance of a software stack depends on many parameters. It is necessary to consider the entire software stack's layers in order to understand their behavior and the different factors affecting their performance.
Amun is a service that executes the application stack in the requested environment, using the list of packages that should be installed as well as the hardware that is requested to run the application. Its primary purpose is to act as an execution engine for Thoth, where applications are built and tested (applications are automatically generated given the software's requirements).
The inputs are given through a JSON file that allows the selection of all components present in the layers of a software stack, such as the:
- Base image (e.g.,
rhel8,ubi8,thoth-ubi8-python36) - List of RPMs or Debian packages
- Pinned down software stack (
PipfileandPipfile.lock) - Hardware requirements (e.g., CPU only, GPU)
- PIs and parameters
Amun can be run directly through the CLI or through Dependency Monkey, which generates software stacks that are subsequently validated and scored using the Amun service with a specific PI. In this way, we can learn the differences in performance from different software stacks and hardware.
Every PI has specific input parameters, but each of them collects different types of data, such as hardware information, resource usage, etc.
There are two results specifically focused on performance. One result is FLOPS (floating-point operations per second) or GigaFlops (or GFLOPS), which is a billion FLOPS. The other result is the time spent to perform a specific operation, measured in seconds or milliseconds. This second result is also called elapsed time.
We can extend the results depending on what we want to capture from a PI run.
Where do we run microbenchmarks for AI applications?
The ML application is influenced by all layers of the software stack, so evaluating performance requires the use of PIs that can approximate the application's behavior with high confidence. At the same time, the ML application requires a platform for testing that provides all of the information required to evaluate and analyze the results in order to guarantee the results' reliability, transparency, and accuracy.
The need for scalability, automation, reliability, and monitorability due to the huge number of software stacks to be analyzed—and consequently a high number of observations to be collected—is fulfilled by the use of OpenShift running on PSI.

Figure 3: Thoth performance indicator test environment.">
Figure 3 shows the test environment we selected to run our Thoth PIs. This figure highlights the inputs that can be provided (as shown in the previous section) to evaluate software stack performance in all possible situations:
If we look at Figure 4, it is possible to identify the part of the Thoth core architecture that focuses on running the PIs (called inspection runs):

Figure 4: Thoth core architecture.">
The inspections run can be submitted directly through the Amun API or through Dependency Monkey, which generates a combination of software stacks to be inspected. Two to three namespaces are involved: Amun runs in the Amun API namespace and generates inspection builds and inspection jobs in the Amun Inspection namespace. Once the jobs are finished, the graph sync job stores the result documents in Ceph and syncs them in Thoth Knowledge Base.
When do we run microbenchmarks for AI applications?
Many services are automated inside Thoth. Bots supporting the developer team rely on OpenShift monitorability features, thanks to Prometheus Alerts and Grafana. All result quality analysis is automated by running Thoth template notebooks triggered automatically inside jobs. In this way, we can reduce the workload and focus on the definition of test constraints in order to achieve the best accuracy. The approach we use is data-driven, which helps the team internally and facilitates the improvements to be made to guarantee reliability and quality to external Thoth users.
Let's assume a new release of TensorFlow is issued on PyPI index. The typical workflow triggered inside Thoth is shown in Figure 5:

Figure 5: A typical Thoth workflow when a new TensorFlow is released.">
This workflow breaks down as follows:
- A new version of TensorFlow is released by Google on PyPI.
- Package Releases Job:
- Identifies the new TensorFlow release.
- Syncs the new package in Thoth database.
- Re-triggers the TensorFlow Build pipeline.
- Graph Refresh Job:
- Identifies the new Package and requests job scheduling.
- Schedules a Solver Job through
operator-workload. - Schedules a Package Analyzer Job through
operator-workload.
- Two things happen at once. First, the results are:
- Created from Jobs.
- Stored in Thoth Knowledge Graph through
graph-sync-job. - Stored in Ceph through
graph-sync-job.
Meanwhile, tensorflow-wheels-build-jobs are finished and new optimized versions of TensorFlow are released on AICoE index that goes through all same points above.
- Prometheus scrapes metrics from Pushegateway and
metrics-exporterand provides insights into what is happening to the Thoth team. - Prometheus triggers alerts according to the results defined by the Thoth team.
- Sesheta, Thoth’s Bot team member, sends feedback and status on the Thoth DevOps chat. According to the logic and rules, it can decide to trigger analysis of inspections to evaluate PI through Dependency Monkey or Amun directly.
- Dependency Monkey generates software stacks and starts to schedule Inspections through the Amun API, or Amun is triggered directly from Sesheta and inspections are sent to the workload operator.
- All results are stored in the Thoth Knowledge Graph and Ceph.
- Quality analysis of inspection jobs is triggered when each inspection batch is finished, using Thoth template notebooks, and results are provided to the team and outside the team.
Tests and results
These tests are focused on matmul microbenchmarks for TensorFlow. The inputs parameters for this PI are:
- Matrix size
- Data type
- Number of operation repetitions
Test 1
Test 1 aims to identify the number of repetitions that reduce the error on the rate, fixing type of data and matrix size. The input parameters are:
- TensorFlow 1.13 from PyPI
- Fedora base image
- matmul (TensorFlow, matrix size=512, {repetitions}, data_type=float32)
- 300 inspections
- CPU-only
The results for Test 1 are shown in Figures 6 through 9:

Figure 6: Test 1's box plots rates per batch.">

Figure 7: Test 1's violin plot rate per batch.">

Figure 8: Test 1's statistics plot of std for rate of different batch.">

Figure 9: Test 1's interpolated statistics for rate of different batch.">
According to the results obtained for matrix 512, we can investigate into more detail for two specific batches where the variation on the results is lower, as shown in Figures 10 and 11:

Figure 10: Test 1's box plots rate per specified batches.">

Figure 11: Test 1's violin plot rate per specified batches.">
From these results, we decided to initially use 2,000 repetitions to run matmul PIs, as matmul has the lowest variation on the rate (which is fundamental for scoring packages, and therefore fundamental for the quality of the recommendations given by Thoth).
Test 2
Test 2 aims to identify the quality of the results, fixing the number of repetitions with the best solution identified during Test 1, but changing the matrix size. In this test, we reduce the number of inspections per batch to 100 (in Test 1, we ran 300 inspections per inspection batch). In this test, we also have a newer version of TensorFlow and the base image. This test's input parameters include:
- TensorFlow 1.14.0 from PyPI
s2i-Thoth-ubi8-python36base image- matmul (TensorFlow, {matrix size}, repetitions=2k, data_type=float32)
- 100 inspections
- CPU-only
The matrix size changed for 64, 128, 256, 512, 1024, 2048, 4096.
The results for Test 2 are shown in Figures 12 and 13:

Figure 12: Test 2's interpolated statistics for elapsed time of different batch.">

Figure 13: Test 2's interpolated statistics for rate of different batch.">
We can see from the results that the underlying hardware uses optimization when the matrix size becomes high, and at the same time we can see an increase in variations of the results on the rate, but not on the elapsed time. Thoth is able to catch these behaviors and provide recommendations to users so that they can run AI applications in the best conditions.
Performance changes identified
Let’s focus on two specific inspection batches from the two tests to show more insights and performance observations that Thoth captures.
| Test 1 | Test 2 |
Input Parameters:
|
Input Parameters:
|
Results are compared for the Rate [GFLOPS] in Figure 14:

Figure 14: Interpolated statistics for rate of different batch (GFLOPS).">
We can see from the PyPI result analysis that from TensorFlow 1.13.0 (2k-test-new inspection batch) to TensorFlow 1.14.0 (test-ms inspection batch) there is a ~1.46x improvement considering the median of the rate (GFLOPS) results from matmul using matrix sizes of 512 and only CPU. We also need to consider the variation on the results for further tests, also considering an optimization on the number of inspections to run to guarantee low result error.
In general, these results show the potential of Thoth's infrastructure running in Openshift on PSI and how it can collect performance observations. They give good insights on how the tests need to be run, but further analysis needs to be performed to reduce the variation of the errors in order to avoid misleading recommendations.
Next steps
Next, we plan to:
- Perform other types of tests on the same PI.
- Aggregate other results considering different PIs.
- Create new PI for ML applications.