Following the blog post series, today, finally we have Part 2, this chapter tries to explain in an easy way how to debug your hybrid app using the Safari web inspector.
As you know sometimes debugging a mobile app on a mobile device can be hard work, for Android and Web pages we have the Chrome Developer tools, this has been an extended way to do it, Part 3 of the blog post series will cover this method, for iOS we have something similar, called the Safari web inspector.
With the launch of iOS 6 and Safari 6, Apple released the web inspector to debug and create web pages, this means that we have a way to debug our apps running on our mobile device and see what’s happening in our computer web browser, so let’s explain how to set up all the environment.
Note: This method is only available if you have a Mac computer.
System Requirements:
Please make sure that your system meets the following requirements:
- MacOSX Lion version 10.7.4 or greater
- Certified USB Cable
- Safari 6
- Device / Emulator
- XCode 4.5 or later with iOS 6 SDK or later
Note: See the version in the About menu or just do the following:
- MacOSX: sw_vers -productVersion
- XCode: /usr/bin/xcodebuild - version
- Safari: mdls - name kMDItemVersion /Applications/Safari.app/
Enable Developer Tools
Safari on Desktop
A. Open the Safari App (1 in Diagram) and click on Safari at the top left of the toolbar (2 in Diagram).
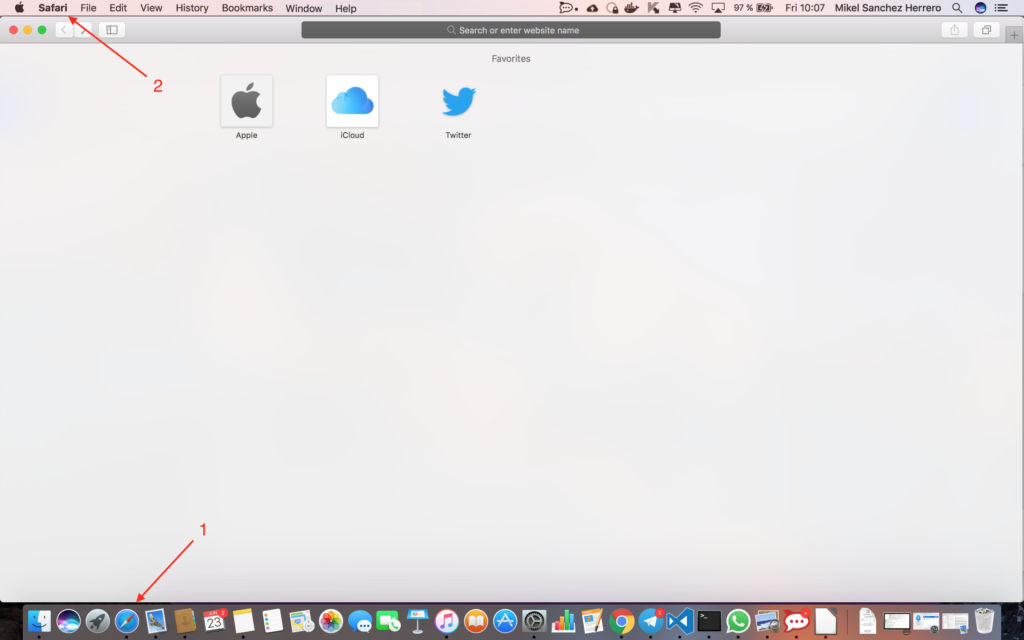
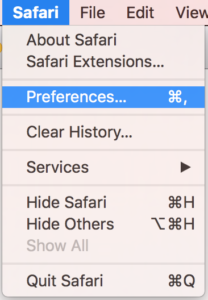
B. Click the Preferences button.
C. Click Advanced (1 in the diagram) button and enable the Show Develop option (2 in the diagram).
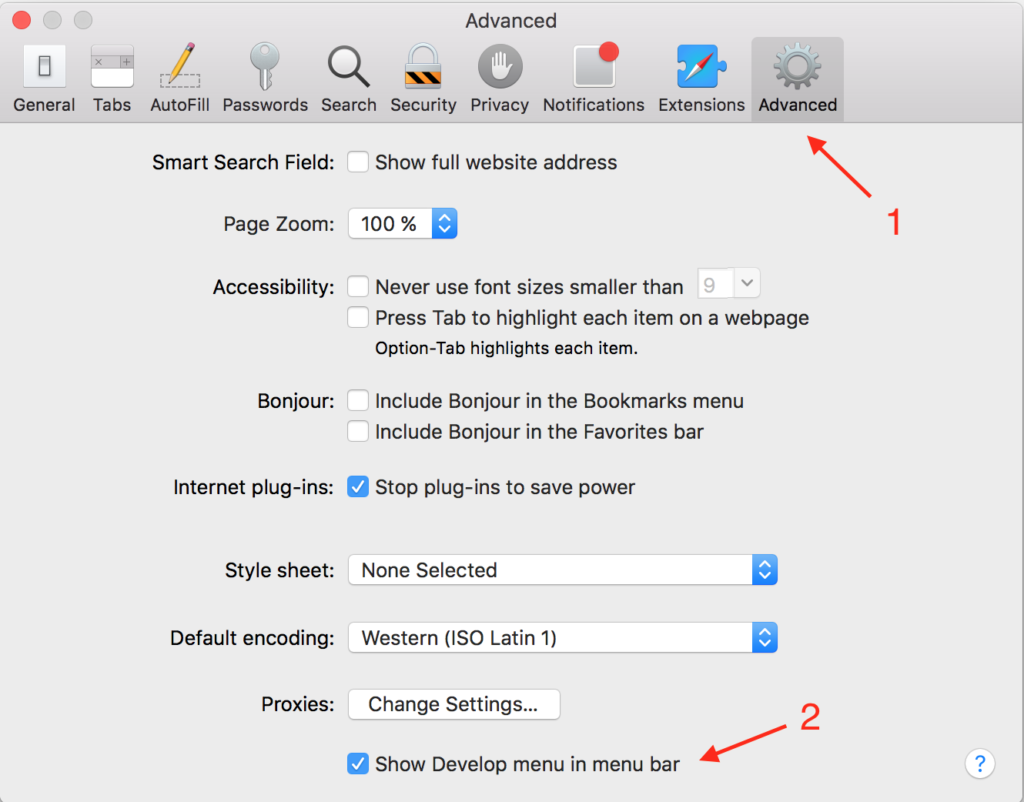
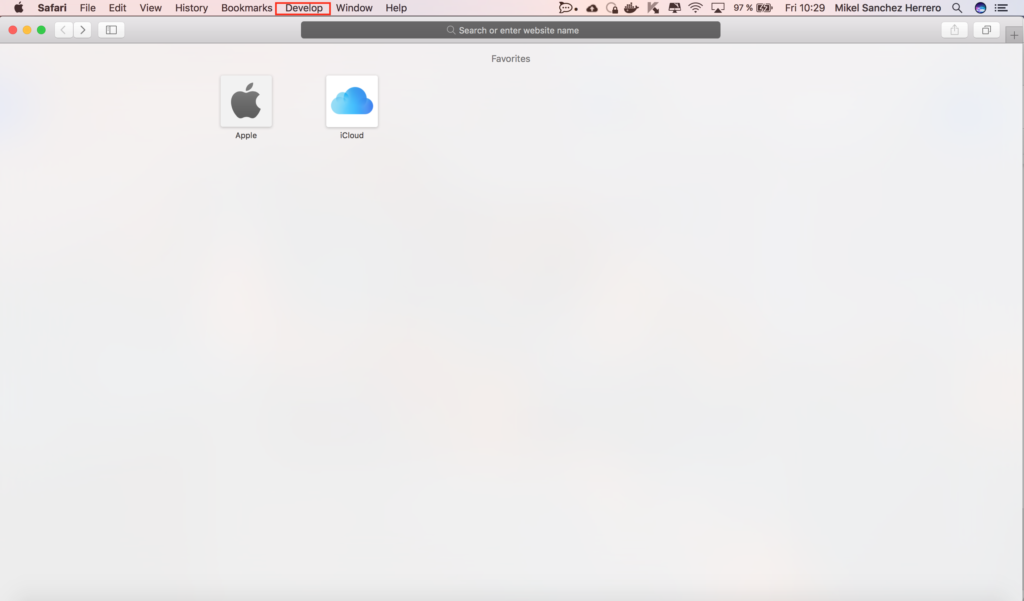
D. Close the window and check the new menu item named Develop:
Device
To enable de debugging, the device must be correctly configured, to do so just follow these steps:
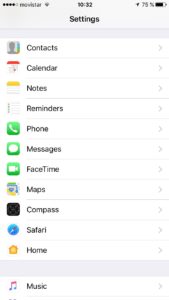
1. Click on Settings and go to the Safari section.
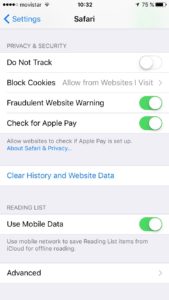
2. Scroll down until you can see the Advanced section, click on it.
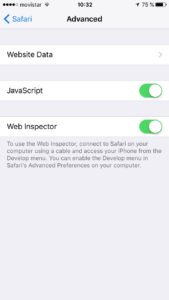
3. Enable the Web Inspector Switch.
Run Project on Device
Once we have everything setup and our App source code downloaded or in our local computer, we are able to run the project in our device.
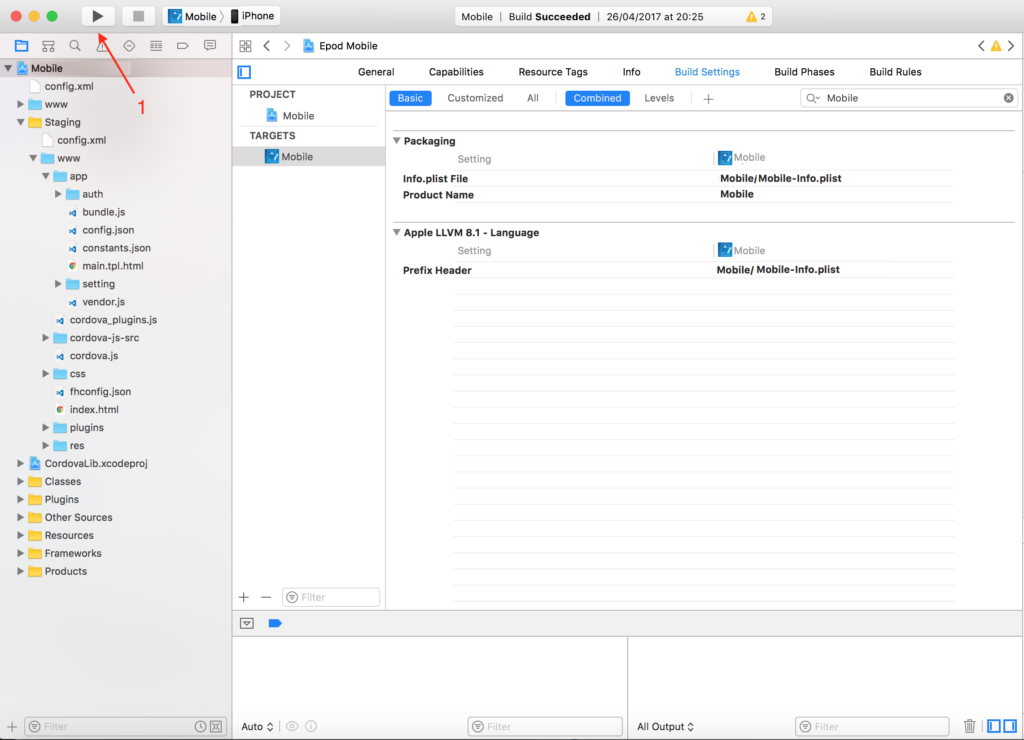
1. Attach the device with the USB cable and open XCode and run the project on the device:
2. If the app finished launching correctly and opened on your device, now it’s time to debug the app, open Safari and click on the “Developer” section in the top bar:
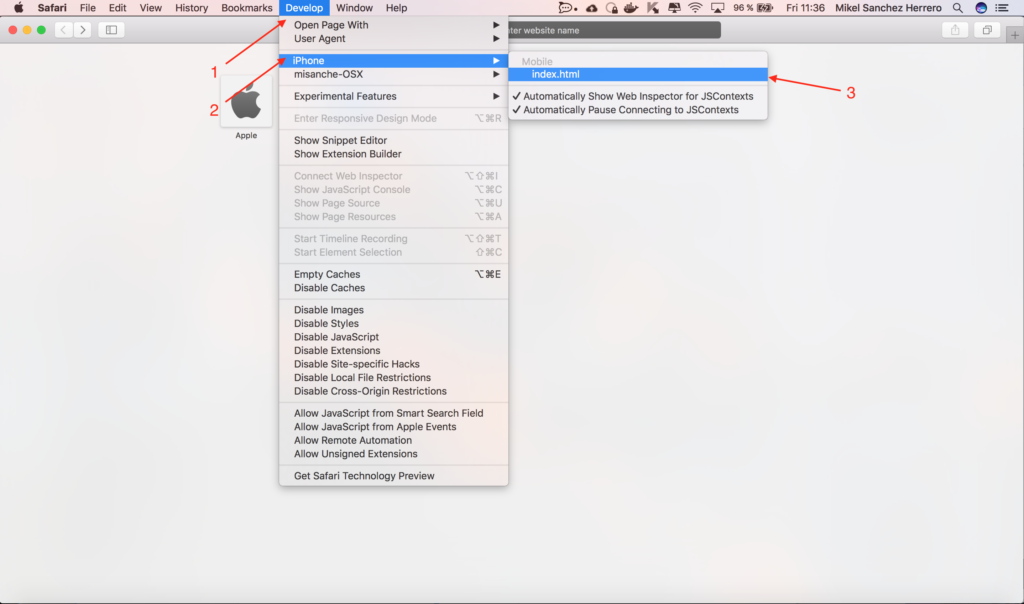
3. This will open a new window within the developer tools.
Developer Tools Explanations
Network
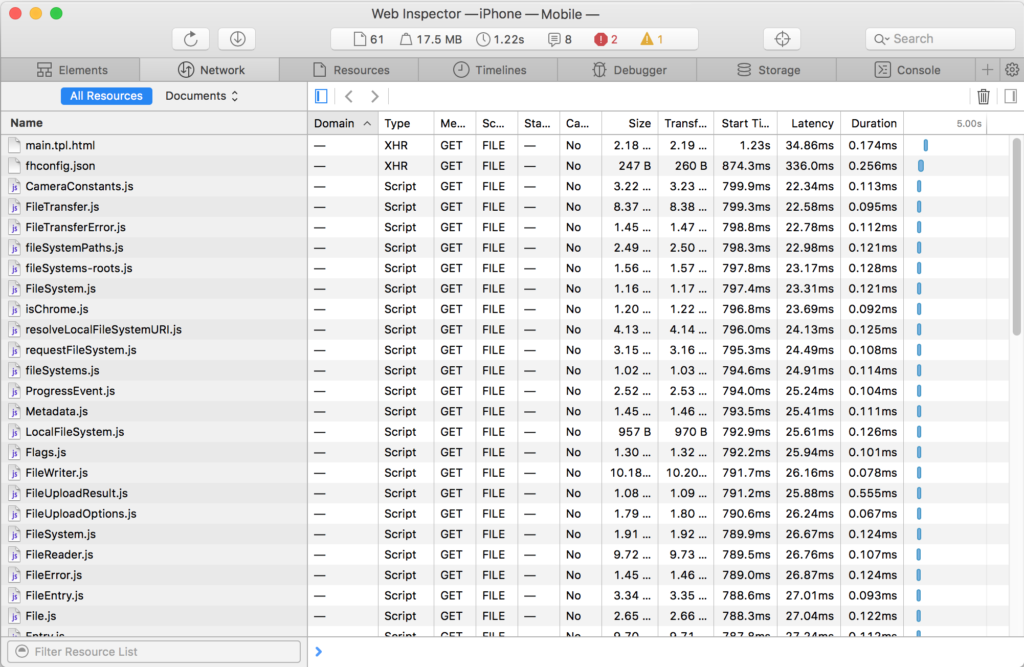
This section covers all the network calls. If you want to see details, click on the required file loaded and the details are displayed.
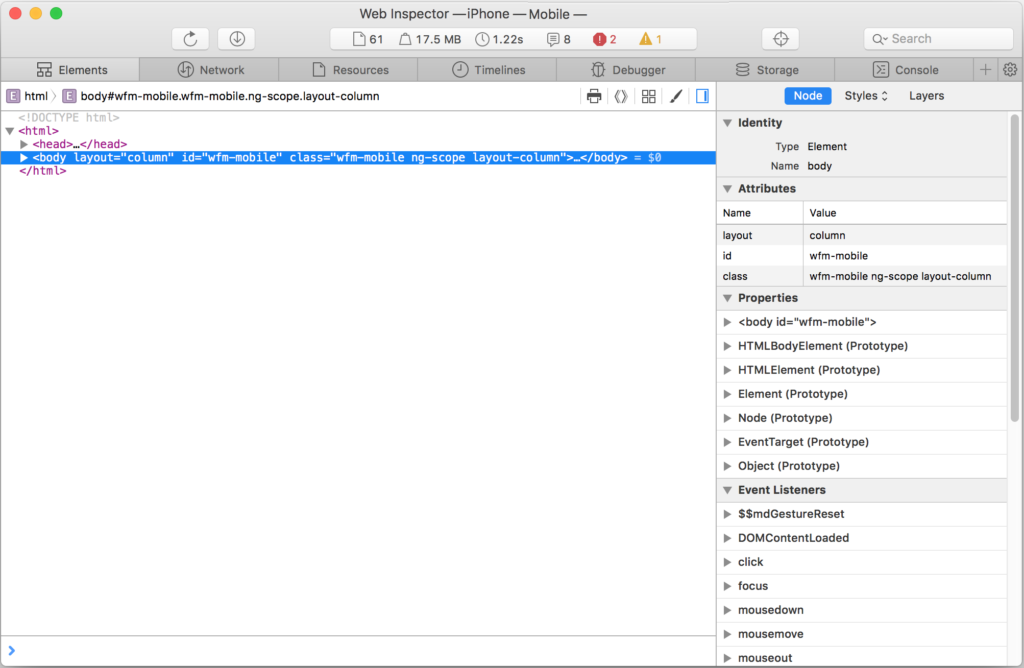
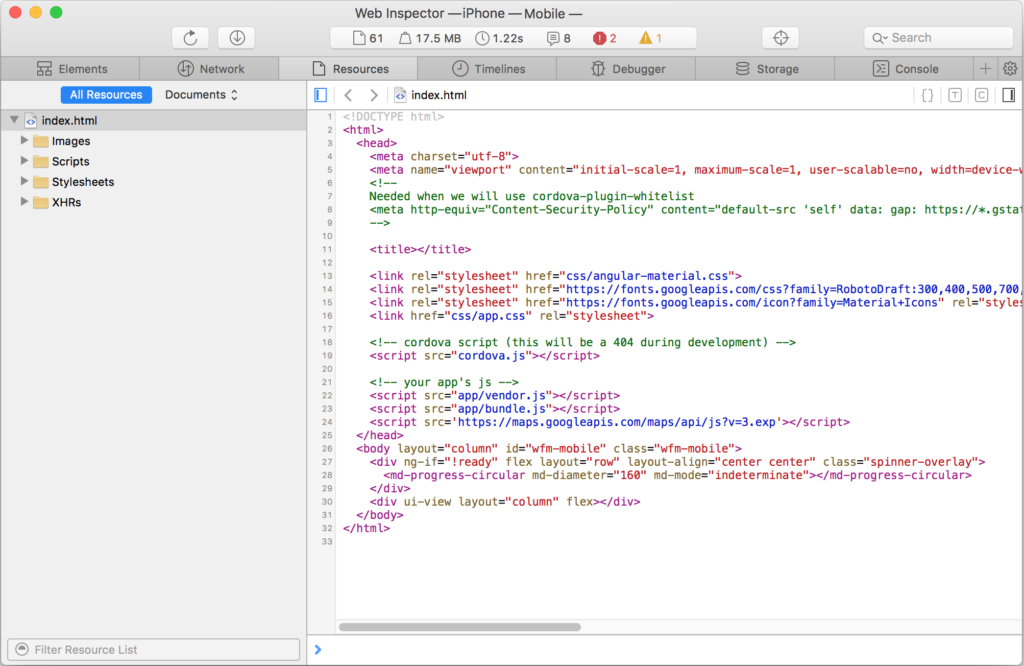
Resources
This section lists all resources in the App, and you can browse those resources:
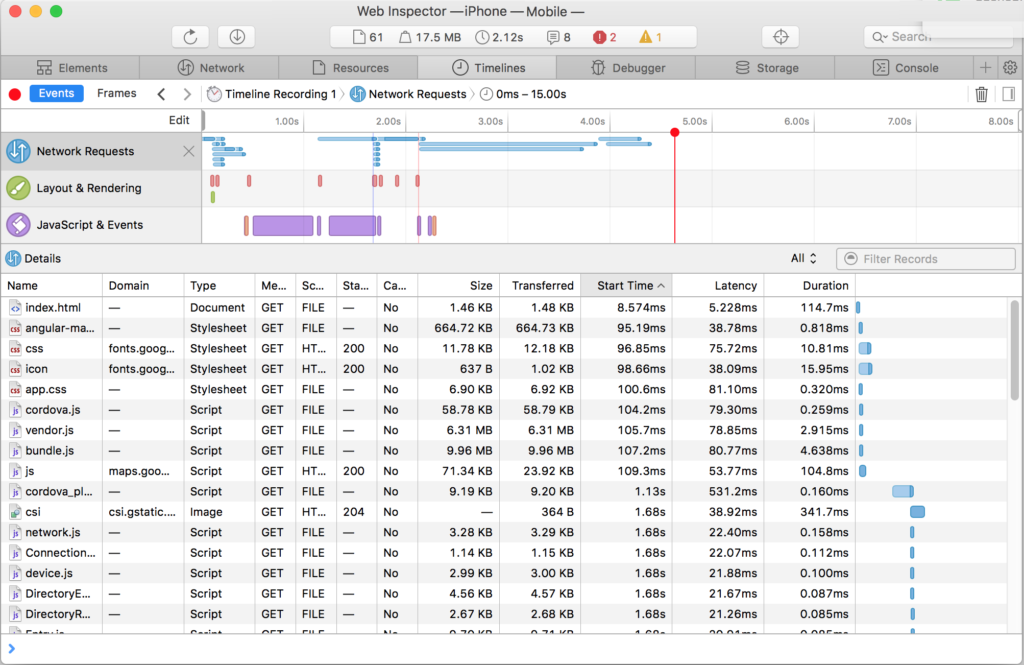
Timelines
You can check how much time is required to load into the app, network request, layout rendering or javascript events. This is very useful when you have high-performance requirements and everything needs to be as fast as possible. Use this to detect your app's weaknesses.
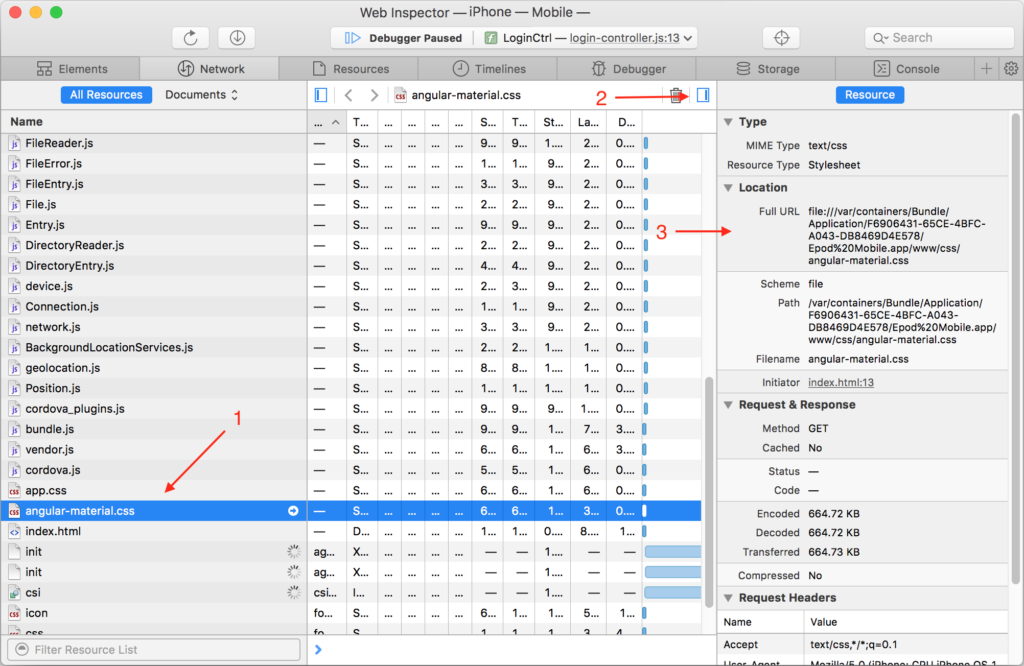
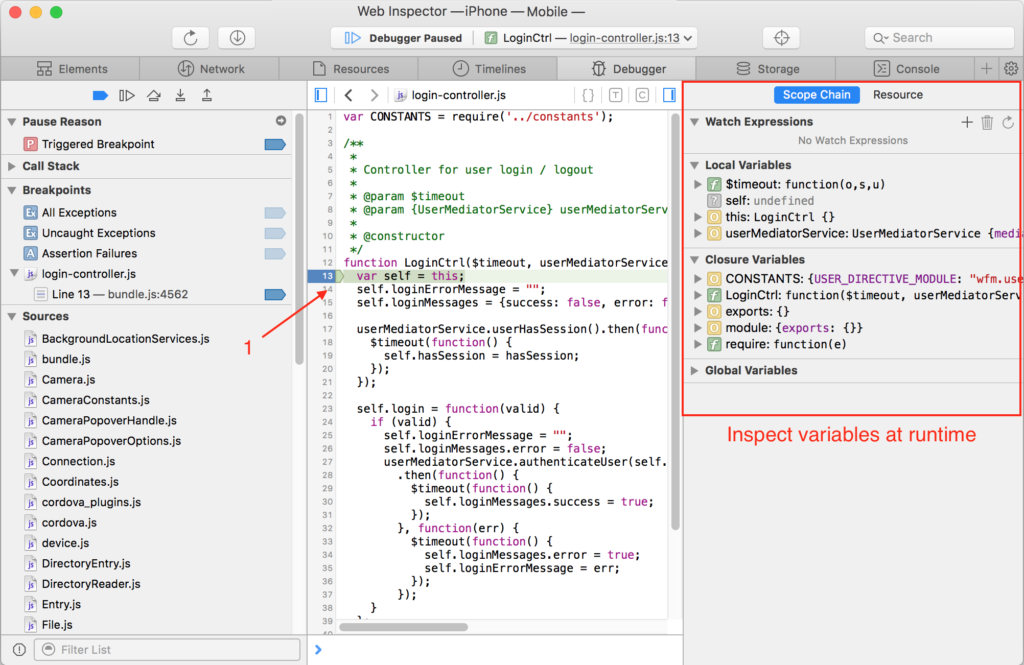
Debugger
This section maybe is the most important one, as same as you do in the Chrome developer console, this can be done in Safari, you can add breakpoints, debug the javascript and inspect the value of the variables at runtime.
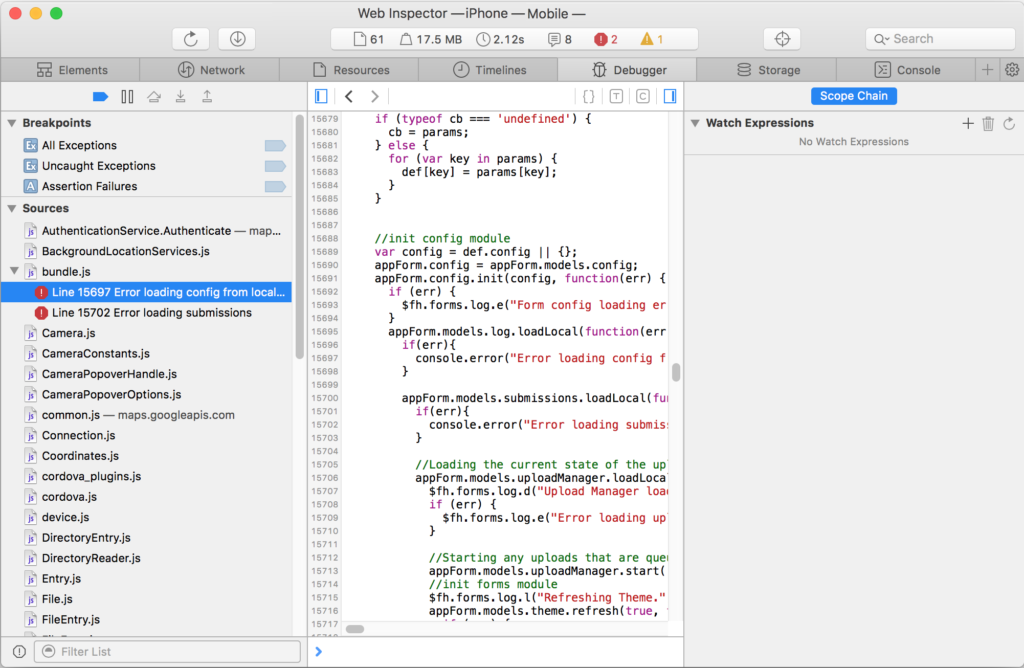
1. Add a breakpoint and reload the app.
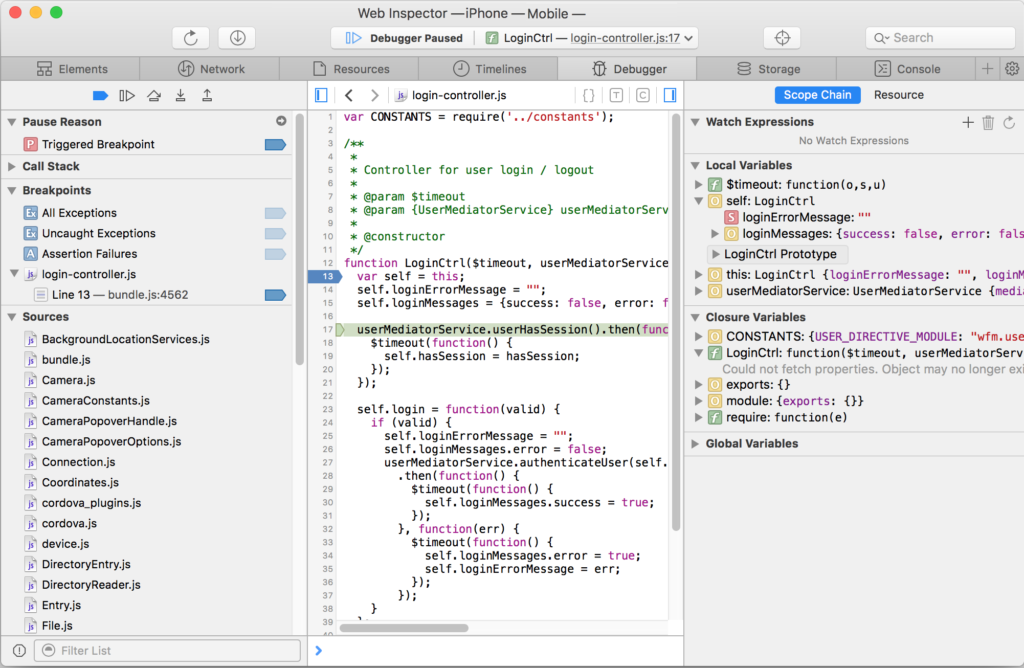
2. Once the page is reloaded and you make the required steps until arriving at the breakpoint, you will get something similar to this:
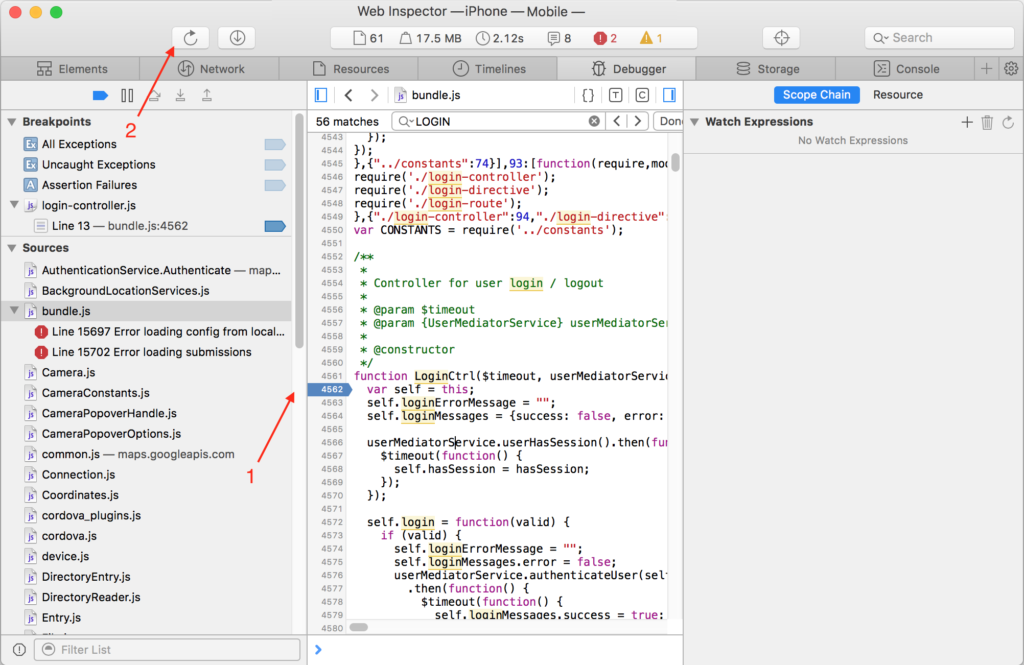
3. Expand them.
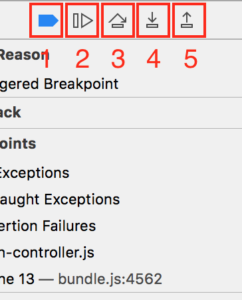
- Disable or enable breakpoints
- Continue script execution
- Step over
- Step into
- Step for
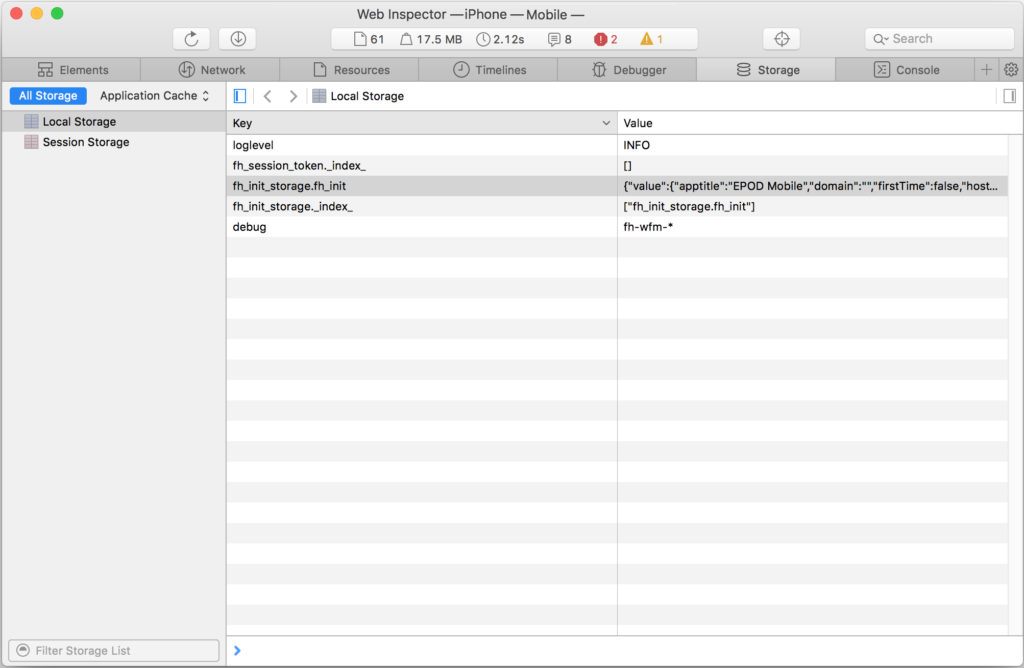
Storage
All the application data stored in the browser can be seen here, just click on Local Storage or Session Storage, all this information stored here can be changed.
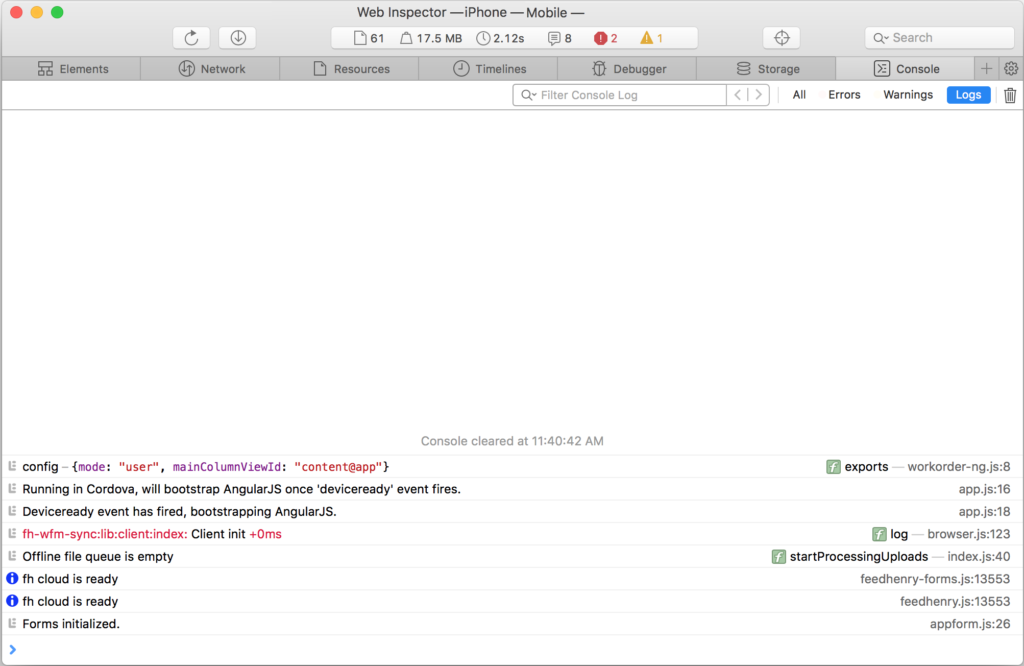
Console
You can see all the console errors or warnings and evaluate variables in this section.
Related: How to set up your apps to target locally on a device.
Red Hat Mobile Application Platform is available for download, and you can read more at Red Hat Mobile Application Platform.
Last updated: October 31, 2023