This article covers new features in the latest release of both the Red Hat build of OpenTelemetry and Red Hat OpenShift distributed tracing.
First of all, apart from all the features shared below, let’s start by sharing that both releases come with support for certificate rotation. By automatically reloading the new certificates, the process of certificate renewal is made transparent to users in Tempo and OpenTelemetry pods.
What’s new in OpenTelemetry?
The Red Hat build of OpenTelemetry 3.3 is based on the open source OpenTelemetry operator release 0.107.0.
As usual, there’s a lot going on in the OpenTelemetry space, and this release continues expanding the capabilities of this observability component. Let’s start with something that we believe will help users in their application observability and integration efforts.OpenTelemetry
OpenTelemetry collector dashboards
We all know that, despite observability being designed to help debugging and troubleshooting complicated issues, configuring it and checking that everything is going well throughout the data pipelines can rapidly become very tedious. That’s why in this release we have added the OpenTelemetry collector dashboard as part of the OpenShift console.
With this release, once the Red Hat build of OpenTelemetry is installed, users can navigate directly into the Observe section and find the OpenTelemetry Collector dashboard, as shown in Figure 1.
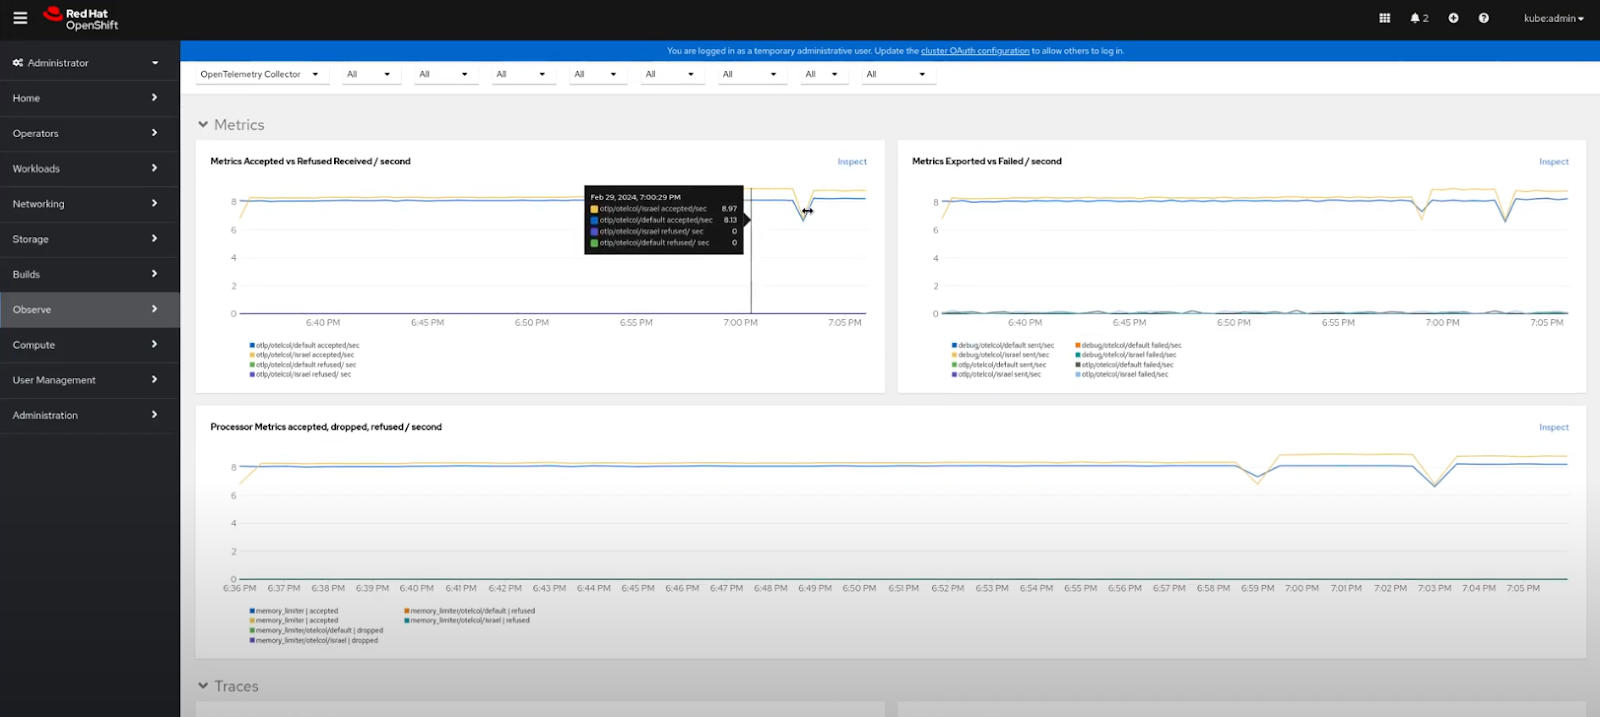
This dashboard is embedded directly in the Red Hat OpenShift platform, which means that users don’t need to leverage on any other third-party tools than the Red Hat build of OpenTelemetry and the User Workload Monitoring to directly obtain observability insights, such as:
- Amount of data processed.
- Ratio between ingested and rejected or failed data.
- Per-signal based information.
- Resources consumed by the OpenTelemetry collector.
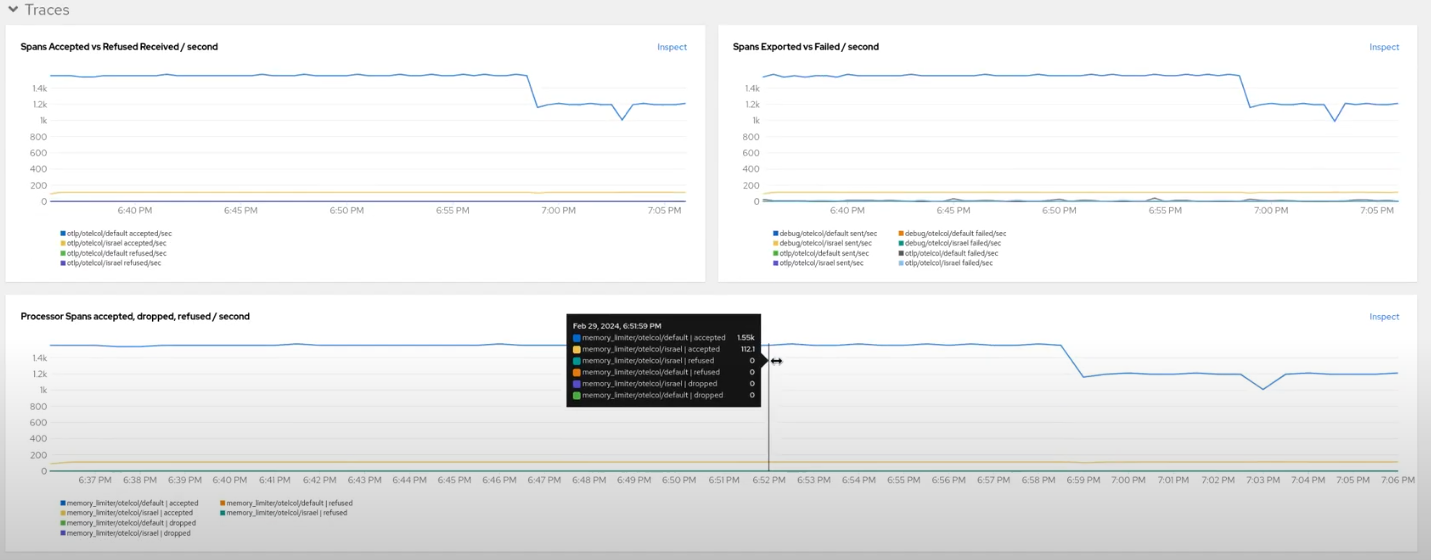
Figure 2 depicts these metrics.
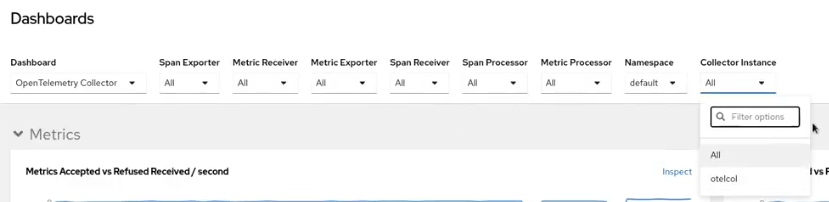
Users can also filter incoming data by many parameters: from namespace level or OpenTelemetry collector instance up to specific exporter or receiver. This information can be presented granularly or high-level, depending on needs. See Figure 3.
Don’t hesitate to try these dashboards out and let us know your feedback! We believe this is just the beginning of a journey in which we aim to give users in-platform information to help in the vast integration landscape of Observability platforms and components.
New OpenTelemetry components
This time, the Red Hat build of OpenTelemetry adds to the collector, in Technology Preview, the following components that, detailed below. Based on our users feedback, these features will help everybody to achieve a great experience transforming, connecting and forwarding observability data (upstream Github links are provided for context, but users can find relevant configuration docs at the official documentation page, e.g., processors):
- Metrics transform processor, to rename metrics and add, transform, or delete labels.
- Group by attributes processor, to change association of telemetry data towards another desired resource.
- Routing connector, to establish routes between OpenTelemetry collector pipelines, based on resource attributes.
- Prometheus Remote Write exporter, in Developer Preview, and very soon in Technology preview, is one of the most widely used exporters, right after OTLP (check the OpenTelemetry collector survey for more info!) It allows users to send OpenTelemetry metrics to Prometheus remote write compatible backends such as Cortex, Mimir, and Thanos.
OTLP Logs are now native to OpenShift
It’s been a while since this analysis was published on the adoption of the OpenTelemetry protocol (OTLP) across OpenShift components. There, it was outlined that we still needed to enable sending logs to the OpenShift supported log store (Loki), and that's why we added the developer preview of the Loki exporter as part of our previous release.
After the awesome work of the community behind Loki and OpenShift logging teams, we can announce that all the necessary arrangements to successfully connect the OpenTelemetry collector and Loki storage are done, and will be generally available as part of the Logging 6 major release.
Now that this milestone has been achieved, we will remove the Loki exporter in our next release.
What’s new in distributed tracing?
Tempo operator users can now configure temporary access to AWS S3 with AWS STS, enabling a more secure method of access without local storage of the secret on the cluster.
Also, TLS is streamlined in OpenShift via service annotation when gateway/multitenancy is disabled.
As previously announced, we made the decision to deprecate Jaeger, and our support will reach end of life by November 2025. We are gathering feedback from users to help simplify the migration process. Don’t miss out the latest blog post by Andreas Gerstmayr about the Tempo Monolithic deployment to learn more about how users can leverage on this binary to obtain all the power of distributed tracing for small deployments, demo, and test setups. This is the recommended migration path of the Red Hat OpenShift distributed tracing platform (Jaeger) all-in-one deployment.
The Red Hat OpenShift distributed tracing platform 3.3 is based on the open source Grafana Tempo 2.5.0 version via the Tempo operator release v0.12.0.
What’s next?
Looking ahead, we are already preparing for what’s to come in the latest release of the year, and it already looks very promising. Very soon, now that we already have some tracing capabilities in the OpenShift console, we will be adding correlation and the awaited Gantt chart view to expand our distributed tracing features.
We are also working on new components for the OpenTelemetry collector, such as an AMQP/RabbitMQ receiver and exporter.
We’ve been also adding many Technology Preview features, and now it’s time to reach General Availability to many of them, specially the instrumentation CR, that our customers are asking for.
We value your feedback, which is crucial for enhancing our products. Share your questions and recommendations with us using the Red Hat OpenShift feedback form.