The main focus of this article is to demonstrate how to instrument React applications to make them observable. For a good overview of observability and OpenTelemetry, please take a look at the article, Observability in 2022: Why it matters and how OpenTelemetry can help.
10-step OpenTelemetry demonstration
Related to the OpenTelemetry, we are using the following:
- Auto instrumentation via sdk-trace-web and a plugin to provide auto instrumentation for fetch.
- OpenTelemetry Collector (also known as
OTELCOL). - Jaeger
- Basic collector deployment pattern. For more information about
OTELCOLdeployment patterns, please take a look at OpenTelemetry Collector Deployment Patterns.
Step 1. Set up prerequisites
In this demo, we are going to use Docker and docker-compose. You can refer to Docker and docker-compose to learn more.
Step 2. Run the React application example
You will be using a front-end react application that contains the sample React application code that we will instrument. Please note that the repository also contains an Express application as a back end, but the focus of this tutorial is to instrument the front end only.
The front-end application contains a button that calls the back end using Express and a scroll component that calls the https://randomuser.me/ free public API. We are going to delegate to OpenTelemetry libraries the job of capturing traces for the button and the scroll component. So every time the user clicks on the button or scrolls the page, the auto-instrumentation plugin will generate traces for this.
Clone the following GitHub repository from the command line:
git clone https://github.com/obs-nebula/frontend-react.git
Step 3. Instrument the React application
The following list shows the dependencies we added. You may want to use newer versions, depending on when you are reading this article:
"@opentelemetry/exporter-trace-otlp-http": "^0.35.0",

"@opentelemetry/instrumentation": "^0.35.0",

"@opentelemetry/instrumentation-fetch": "^0.35.0",

"@opentelemetry/resources": "^1.9.1",

"@opentelemetry/sdk-trace-web": "^1.8.0",

"@opentelemetry/semantic-conventions": "^1.9.1"
Create a file named tracing.js that will load OpenTelemetry. We are going to share more details in the following subsections. The content of the front-end/src/tracing.js file is as follows:
const { Resource } = require('@opentelemetry/resources');

const { SemanticResourceAttributes } = require('@opentelemetry/semantic-conventions');

const { WebTracerProvider, SimpleSpanProcessor, ConsoleSpanExporter } = require('@opentelemetry/sdk-trace-web');

const { OTLPTraceExporter }  = require('@opentelemetry/exporter-trace-otlp-http');

const { registerInstrumentations } = require('@opentelemetry/instrumentation');

const { FetchInstrumentation } = require('@opentelemetry/instrumentation-fetch');

const consoleExporter = new ConsoleSpanExporter();

const collectorExporter = new OTLPTraceExporter({

  headers: {}

});

const provider = new WebTracerProvider({

  resource: new Resource({

    [SemanticResourceAttributes.SERVICE_NAME]: process.env.REACT_APP_NAME

  })

});

const fetchInstrumentation = new FetchInstrumentation({});

fetchInstrumentation.setTracerProvider(provider);

provider.addSpanProcessor(new SimpleSpanProcessor(consoleExporter));

provider.addSpanProcessor(new SimpleSpanProcessor(collectorExporter));

provider.register();

registerInstrumentations({

  instrumentations: [

    fetchInstrumentation

  ],

  tracerProvider: provider

});

export default function TraceProvider ({ children }) {

  return (

   <>

      {children}

   </>

  );

}
Step 4. Import the required modules
Next, you will need to import the OpenTelemetry modules. As you can see, we can get the ConsoleSpanExporter and SimpleSpanProcessor from the @opentelemetry/sdk-trace-web so we don’t need to add an extra dependency for this.
const { Resource } = require('@opentelemetry/resources');

const { SemanticResourceAttributes } = require('@opentelemetry/semantic-conventions');

const { WebTracerProvider,SimpleSpanProcessor, ConsoleSpanExporter } = require('@opentelemetry/sdk-trace-web');

const { OTLPTraceExporter }  = require('@opentelemetry/exporter-trace-otlp-http');

const { registerInstrumentations } = require('@opentelemetry/instrumentation');

const { FetchInstrumentation } = require('@opentelemetry/instrumentation-fetch');
Step 5. Initialize the tracer
Since we are using React with JavaScript, to initialize the OpenTelemetry tracer, you will need to create a new instance of the TraceProvider and pass it as a property to your root React component. You can do this by adding the following code to your main application file, in our case, that is in index.js file.
import TraceProvider from './tracing';

const root = ReactDOM.createRoot(document.getElementById('root'));

root.render(

  <TraceProvider>

    <App />

  </TraceProvider>

);
Step 6. Create an OTELCOL exporter instance
To export the traces to OTELCOL, you will need to create an instance of OTLPTraceExporter.
Note that we are adding a workaround to use XHR instead of sendBeacon, as described in this OpenTelemetry JS upstream issue. With that, we can fix the CORS problem when exporting.
const collectorExporter = new OTLPTraceExporter({

headers: {}

});
Step 7. Create the otel-collector-config file
Now let’s take a look at the yaml file content. To configure the OTELCOL, you will need to create a new file called otel-collector-config.yaml in your root directory. In this file, we are going to configure the receiver, processor, and exporters (using Jaeger and logging as exporters).
receivers:

  otlp:

    protocols:

      http:

        cors:

          allowed_origins: ["*"]

          allowed_headers: ["*"]

exporters:

  logging:

    verbosity: Detailed

  jaeger:

    endpoint: jaeger-all-in-one:14250

    tls:

      insecure: true

processors:

  batch:

service:

  telemetry:

    logs:

      level: "debug"

  pipelines:

    traces:

      receivers: [otlp]

      exporters: [logging, jaeger]

      processors: [batch]
Step 8. Create a docker compose file
Create a docker-compose file and define the services for OTELCOL, Jaeger, and the application as follows:
version: "2"

services:

  front-end:

    build:

      context:./front-end

    depends_on:

      - express-server

    ports:

      - "3000:3000"

    env_file:

     -./front-end/src/.env

  express-server:

    build:

      context:./express-server

    ports:

      - "5000:5000"

  collector:

    image: otel/opentelemetry-collector:latest

    command: ["--config=/otel-collector-config.yaml"]

    volumes:

      - './otel-collector-config.yaml:/otel-collector-config.yaml'

    ports:

      - "4318:4318"

    depends_on:

      - jaeger-all-in-one

   # Jaeger

  jaeger-all-in-one:

    hostname: jaeger-all-in-one

    image: jaegertracing/all-in-one:latest

    ports:

      - "16685"

      - "16686:16686"

      - "14268:14268"

      - "14250:14250"
Step 9. Start the services
Once you have created OTELCOL config and Docker compose files, you can start the services by running the following command in your terminal:
$docker-compose up
Once the services are started you can access the react application at http://localhost:3000.
As mentioned previously, every time the users scroll the page, it will generate random data through an API call and the OpenTelemetry will generate traces based on the scrolling activity.
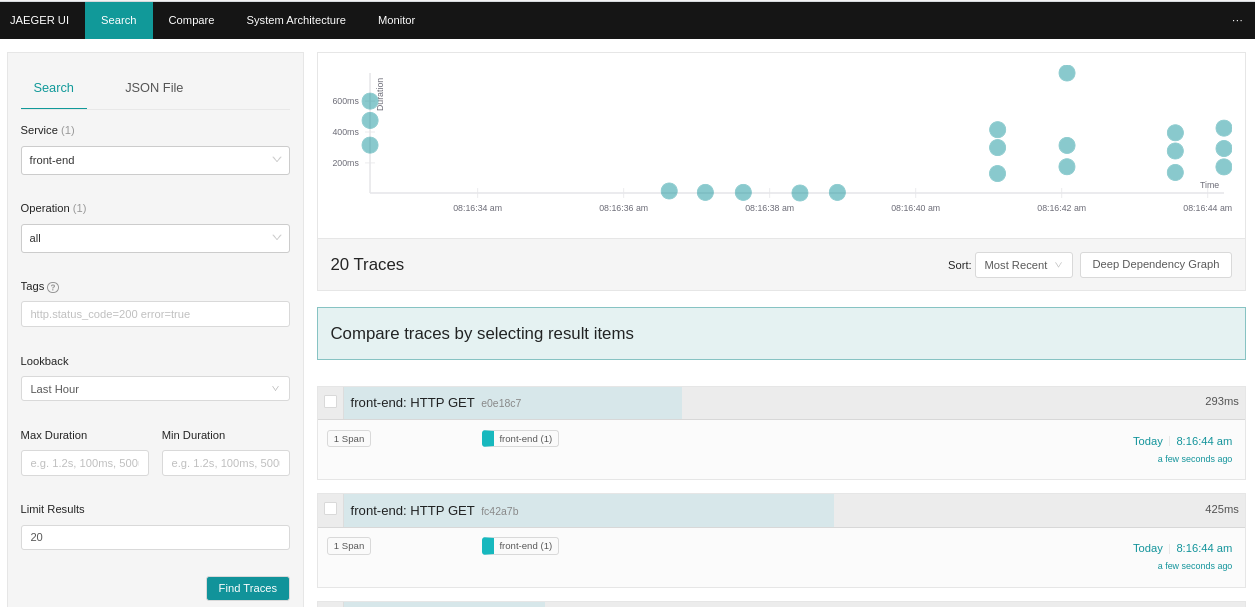
Step 10. View the traces in Jaeger
You can view the traces in the Jaeger UI by navigating to http://localhost:16686. The horizontal circles in the chart represent button clicks, and the vertical circles represent scrolling activity, as shown in Figure 1.
Let's click on one of the horizontal items and expand the trace detail as shown in Figure 2:
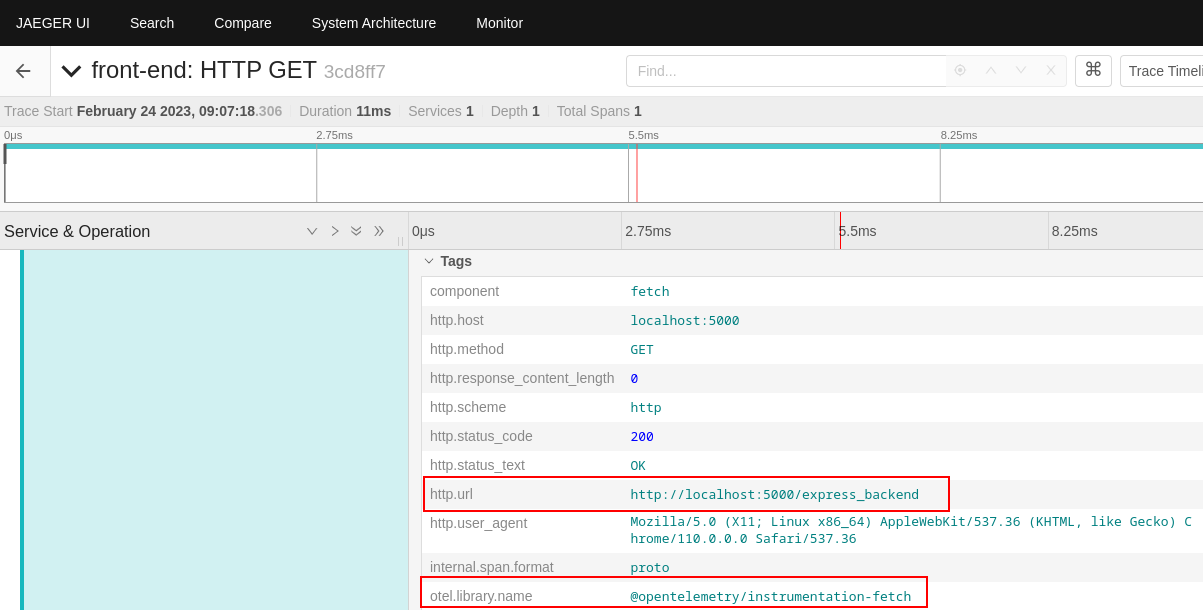
We can see in Figure 2 that the Express back end was called, and the OpenTelemetry library name that is responsible for this trace generation.
Now let’s click in one vertical circle as shown in Figure 3:

We can see in Figure 3 that scrolling activity is calling an external API.
Collecting and analyzing telemetry data
You have successfully enabled OpenTelemetry in your React application using the OpenTelemetry collector and Jaeger. You can now start collecting and analyzing telemetry data. You can use the Jaeger UI to view traces, identify performance bottlenecks, and gain deeper understanding about what the React application is doing when calling external systems.
Further reading
Want to learn more about observability and OpenTelemetry? Check out these articles:
Last updated: August 14, 2023