Numerous adaptations of the Linux kernel—notably seccomp, SELinux, and AppArmor—bolster its security through runtime checks on sensitive activities such as file access and system calls (syscalls). In particular, seccomp denies access to system calls that don't match rebuild profiles of allowed calls. But the creation of seccomp profiles for Kubernetes workloads can be a major obstacle to deploying containerized applications. Those profiles have to be maintained over the complete life cycle of the application because changing the code might require changes to the seccomp rules as well.
To overcome this burden, it would be absolutely stunning if developers could record seccomp profiles by running a test suite against the application and automatically deploy the results together with the application manifest. But how to record seccomp profiles? Well, the Security Profiles Operator in Kubernetes offers several ways to record activity. This article shows how to use the Operator to secure your applications and how the recorder that uses extended Berkeley Packet, eBPF (or just BPF) does the job.
What is the Security Profiles Operator?
The Security Profiles Operator is a project sponsored by the Node Special Interest Group, which aims to make security easier on Kubernetes. Right now, the Operator offers Custom Resource Definitions (CRDs) that support seccomp, SELinux, and AppArmor.
The CRDs ship with many features, one of which records security profiles from running workloads. Several types of recorders are available by default:
- The OCI hook, a syscall recorder for seccomp compatible with the Open Container Initiative specification.
- The auditd log tracing recorder for SELinux and seccomp.
- The new BPF-based recorder.
This article focuses on the BPF recorder because it's one of the latest and most experimental additions to the Security Profiles Operator.
Demo of the BPF recorder
The following subsections show how easy it is to install the recorder, run sessions, and incorporate the results into a secure application. This example records system calls issued by the nginx web server.
Install and configure the Operator
First of all, we have to get the Operator up and running.
cert-manager has to be installed before the Operator can run. I'm running my tests on Red Hat OpenShift 4.9, which does not ship cert-manager out of the box, but the installation is fairly straightforward:
$ kubectl apply -f https://github.com/jetstack/cert-manager/releases/download/v1.6.1/cert-manager.yaml
When all the cert-manager pods are in a running state, deploy the Security Profiles Operator:
$ kubectl apply -f https://raw.githubusercontent.com/kubernetes-sigs/security-profiles-operator/master/deploy/operator.yaml
Switch to the Operator's namespace to simplify further commands:
$ kubectl config set-context --current --namespace=security-profiles-operator
The BPF recording feature is disabled in the Operator configuration by default because the recorder runs with high privileges on the hostPID process. To enable the recorder, patch the configuration of the Operator daemon running on every node to set enableBpfRecorder to true:
$ kubectl patch spod spod --type=merge -p '{"spec":{"enableBpfRecorder":true}}'
securityprofilesoperatordaemon.security-profiles-operator.x-k8s.io/spod patched
The Operator now rolls out new DaemonSet pods, which can take a bit of time depending on the cluster size. After the rollout finishes, every pod should be running the BPF recorder in one of its containers, as you can tell by checking their logs:
$ kubectl logs ds/spod -c bpf-recorder
Found 6 pods, using pod/spod-h7dpm
I1115 12:02:45.991786  110307 main.go:182]  "msg"="Set logging verbosity to 0"
I1115 12:02:45.991901  110307 deleg.go:130] setup "msg"="starting component: bpf-recorder"  "buildDate"="1980-01-01T00:00:00Z" "compiler"="gc" "gitCommit"="unknown" "gitTreeState"="clean" "goVersion"="go1.16.9" "libseccomp"="2.5.1" "platform"="linux/amd64" "version"="0.4.0-dev"
I1115 12:02:45.991955  110307 bpfrecorder.go:105] bpf-recorder "msg"="Setting up caches with expiry of 1h0m0s"
I1115 12:02:45.991973  110307 bpfrecorder.go:121] bpf-recorder "msg"="Starting log-enricher on node: ip-10-0-228-234.us-east-2.compute.internal"
I1115 12:02:45.994232  110307 bpfrecorder.go:152] bpf-recorder "msg"="Connecting to metrics server"
I1115 12:02:48.373469  110307 bpfrecorder.go:168] bpf-recorder "msg"="Got system mount namespace: 4026531840"
I1115 12:02:48.373518  110307 bpfrecorder.go:170] bpf-recorder "msg"="Doing BPF load/unload self-test"
I1115 12:02:48.373529  110307 bpfrecorder.go:336] bpf-recorder "msg"="Loading bpf module"
I1115 12:02:48.373570  110307 bpfrecorder.go:403] bpf-recorder "msg"="Using system btf file"
I1115 12:02:48.373770  110307 bpfrecorder.go:356] bpf-recorder "msg"="Loading bpf object from module"
I1115 12:02:48.403766  110307 bpfrecorder.go:362] bpf-recorder "msg"="Getting bpf program sys_enter"
I1115 12:02:48.403792  110307 bpfrecorder.go:368] bpf-recorder "msg"="Attaching bpf tracepoint"
I1115 12:02:48.406205  110307 bpfrecorder.go:373] bpf-recorder "msg"="Getting syscalls map"
I1115 12:02:48.406287  110307 bpfrecorder.go:379] bpf-recorder "msg"="Getting comms map"
I1115 12:02:48.406862  110307 bpfrecorder.go:396] bpf-recorder "msg"="Module successfully loaded, watching for events"
I1115 12:02:48.406908  110307 bpfrecorder.go:677] bpf-recorder "msg"="Unloading bpf module"
I1115 12:02:48.411636  110307 bpfrecorder.go:176] bpf-recorder "msg"="Starting GRPC API server"
The recorder does a system sanity check on startup to ensure everything works as expected. In our case, everything went well and we're ready to record.
Recording your first profile
The Security Profiles Operator ships with custom resources for its recordings. This means that a recording is a dedicated object and refers to a label selector. This selector links the workload being recorded to the actual logic behind the scenes.
As an example, define this recording:
apiVersion: security-profiles-operator.x-k8s.io/v1alpha1
kind: ProfileRecording
metadata:
  name: my-recording
spec:
  kind: SeccompProfile
  recorder: bpf
  podSelector:
    matchLabels:
      app: nginx
This example uses the name my-recording, which will appear in the resulting seccomp profile and can be used to identify the results. You also have to select a kind of SeccompProfile and a target recorder of bpf. The podSelector matches all workloads within the cluster containing the label app: nginx.
By saving the recording in a file named recording.yml, you can finally create the resource:
$ kubectl create -f recording.yml
profilerecording.security-profiles-operator.x-k8s.io/my-recording created
Now you can run our workload, the following Deployment of nginx:
apiVersion: apps/v1
kind: Deployment
metadata:
  name: my-deployment
spec:
  selector:
    matchLabels:
      app: nginx
  replicas: 1
  template:
    metadata:
      labels:
        app: nginx
    spec:
      containers:
        - name: nginx
          image: nginxinc/nginx-unprivileged:1.21.4
Run the deployment in the usual manner, saving results to a file:
$ kubectl create -f deployment.yml
deployment.apps/my-deployment created
If the pod is in a running state, the Operator daemon indicates in its logs that it started recording the workload:
$ export NODE=$(kubectl get pod -l app=nginx -o jsonpath="{.items[0].spec.nodeName}")
$ export POD=$(kubectl get pods -l name=spod --field-selector spec.nodeName="$NODE" --no-headers -o custom-columns=:metadata.name)
$ kubectl logs $POD -c bpf-recorder
…
I1115 12:12:30.029216   66106 bpfrecorder.go:654] bpf-recorder "msg"="Found container ID in cluster"  "containerID"="c2e10af47011f6a61cd7e92073db2711796f174af35b34486967588ef7f95fbc" "containerName"="nginx"
I1115 12:12:30.029264   66106 bpfrecorder.go:539] bpf-recorder "msg"="Saving PID for profile"  "mntns"=4026533352 "pid"=74384 "profile"="my-recording-nginx-0-1636978341"
I1115 12:12:30.029428   66106 bpfrecorder.go:512] bpf-recorder "msg"="Using short path via tracked mount namespace"  "mntns"=4026533352 "pid"=74403 "profile"="my-recording-nginx-0-1636978341"
I1115 12:12:30.029575   66106 bpfrecorder.go:512] bpf-recorder "msg"="Using short path via tracked mount namespace"  "mntns"=4026533352 "pid"=74402 "profile"="my-recording-nginx-0-1636978341"
…
Now it is time to run a test suite against our application. This will ensure that all necessary code paths have been executed and all system calls are part of the produced profile. How do you test a web server? By making a URL request against it and verifying the response:
$ kubectl port-forward $(kubectl get pod -l app=nginx --no-headers -o custom-columns=:metadata.name) 8080 &
Forwarding from 127.0.0.1:8080 -> 8080
Forwarding from [::1]:8080 -> 8080
$ curl localhost:8080
Handling connection for 8080
<!DOCTYPE html>
<html>
<head>
<title>Welcome to nginx!</title>
…
Stop the recording by removing the workload after the tests finish:
$ kubectl delete -f deployment.yml
The seccomp profile is now available as a custom resource. Due to Operator magic, it has been synchronized to every node within the cluster:
$ kubectl get sp my-recording-nginx-0 -o yaml
apiVersion: security-profiles-operator.x-k8s.io/v1alpha1
kind: SeccompProfile
metadata:
  creationTimestamp: "2021-11-15T12:07:38Z"
  finalizers:
  - ip-10-0-179-0.us-east-2.compute.internal-delete
  - ip-10-0-228-234.us-east-2.compute.internal-delete
  - ip-10-0-174-86.us-east-2.compute.internal-delete
  - ip-10-0-151-235.us-east-2.compute.internal-delete
  - ip-10-0-164-140.us-east-2.compute.internal-delete
  - ip-10-0-252-238.us-east-2.compute.internal-delete
  generation: 1
  name: my-recording-nginx-0
  namespace: security-profiles-operator
  resourceVersion: "53283"
  uid: e3538006-44c0-42c4-baa6-ededfdc60293
spec:
  defaultAction: SCMP_ACT_ERRNO
  syscalls:
  - action: SCMP_ACT_ALLOW
    names:
    - accept4
    - access
    - arch_prctl
    …
    - writev
status:
  conditions:
  - lastTransitionTime: "2021-11-15T12:07:42Z"
    reason: Available
    status: "True"
    type: Ready
  localhostProfile: operator/security-profiles-operator/my-recording-nginx-0.json
  status: Installed
Add the profile to the securityContext of the container to use the profile with seccomp:
apiVersion: apps/v1
kind: Deployment
metadata:
  name: my-deployment
spec:
  selector:
    matchLabels:
      app: nginx-seccomp
  replicas: 3
  template:
    metadata:
      labels:
        app: nginx-seccomp
    spec:
      containers:
        - name: nginx
          image: nginxinc/nginx-unprivileged:1.21.4
          securityContext:
            seccompProfile:
              type: Localhost
              localhostProfile: operator/security-profiles-operator/my-recording-nginx-0.json
Wow, that was quick--we recorded a custom seccomp profile over the course of a few minutes and are able to use it immediately!
How does the BPF recorder work?
This section helps you understand the capabilities and limitations of the BPF recorder.
A highly portable BPF application
The core of the BPF-based seccomp recorder is, as the name indicates, a small BPF application. For security reasons, the BPF program is loaded into the Linux kernel only if a recording has started. The program gets automatically unloaded if the recording stops and no other recording is started inside the cluster.
To increase the portability of the Operator, we wrote a "compile once - run everywhere" (CO-RE) program using libbpf. The build result is embedded into the Operator and can be loaded directly from there. It supports amd64 and arm64 architectures.
The program consults the vmlinux.h file to support older kernel versions that do not expose the required BPF Type Format (BTF). The build process of the Operator creates a custom generated BTF by using the bfthub project from Aqua Security. This project allows us to support more than 500 kernels that are too old or are not configured to expose their own BTF file. A custom continuous integration (CI) test ensures that the generated files are all up to date if the content of the BPF application changes.
Control flow
The basic control flow of the BPF recording mechanism involves the following components:
- An independent webhook
- Profile Recorder
- BPF Recorder
- BPF Program
The webhook adds a profile recording annotation to the workload if the label selector matches. The other three components interact as shown in Figure 1.
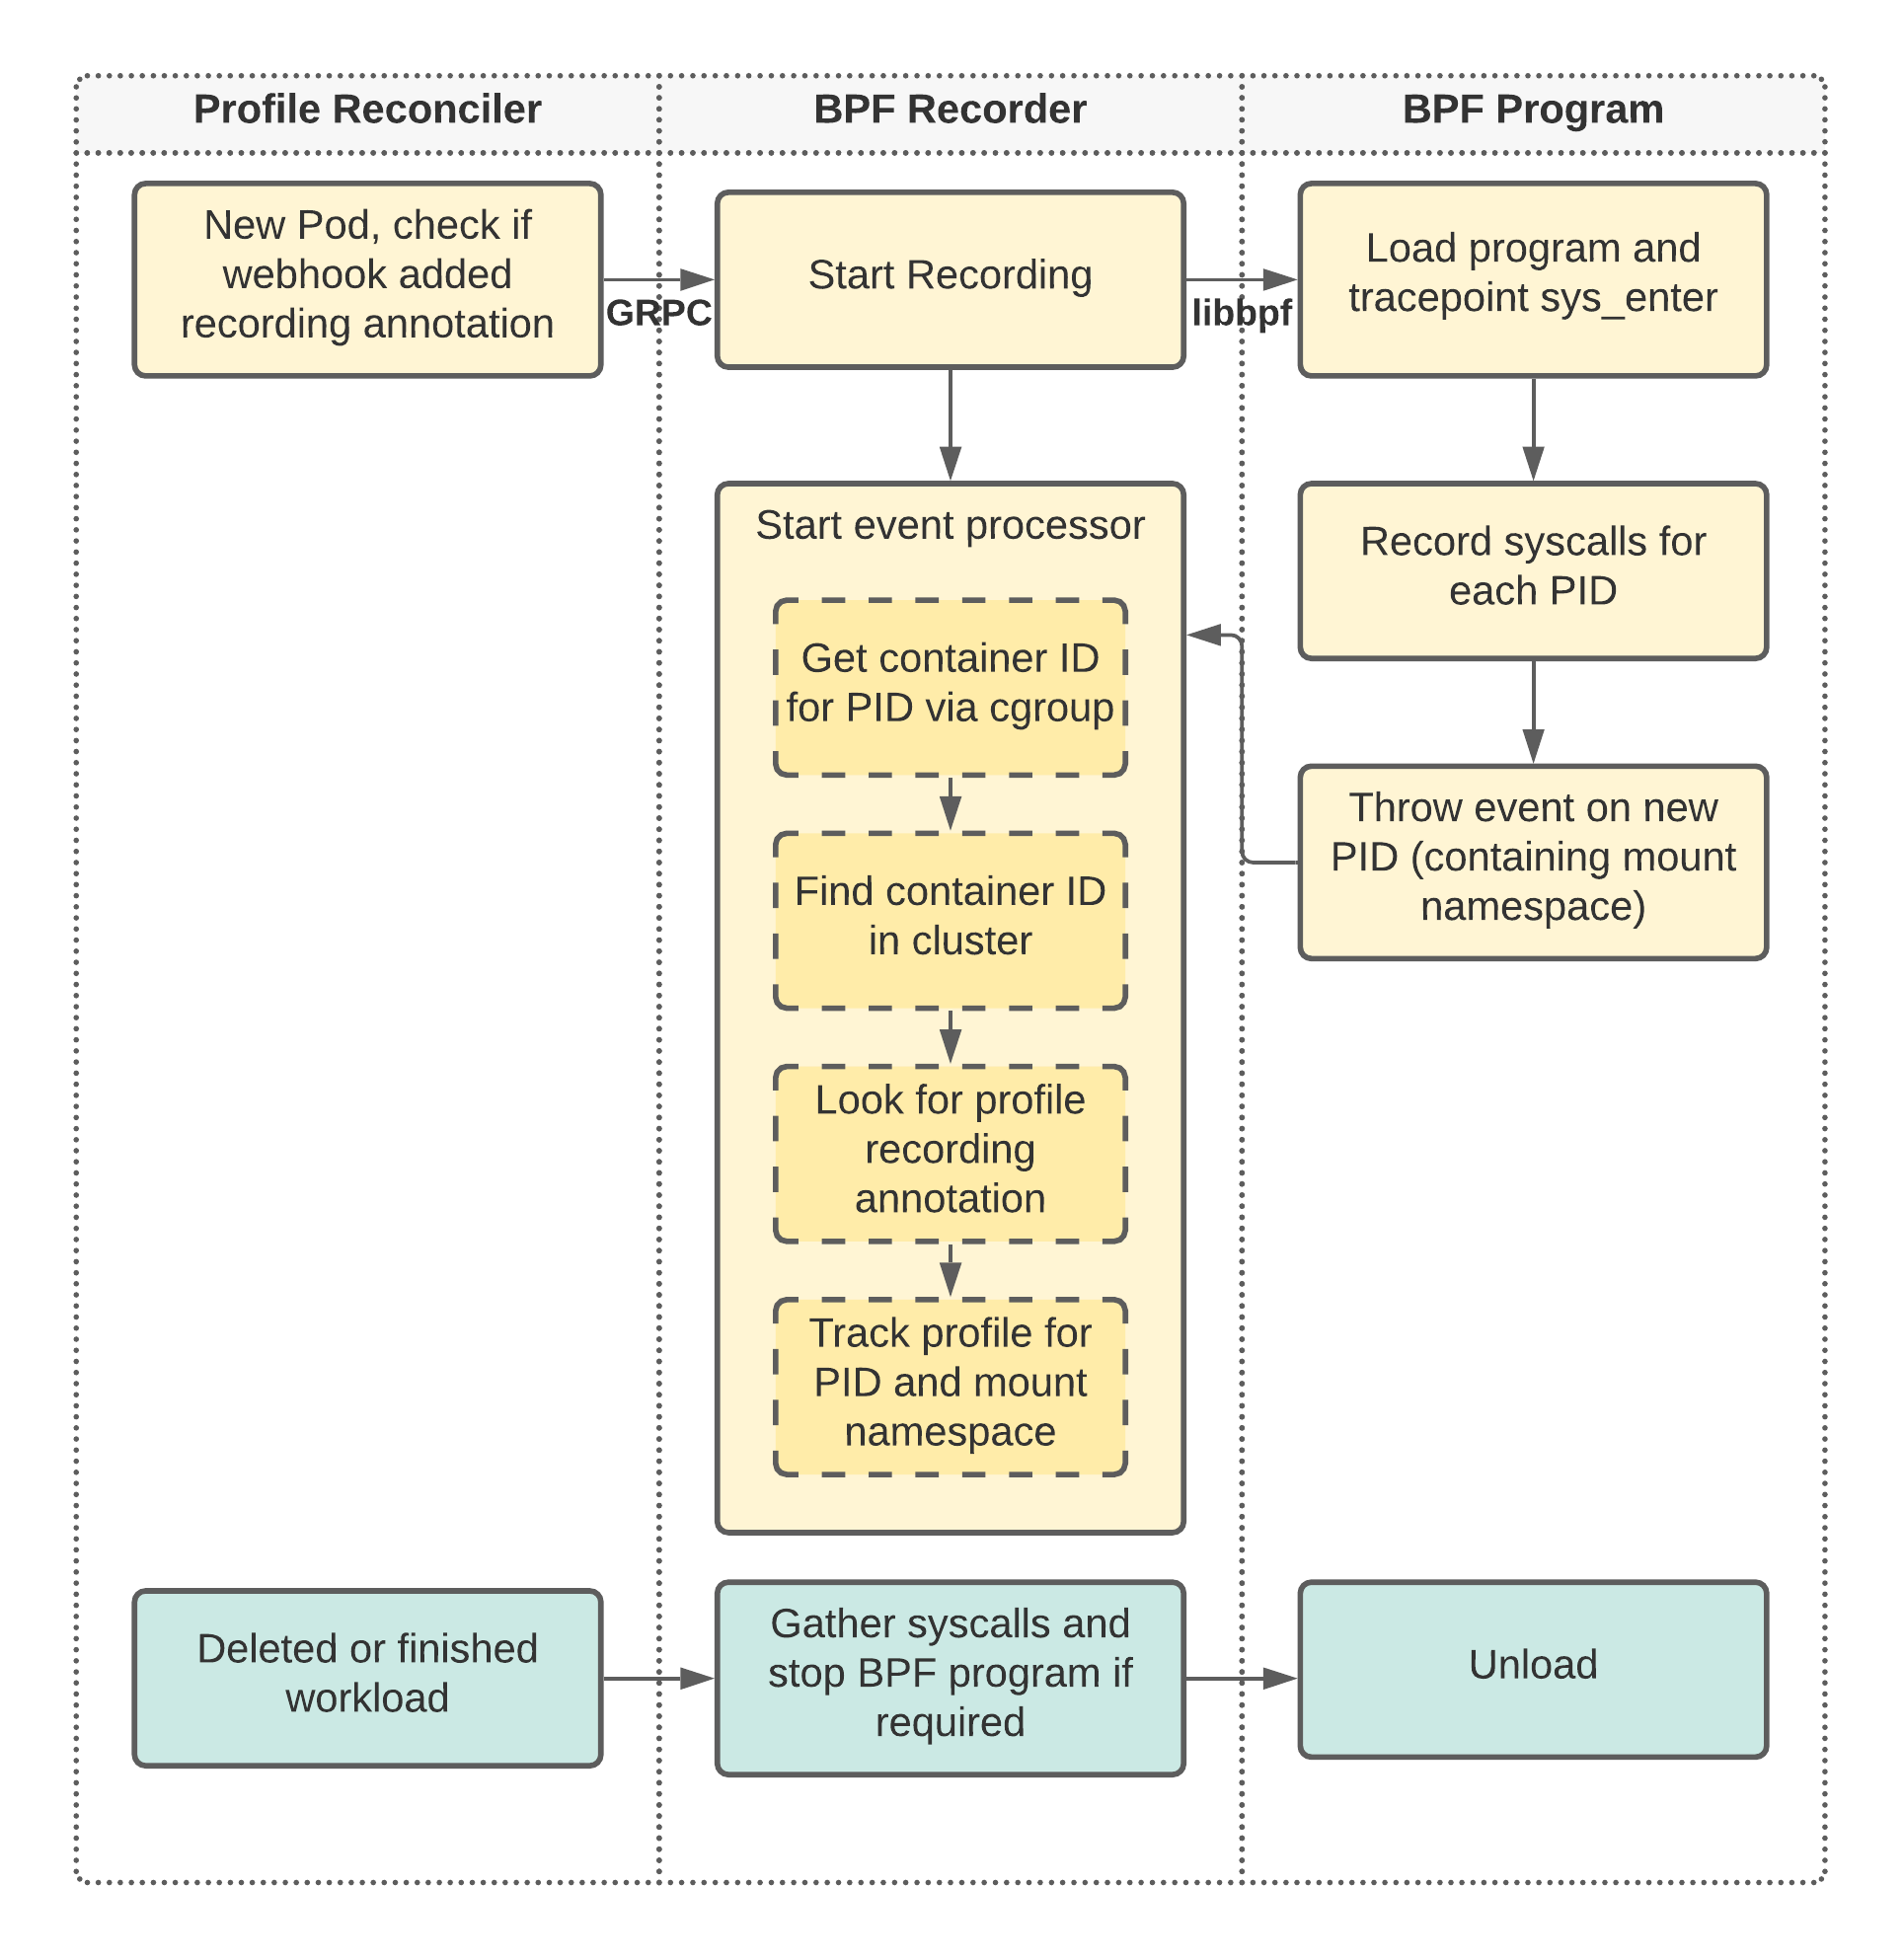
The Profile Reconciler sends data to the BPF Recorder via a gRPC UNIX domain socket. Data is sent when one or more recording annotations have been found on the target workload. Then the BPF Recorder loads the BPF Program, if that has not already been done. The BPF Program may already be loaded if multiple recordings are ongoing in parallel.
The BPF Program attaches the sys_enter tracepoint, which is called for every process on the system before the invocation of any system call. This tracepoint allows the BPF Program to record every system call for every process ID (PID) in the kernel. If a PID that has not been seen before enters the tracepoint, the BPF Program throws an event into a predefined ring buffer, which gets analyzed by the BPF Recorder in its event processing routine.
A time-critical action then takes place inside the event processor: Every new PID has to be analyzed by finding its possible container ID via its Control group (cgroup) path (which can be found in /proc/$PID/cgroup). If the container ID (consisting of 64 hexadecimal digits) has been found, the routine then tries to find that container within the cluster. Only when the container is inside the cluster and the corresponding profile recording annotations match does the event processor start tracking the profile.
There is also a fast path that omits retrieval of all containers for every new PID within the cluster and reduces file system access during the recording. The mount namespace usually does not change within containers, so the program can use the mount namespace ID obtained by the BPF Program as an identifier to fast-track PIDs in containers that were found earlier on. This optimization results in log messages like:
"msg"="Using short path via tracked mount namespace" "mntns"=4026533352 "pid"=74403 "profile"="my-recording-nginx-0-1636978341"
If the workload gets deleted or stops running, the Profile Reconciler tries to collect the system calls from the BPF Recorder via gRPC and unloads the BPF Program if no other recordings are running.
The Profile Recorder then receives a unique list of system calls for all recorded PIDs within the container. Those system calls are reconciled into a new SeccompProfile resource afterward. The name of the new profile is prefixed with the recording name (my-recording in our example) and suffixed with the container name (nginx) as well as its replica (0) if it's coming from a ReplicaSet. In our case, this naming convention results in a recording called my-recording-nginx-0.
There are some other implementation details not covered in this explanation: For example, the internal hash maps have to be cleaned up at certain points in time, and we use internal caches for the container IDs retrieved from the cgroup. The process has a limitation: It can't track very short-lived containers because it needs some time to look up the initial PID and correlate it to the profile annotation.
Conclusion
I hope in this article to bring you closer to the world of seccomp profile creation and how you can utilize eBPF within the Security Profiles Operator to simplify the workflow. Feel free to give the Operator a try and post a comment to this article if you have any questions.
Last updated: September 20, 2023