Autoscaling plays an important role in cloud-native applications, ensuring both efficiency and reliability. It automatically adapts resource allocation in response to current demands, scaling up during peak periods to maintain stable performance and scaling back in quieter times to reduce costs. This flexibility is especially useful for handling unpredictable traffic, ensuring applications stay responsive without using more resources than necessary. Essentially, autoscaling helps manage cloud applications effectively and cost-efficiently.
The custom metrics autoscaler operator enhances Red Hat OpenShift scaling capabilities, particularly for event-driven applications. Unlike the standard Horizontal Pod Autoscaler (HPA), which primarily scales applications based on CPU and memory metrics, these metrics are not always the best indicators of the actual demand or performance requirements of an application. For instance, CPU and memory usage might remain low even when an application is processing a high volume of requests or data. This mismatch can lead to underutilization of resources or, on the contrary, an inability to handle peak demands effectively.
The custom metrics autoscaler operator introduces sophisticated scaling strategies. It can dynamically adjust resources in response to events from external sources like Kafka, offering fine-grain control over application scaling. Additionally, custom metrics autoscaler allows you to scale workloads down to zero, optimizing resource utilization and cost-effectiveness when there's no active workload. By integrating external metrics, the custom metrics autoscaler operator simplifies managing serverless workloads in OpenShift, making it a robust solution for real-time, event-driven scaling requirements. The custom metrics autoscaler is based on the KEDA (Kubernetes event-driven autoscaler) project which provides a large set of scalers. In this article, we will focus on the Kafka scaler which allows you to scale your application based on consumer lag.
Kafka scaler
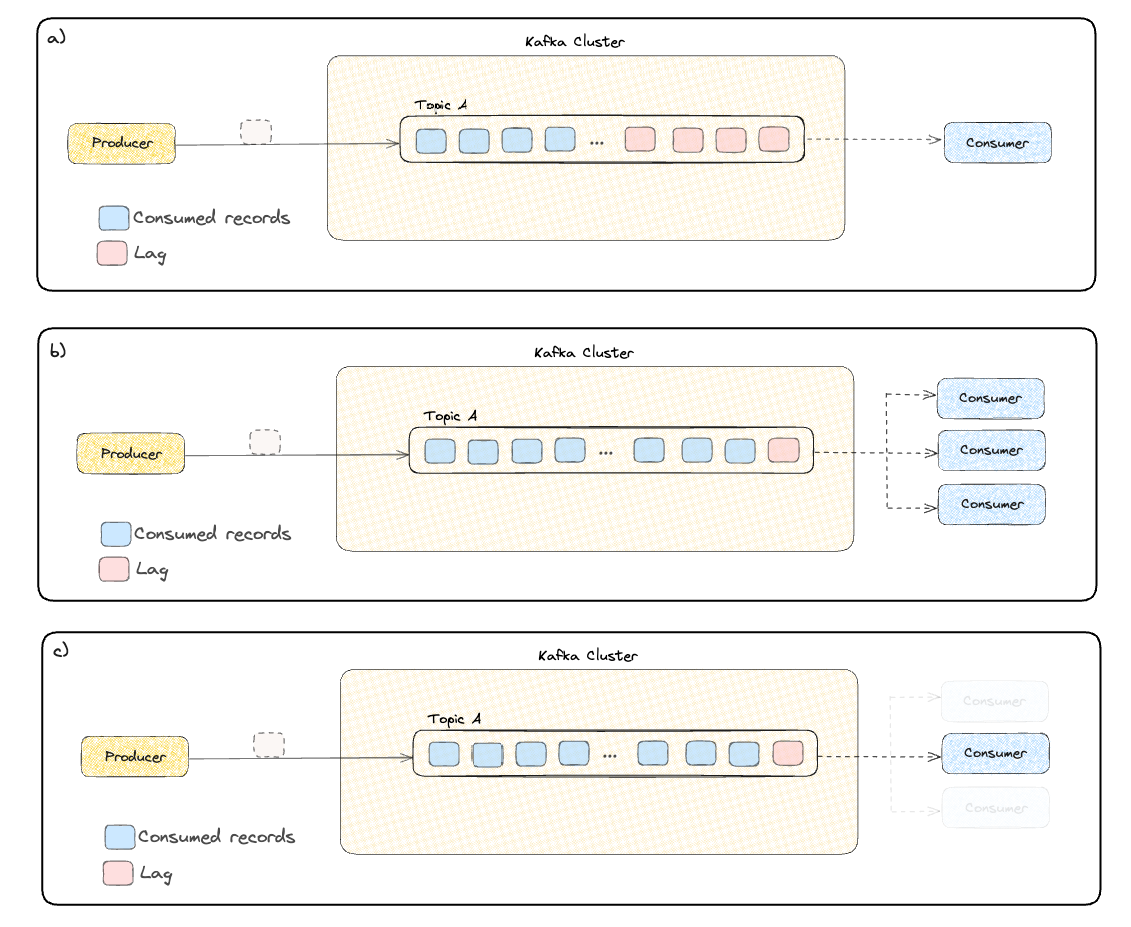
The Kafka scaler monitors consumer lag in Kafka topics to dynamically scale your consumer applications. Consumer lag specifically refers to the difference between the latest message produced and the last message processed by the consumer. This focus on consumer lag allows for a more precise scaling based on how effectively the application is processing the incoming records. When the consumer lag exceeds a given threshold, signaling that the application is falling behind in processing incoming messages, the operator scales up the number of application instances to handle the increased load. As the lag decreases, indicating that messages are being processed as expected, it reduces the number of instances. This ensures efficient processing of Kafka messages, scaling resources up or down based on real-time demand, and maintaining optimal application performance.
For example, Figure 1 shows the logic behind scaling up and down the consumer application based on consumer lag. In Figure 1(a), the lag is large, and it seems that the consumer is not able to keep up with the upcoming records. In Figure 1(b), the custom metrics autoscaler operator scaled up the consumer application, and the consumer lag decreased. In Figure 1(c), the application is scaled down since the consumer lag decreased.
Architecture
In this section, we will see the architecture of the custom metrics autoscaler in the context of a Kafka scaler and how the components are connected and how they work together.
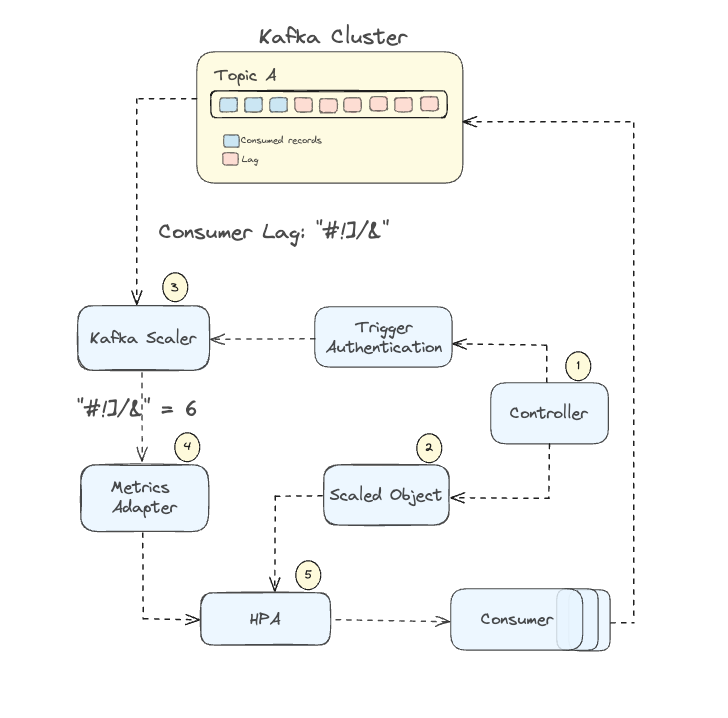
- Controller: The Controller continuously observes configured ScaledObject resources, orchestrating the dynamic scaling of workloads based on the defined metric triggers and criteria, ensuring optimal resource allocation. Once the controller detects a ScaledObject resource, it will get the information from the ScaledObject and create an Horizontal Pod Autoscaler for your application.
- ScaledObject specifies the metrics and triggers to be monitored, enabling the controller to efficiently manage the scaling of workloads in response to metric fluctuations.
- Metrics Adapter: The metrics adapter translates raw metrics, such as consumer lag in our case, into a format understandable by OpenShift, exposing these custom metrics to the HPA. The Metrics Server acts as an interface between OpenShift’s API server and external metrics, providing essential data to the HPA Controller.
- Scaler: The primary role of the scaler is to connect to an external system and retrieve metrics or data that indicates the current load or demand. In our case, the Kafka scaler uses the credentials from the TriggerAuthentication to authenticate to the Kafka cluster and retrieves the consumer lag for the specified topic and consumer group. Then, it sends the consumer lag metrics back to the metrics adapter.
- HPA: The Horizontal Pod Autoscaler evaluates the metrics it receives from the metrics adapter against the scaling criteria defined in the ScaledObject. The HPA interacts with the OpenShift API to scale the pods up/down through the deployment. Indeed, the deployment's replica count is increased in case the lag is above the threshold. In case the consumer lag is below or equal to the threshold set in the ScaledObject the replicas might be reduced to minimize resource usage.
Kafka scaler configuration
TriggerAuthentication
TriggerAuthentication is crucial for enabling the scaler to authenticate with and connect to the external system, in our case the Kafka cluster, to fetch the metrics needed for scaling decisions. The Kafka scaler requires specific authentication details like certificates, SASL mechanisms, and credentials. These details will vary based on your Kafka cluster's authentication setup. Therefore, the configuration of TriggerAuthentication must correspond to the Kafka cluster's authentication method.
SASL PLAINTEXT/SHA512 authentication
If your Kafka cluster is configured to authenticate with SASL_PLAINTEXT or SASL_SHA512 you will need a secret that contains these key-values:
|
This is the associated TriggerAuthentication CR:
|
mTLS configuration
If your Kafka cluster uses mTLS authentication configure the scaler with a secret that contains these key-values:
|
The TriggerAuthentication should look like this:
|
CAUTION: If the key is in a PKCS8 format, the custom metrics operator won’t be able to use it. You must convert it into a PKCS5 format, known as the RSA format. To do the conversion:
Convert private key in PKCS8 format into PKCS5 (RSA)
- Get your user private key and password:
oc get secret -o json -n | jq -r '.data["user.key"]'| base64 --decode > user.key - Convert pkcs8 private key into pkcs5:
openssl rsa -in user.key -out user-rsa.pem - Encode in base64:
RSA_KEY=$(base64 /path/to/user-demo-rsa.pem) - Add the encoded file into your secret:
oc patch secret ch-custom-metrics-autoscaler.demo-user -p '{"data":{"user-rsa.key":"$RSA_KEY"}}'
ScaledObject
The ScaledObject is the crucial component, acting as the custom resource where the scaler's behavior is defined, orchestrating how and when scaling occurs based on specific metrics. To better understand the available parameters, let's look at a scaledObject custom resource example.
|
- stabilizationWindowSeconds: StabilizationWindowSeconds refers to the duration, in seconds, during which previous scaling advice are taken into account when deciding whether to scale up or down your replicas. It helps your scaler to not overreact to short-term changes and instead make scaling decisions based on a slightly broader view of what's been happening recently. To give an example, let's say your system checks the scaling metrics every 10 seconds, which is your 'pollInterval', and you've set your 'StabilizationWindowSeconds' to 150 seconds. In this setup, the system will consider the most recent 15 metrics ( 150[s]/10[s]) to make a decision on whether to scale your application up or down.
- restoreToOriginalReplicaCount: If true, it will revert the deployment to its original replica count once the event-driven scaling isn’t needed. If false, it will maintain the replica count based on min/max settings.
- cooldownPeriod: The cooldown period is specifically for the scenario when scaling down to zero. For scaling from one to any higher number of replicas, this task is managed by the Kubernetes Horizontal Pod Autoscaler.
- maxReplicaCount: Maximum number of replicas the HPA can scale out to. If set too low, it might limit the application's ability to handle large workloads; too high could mean potential overuse of resources. It is important to mention that in a Kafka consumer group, the maximum effective number of consumers is limited to the number of partitions in the topic they are consuming. If you add more consumers than there are partitions, the additional consumers will be idle. Therefore, the maxReplicaCount should be set at maximum to the number of partitions your topic has.
- minReplicaCount: Minimum number of replicas the HPA should maintain for the target resource.
- pollingInterval: How often the custom metrics autoscaler should check for metrics and evaluate if scaling is required. If this value is high, scaling might not respond as quickly to changes in metrics. If it's too low, it might cause rapid fluctuations.
- idleReplicaCount: When there's no activity detected by the triggers, the target resource scales down to the 'idleReplicaCount', which is set to 0. As soon as there's any activity, the resource quickly scales up to the minReplicaCount. Currently the only supported value is 0.
- scaleTargetRef: Defines which deployment is targeted for autoscaling.
- Triggers: In the trigger section one defines which scaler to use. In our blog we use the Kafka scaler and the parameters related to the scaler, such as the topic name, bootstrap server, consumer group, threshold, etc.
- authenticaitonRef: Reference to the TriggerAuthentication object that will be used by the scaler to authenticate to the external system.
Setting the threshold
It is not always easy to define which is the appropriate threshold for your autoscaler. Therefore, we want to suggest some ideas that can help to fine tune this parameter. The first step is to analyze your consumer lag metrics allowing you to better understand your application's typical and peak workload patterns. This information is crucial for setting a threshold that accurately meets your application's needs, ensuring it scales effectively during varying load conditions. This analysis will guide you in setting an initial threshold value that's neither too low nor too high. A low threshold can lead to frequent, unnecessary scaling actions (flapping). On the other hand, if the threshold is too high, your system might be slow to respond when more resources are needed. This can lead to delays.
An alternative way is to use an iterative approach to threshold setting. Start conservatively, then fine-tune based on real-world performance data. This method involves monitoring how your system responds to different loads and adjusting the threshold to find that sweet spot. It's crucial to test your Kafka scaler under various load conditions. Load testing helps you observe the scaler's behavior and effectiveness, providing practical insights for further refining your threshold settings.
Tuning scenarios
In this section, we'll look at some common scenarios for adjusting how your application handles different workloads. These are just starting points. Each application is unique, so adjusting parameters to fit specific needs is crucial. It's important to note that these strategies are based on the assumption that you've already established a baseline threshold that aligns with your application's general needs.
- Scale Quickly (Low Inertia): This scenario is for situations where rapid response to workload changes is critical. The goal is to quickly scale up resources when there's a surge in demand (like a sudden influx of messages) and similarly scale down rapidly when the demand drops. This setup is ideal for workloads with sudden, short-term fluctuations.
- Scale Slowly (High Inertia): Here, the focus is on stability and avoiding frequent scaling, which might be unnecessary. This scenario suits workloads that change gradually over time. By scaling slowly, the system ensures a more predictable and stable operation, avoiding the potential overhead of constantly adding or removing resources.
- Known Peak Times: This setup is for predictable, cyclical workload patterns, like a daily or weekly peak in usage. By configuring the scaler to anticipate these peaks, you can ensure that sufficient resources are available during high-demand periods and scale down appropriately during off-peak times. It's about matching the resource allocation rhythm to the known workload pattern.
- Initial Load: In this scenario, the system is configured to handle the initial surge of demand effectively, which is common in scenarios like a service launch or a major update. The configuration aims to quickly ramp up resources to handle the initial load and then adjust as the workload stabilizes.
- Consistently High Load: This scenario applies to applications that consistently operate under high load conditions. Such situations might occur in consistently popular services or during extended periods of high activity. The focus here would be on ensuring that the system has enough resources to handle the load continuously, without much variation in scaling.
|
Scenario |
Stabilization Window Seconds |
Cooldown Period |
Max Replica Count |
Min Replica Count |
Polling Interval |
|
Scale Quickly (Low Inertia) |
Low value |
Minimal value |
High |
Low |
Low value |
|
Scale Slowly (High Inertia) |
Increased value |
Higher value |
Moderate |
Higher |
Increased interval |
|
Known Peak Times |
Moderate to high |
Moderate |
High |
Adjusted for average load |
Moderate |
|
Initial Load |
Low |
Low |
High |
Moderate |
Low |
|
Consistently High Load |
moderate |
Less relevant |
Very high |
High |
Moderate to high |
Summary
This article discussed the integration of the custom metrics autoscaler with the Kafka trigger, highlighting how it adjusts resources based on data processing demands. We explained key components such as TriggerAuthentication and the ScaledObject and their parameters. Also, the different components of the custom metrics autoscaler were described. Additionally, we saw how the custom metrics autoscaler can play a crucial role in managing Kafka workloads in cloud environments. Indeed, by using consumer lag metrics for more accurate scaling and moving away from traditional CPU and memory metric approaches, the custom metrics autoscaler ensures applications respond effectively to workload changes, improving both efficiency and cost management.