Red Hat OpenShift Container Platform includes a preconfigured monitoring stack which installs by default with Red Hat OpenShift. This stack provides monitoring for core OpenShift Container Platform components and Kubernetes services. A set of alerts are also included by default, which notifies cluster admins for most of the issues within an OpenShift Container Platform cluster in the web console.
Customers' questions normally fall into two categories:
- How do I monitor custom applications deployed on OpenShift?
- How can I generate alerts and notifications for user-defined metrics?
To address these questions, we will configure the OpenShift Container Platform monitoring stack for monitoring and alerts for user-defined projects and applications.
Basic concepts
Project or namespace information: By default, the following projects (or namespaces) and core monitoring components are deployed with the default OpenShift Container Platform installation:
openshift-monitoring: This project (namespace) is deployed with the core monitoring stack along with other components. These are the main components:- Prometheus: A time series database and a rule evaluation engine for metrics.
- AlertManager: Handles alerts received from Prometheus and sends alerts to external notification systems.
- Thanos Querier: This aggregates core OpenShift Container Platform metrics for user-defined projects and workloads. It provides an interface to query metrics from Prometheus for external applications like Custom Metrics Autoscaler based on KEDA and others.
openshift-user-workload-monitoring:This project (namespace) is created with default OpenShift installation, but there are no pods deployed. This project is used for monitoring user-defined projects and workloads. Cluster admin must enable user projects or workload monitoring. Once enabled, the following components or pods will be deployed automatically:Prometheus: A monitoring system based on time series DB deployed for user-defined projects/workloads monitoring
Thanos Ruler: A rule evaluation engine for Prometheus that is deployed as a separate process. It provides rule and alerting evaluation for the monitoring of user-defined projects
AlertManager (optional): Handles alerts received from Prometheus and Thanos ruler and sends user-defined alerts to external notification systems. This is optional because user-defined projects and workloads can also use AlertManager deployed in the
openshift-monitoringproject for sending alerts.
ConfigMap information: When these default monitoring stack components are deployed, if we want to perform configurations for these components, then Red Hat OpenShift provides ConfigMaps for both projects, using which cluster-admins can configure these components as per their requirements.
cluster-monitoring-config: This is the ConfigMap name for theopenshift-monitoringproject where we can define a few configurations for the monitoring stack components like retention time and size of metrics, PVCs details for prometheus, and Alertmanager to store the metrics, requests and limits, node selectors, taints or tolerations, body size limit for metrics, enabling user workload monitoring, using the same Alertmanager for user workload monitoring, etc.user-workload-monitoring-config: This is the ConfigMap name for the openshift-user-workload-monitoring project where we can define a few configurations for the monitoring stack components deployed in this project like retention time and size, PVCs, requests and limits, node selectors, unbound metrics attributes, etc.
Default monitoring stack installation points
- User workload monitoring is not configured.
- Alert notifications to external systems is not configured.
- Prometheus monitoring targets, rules, and alerts are configured for OpenShift cluster.
- OpenShift cluster alerts would be visible in OpenShift Container Platform UI under Observe → Alerting with their states like firing, silenced with different severity of warning/critical/info.
- Default monitoring dashboards are available in OpenShift Container Platform UI under Observe → Dashboard.
- Default OpenShift monitoring targets are available in OpenShift Container Platform UI under Observe → Targets.
High-level steps for setting up user project workload monitoring
- Enable user workload monitoring, same alert manager for user-defined alerting, and configurations in the
openshift-monitoringnamespace. - Perform configurations in
openshift-user-workload-monitoringnamespace (optional). - Create a user-defined project and deploy an application exposing custom metrics for monitoring.
- Create a service monitor to scrape metrics of target application deployed in the user-defined project.
- Create a prometheus alerting rule to defined thresholds for application metrics.
- Create Alertmanager configuration to send notifications to external systems.
Configuration steps
Enable user workload monitoring, configurations, and alert manager.
apiVersion: v1
kind: ConfigMap
metadata:
  name: cluster-monitoring-config
  namespace: openshift-monitoring
data:
  config.yaml: |
    prometheusK8s:
      retention: 48h                             -  Additional configurations for retention size
      retentionSize: 10GB
    enableUserWorkload: true                     -  Enabling user workload monitoring
    alertmanagerMain:
      enableUserAlertmanagerConfig: true         -  Enable deployed alert manager for user workloads
During the execution of the above ConfigMap, the Prometheus, Thanos ruler, and other pods will be deployed in the
openshift-user-workload-monitoringproject automatically.There will be no pods in the
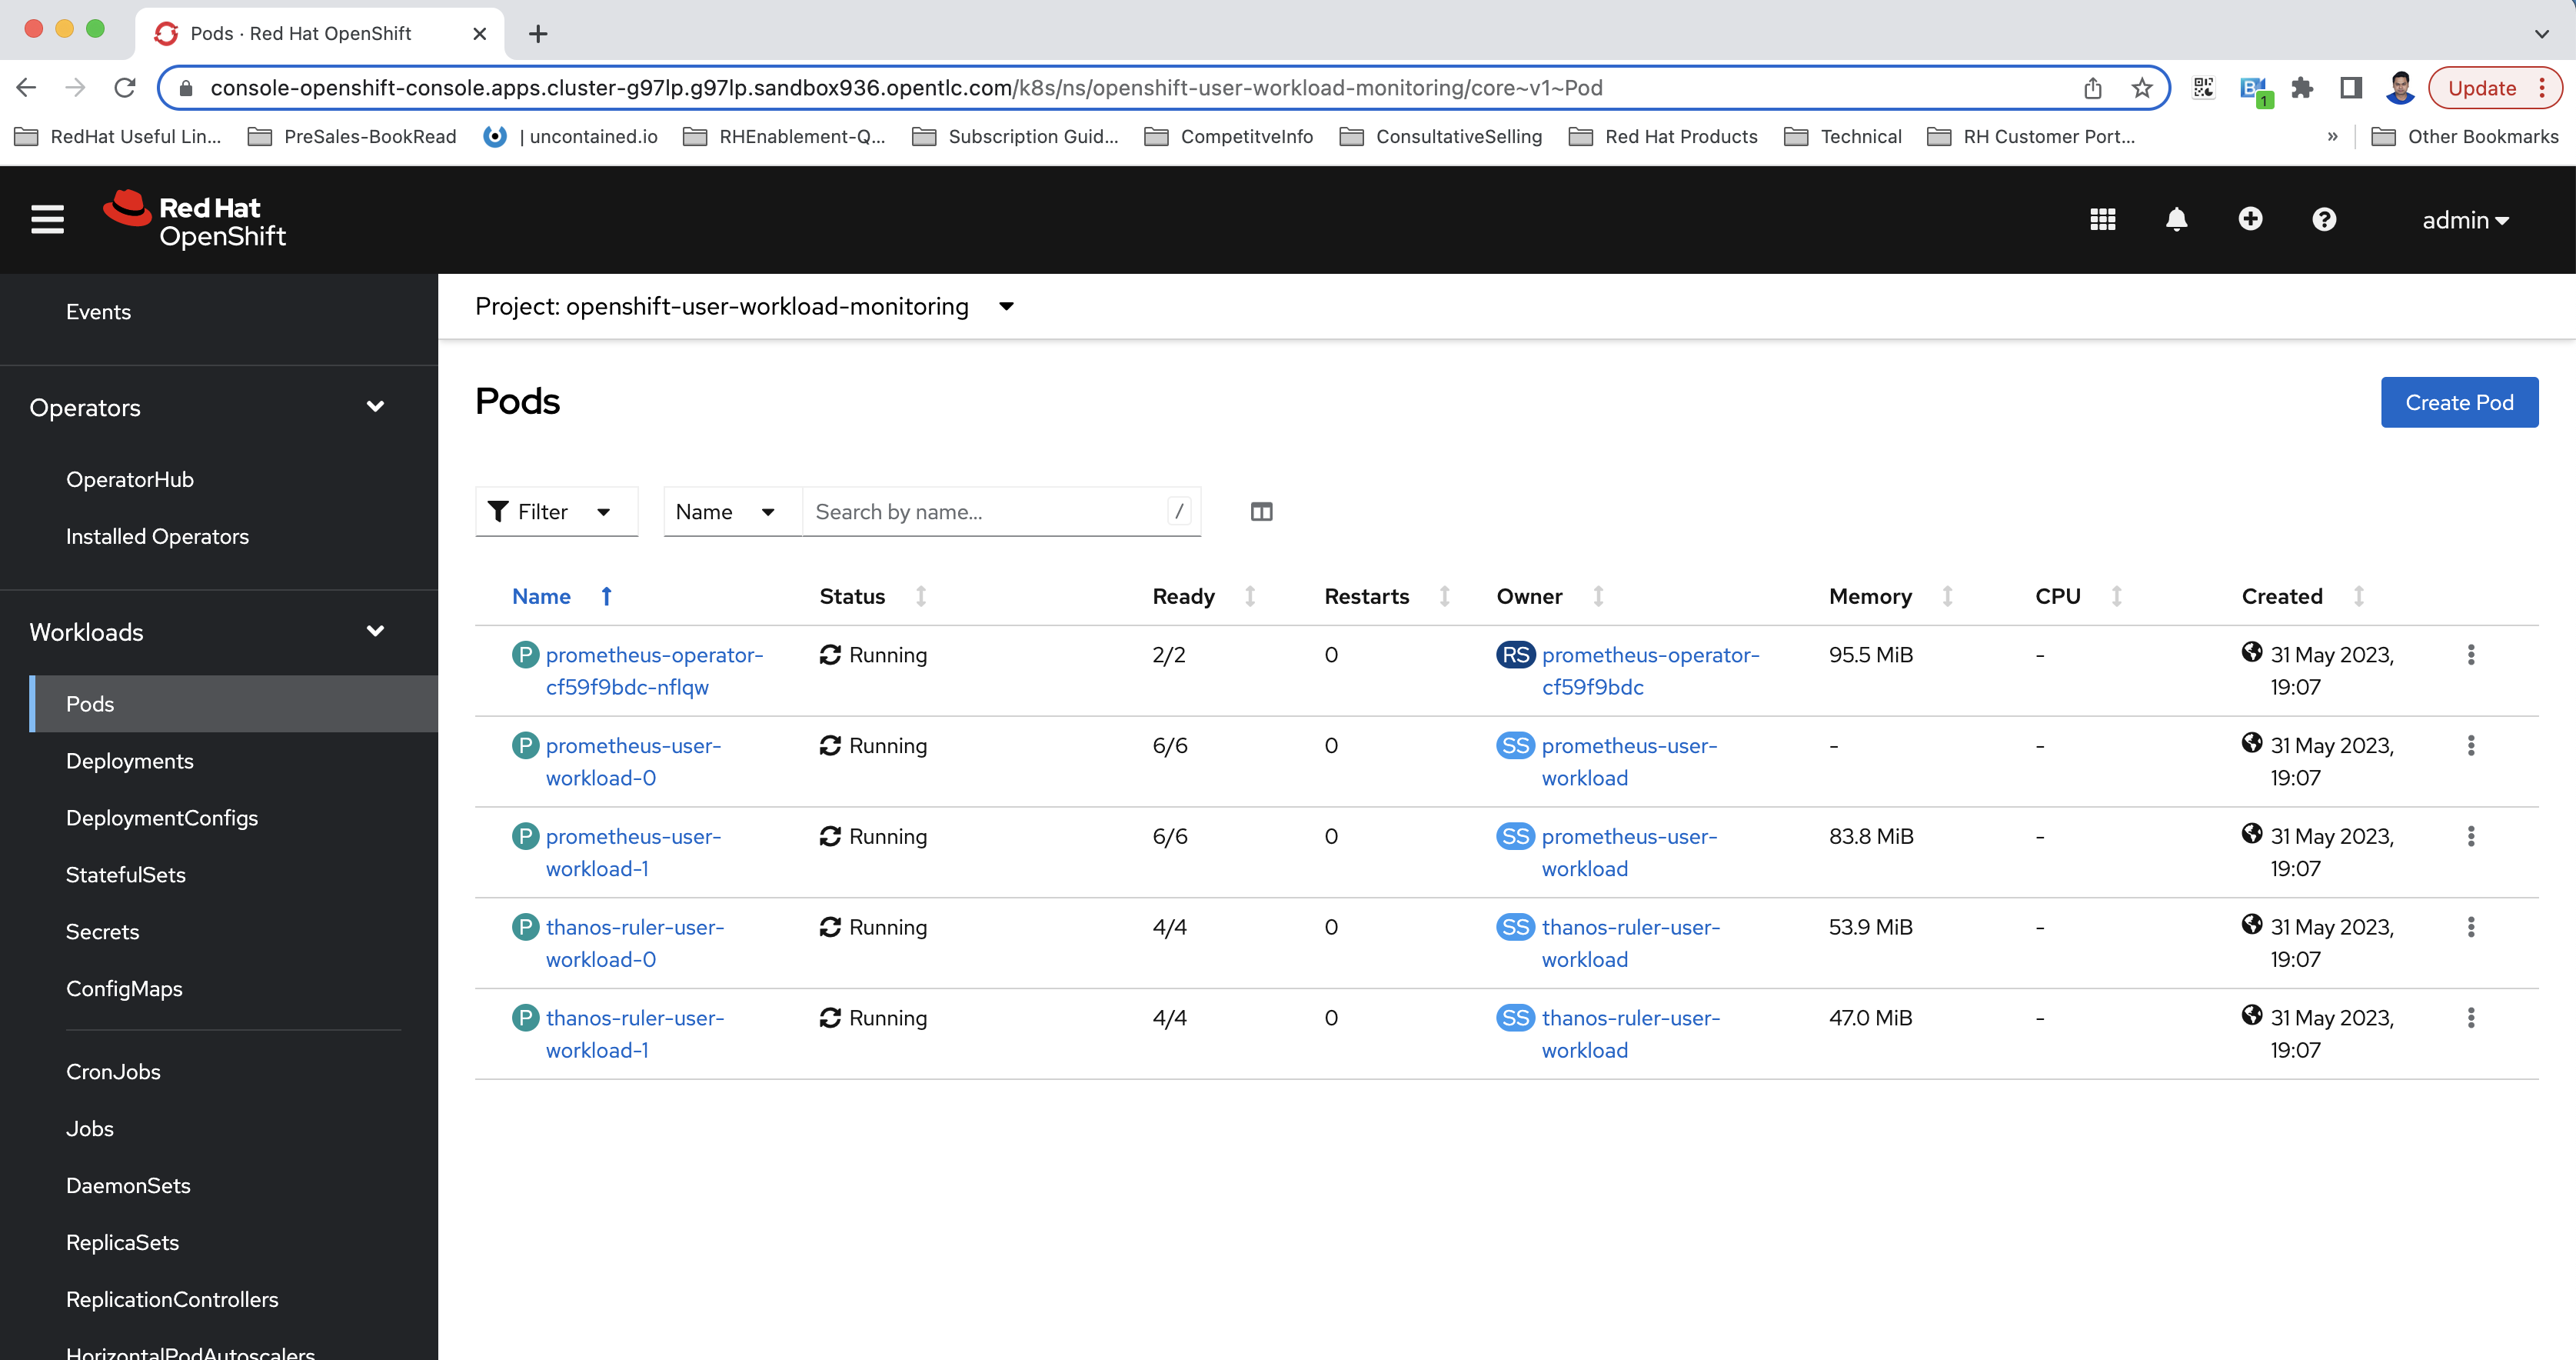
openshift-user-workload-monitoringproject. After enabling, the relevant pods will be created in the project, as shown in Figure 1.
Figure 1: An illustration of pods after enabling user workload monitoring in OpenShift. Configure the
openshift-monitoringproject components (optional).Note: This resource can either be created by cluster-admin or cluster administrator, assigning a
user-workload-monitoring-config-editrole in theopenshift-user-workload-monitoringproject to the user or group.apiVersion: v1 kind: ConfigMap metadata: name: user-workload-monitoring-config namespace: openshift-user-workload-monitoring data: config.yaml: | prometheus: retention: 48h resources: requests: cpu: 200m memory: 2Gi thanosRuler: retention: 2dDeploy your custom application in the user-defined project.
In the following example, we deploy an application in
monitoringdemoproject that exposes the metrics -http_request_totalat the/metricsendpoint over HTTP and creates a service for it.The application should expose the custom metrics at the metrics endpoint so that OpenShift Container Platform can scrape it. It is a standard practice.
Note: This resource can either be created by cluster-admin or cluster administrator, assigning admin or edit role to the user or group for this project.
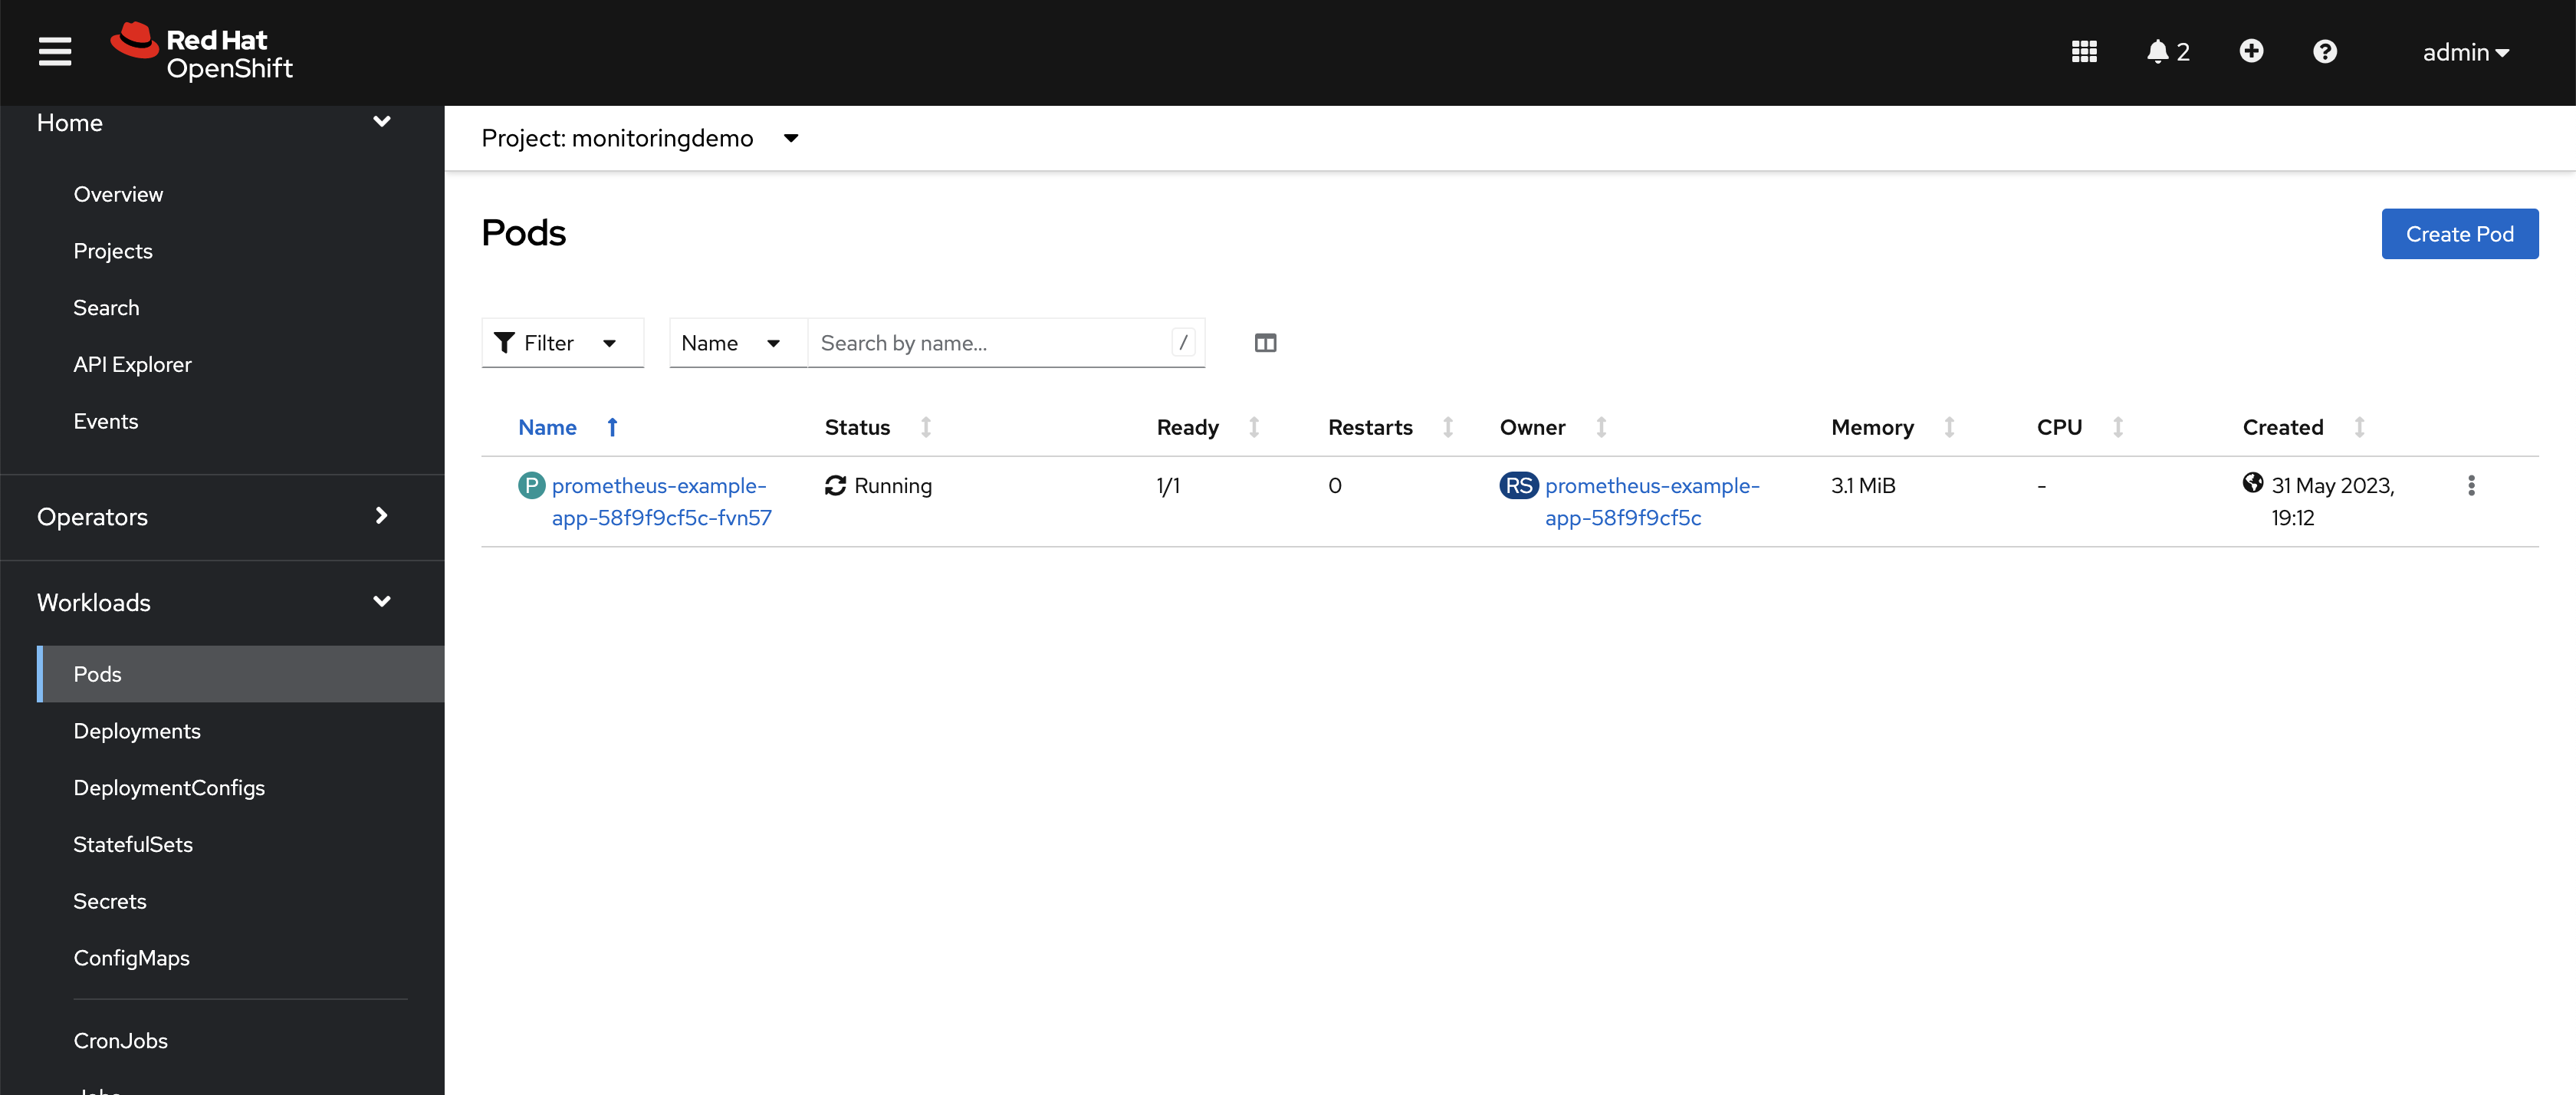
apiVersion: v1
kind: Namespace
metadata:
  name: monitoringdemo
---
apiVersion: apps/v1
kind: Deployment
metadata:
  labels:
    app: prometheus-example-app
  name: prometheus-example-app
  namespace: monitoringdemo
spec:
  replicas: 1
  selector:
    matchLabels:
      app: prometheus-example-app
  template:
    metadata:
      labels:
        app: prometheus-example-app
    spec:
      containers:
      - image: ghcr.io/rhobs/prometheus-example-app:0.4.2
        imagePullPolicy: IfNotPresent
        name: prometheus-example-app
---
apiVersion: v1
kind: Service
metadata:
  labels:
    app: prometheus-example-app
  name: prometheus-example-app
  namespace: monitoringdemo
spec:
  ports:
  - port: 8080
    protocol: TCP
    targetPort: 8080
    name: web
  selector:
    app: prometheus-example-app
  type: ClusterIP
After executing the above YAML, the example application is deployed in the
monitoringdemoproject, as shown in Figure 2.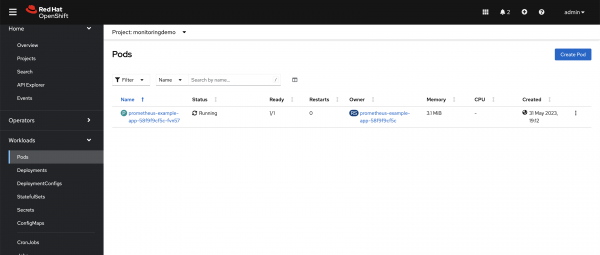
Figure 2: The deployed application running on the OpenShift Container Platform cluster. Deploy the ServiceMonitor.
We will deploy the ServiceMonitor in the
monitoringdemoproject. This resource will instruct OpenShift Container Platform to scrape the metrics for this custom application exposed at the metrics endpoint.Note: This resource can either be created by cluster-admin or cluster administrator and assigned
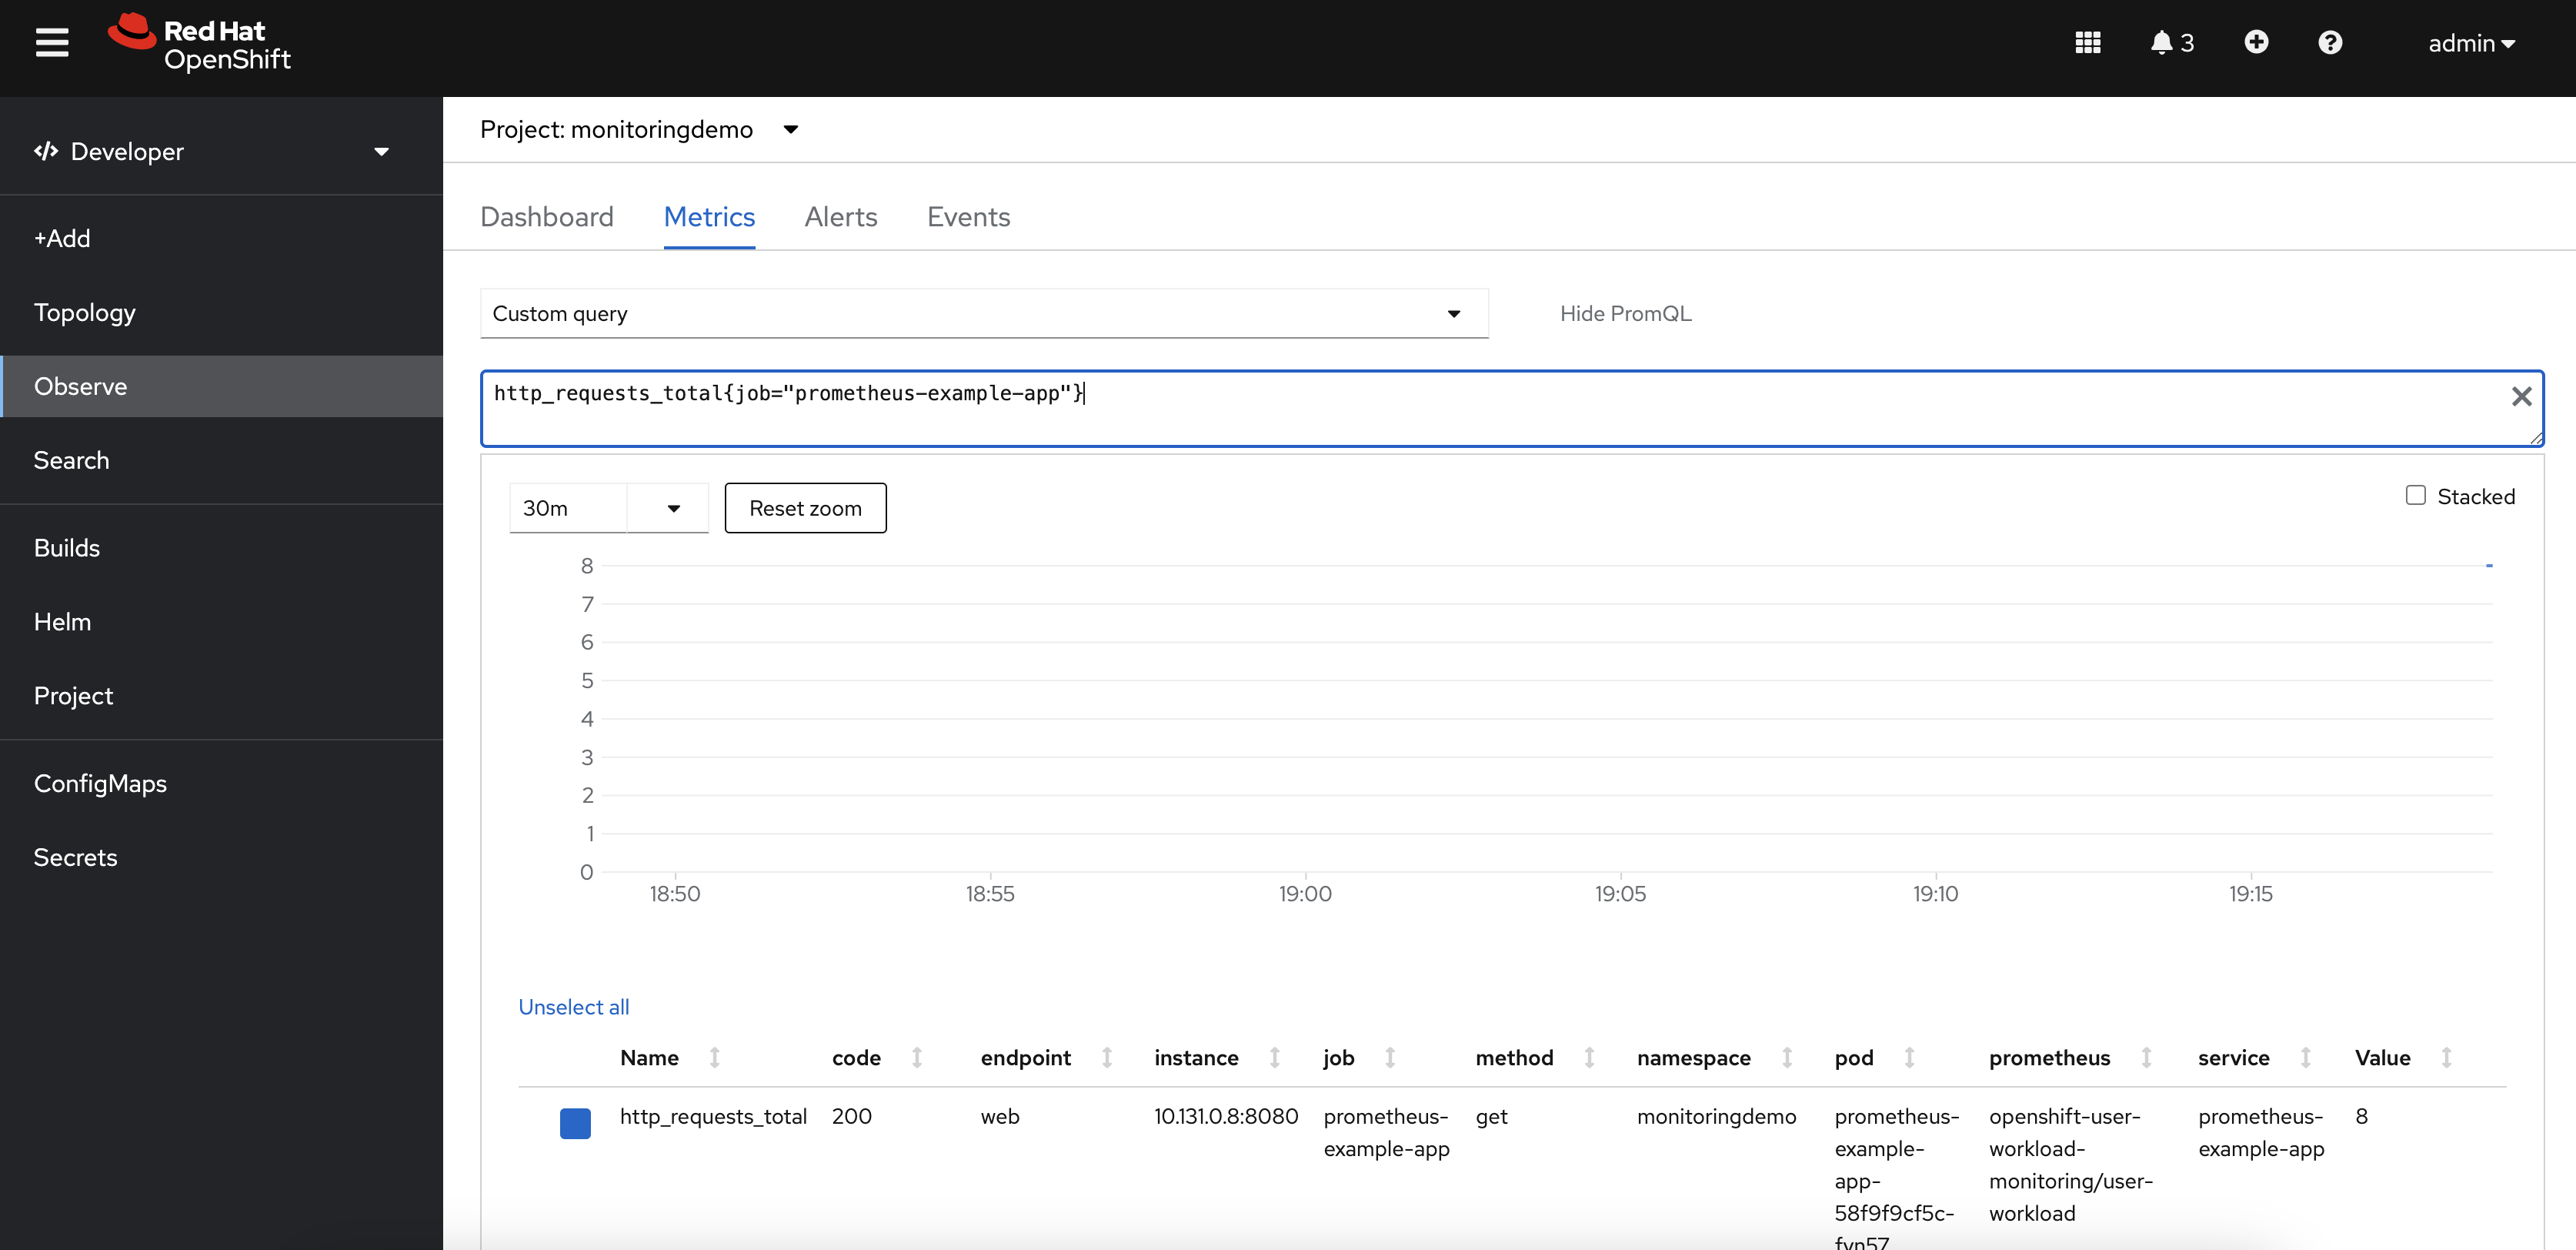
monitoring-editrole to the user or group responsible for themonitoringdemoproject.apiVersion: monitoring.coreos.com/v1 kind: ServiceMonitor metadata: labels: k8s-app: prometheus-example-monitor name: prometheus-example-monitor namespace: monitoringdemo spec: endpoints: - interval: 30s port: web scheme: http selector: matchLabels: app: prometheus-example-appAfter creating the service monitor, we can check the custom metric value by executing the query. This application exposes
http_requests_totalas the custom metric. The value is 8, as shown in Figure 3.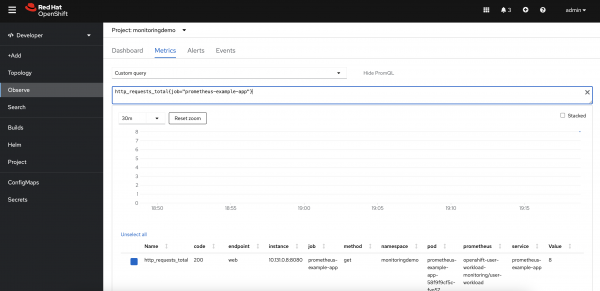
Figure 3: A view of the custom metric showing the http_requests_total metric value. Create a Prometheus rule and define the threshold for this custom metric.
In the next example, we have defined the threshold as 5 so that alerts can be generated with few requests. We can enrich this rule by adding annotations as custom messages so that, on receiving the alert, we can understand the context for the alert. This will be deployed in the
monitoringdemoproject.Note: This resource can either be created by cluster-admin or cluster administrator and assigned
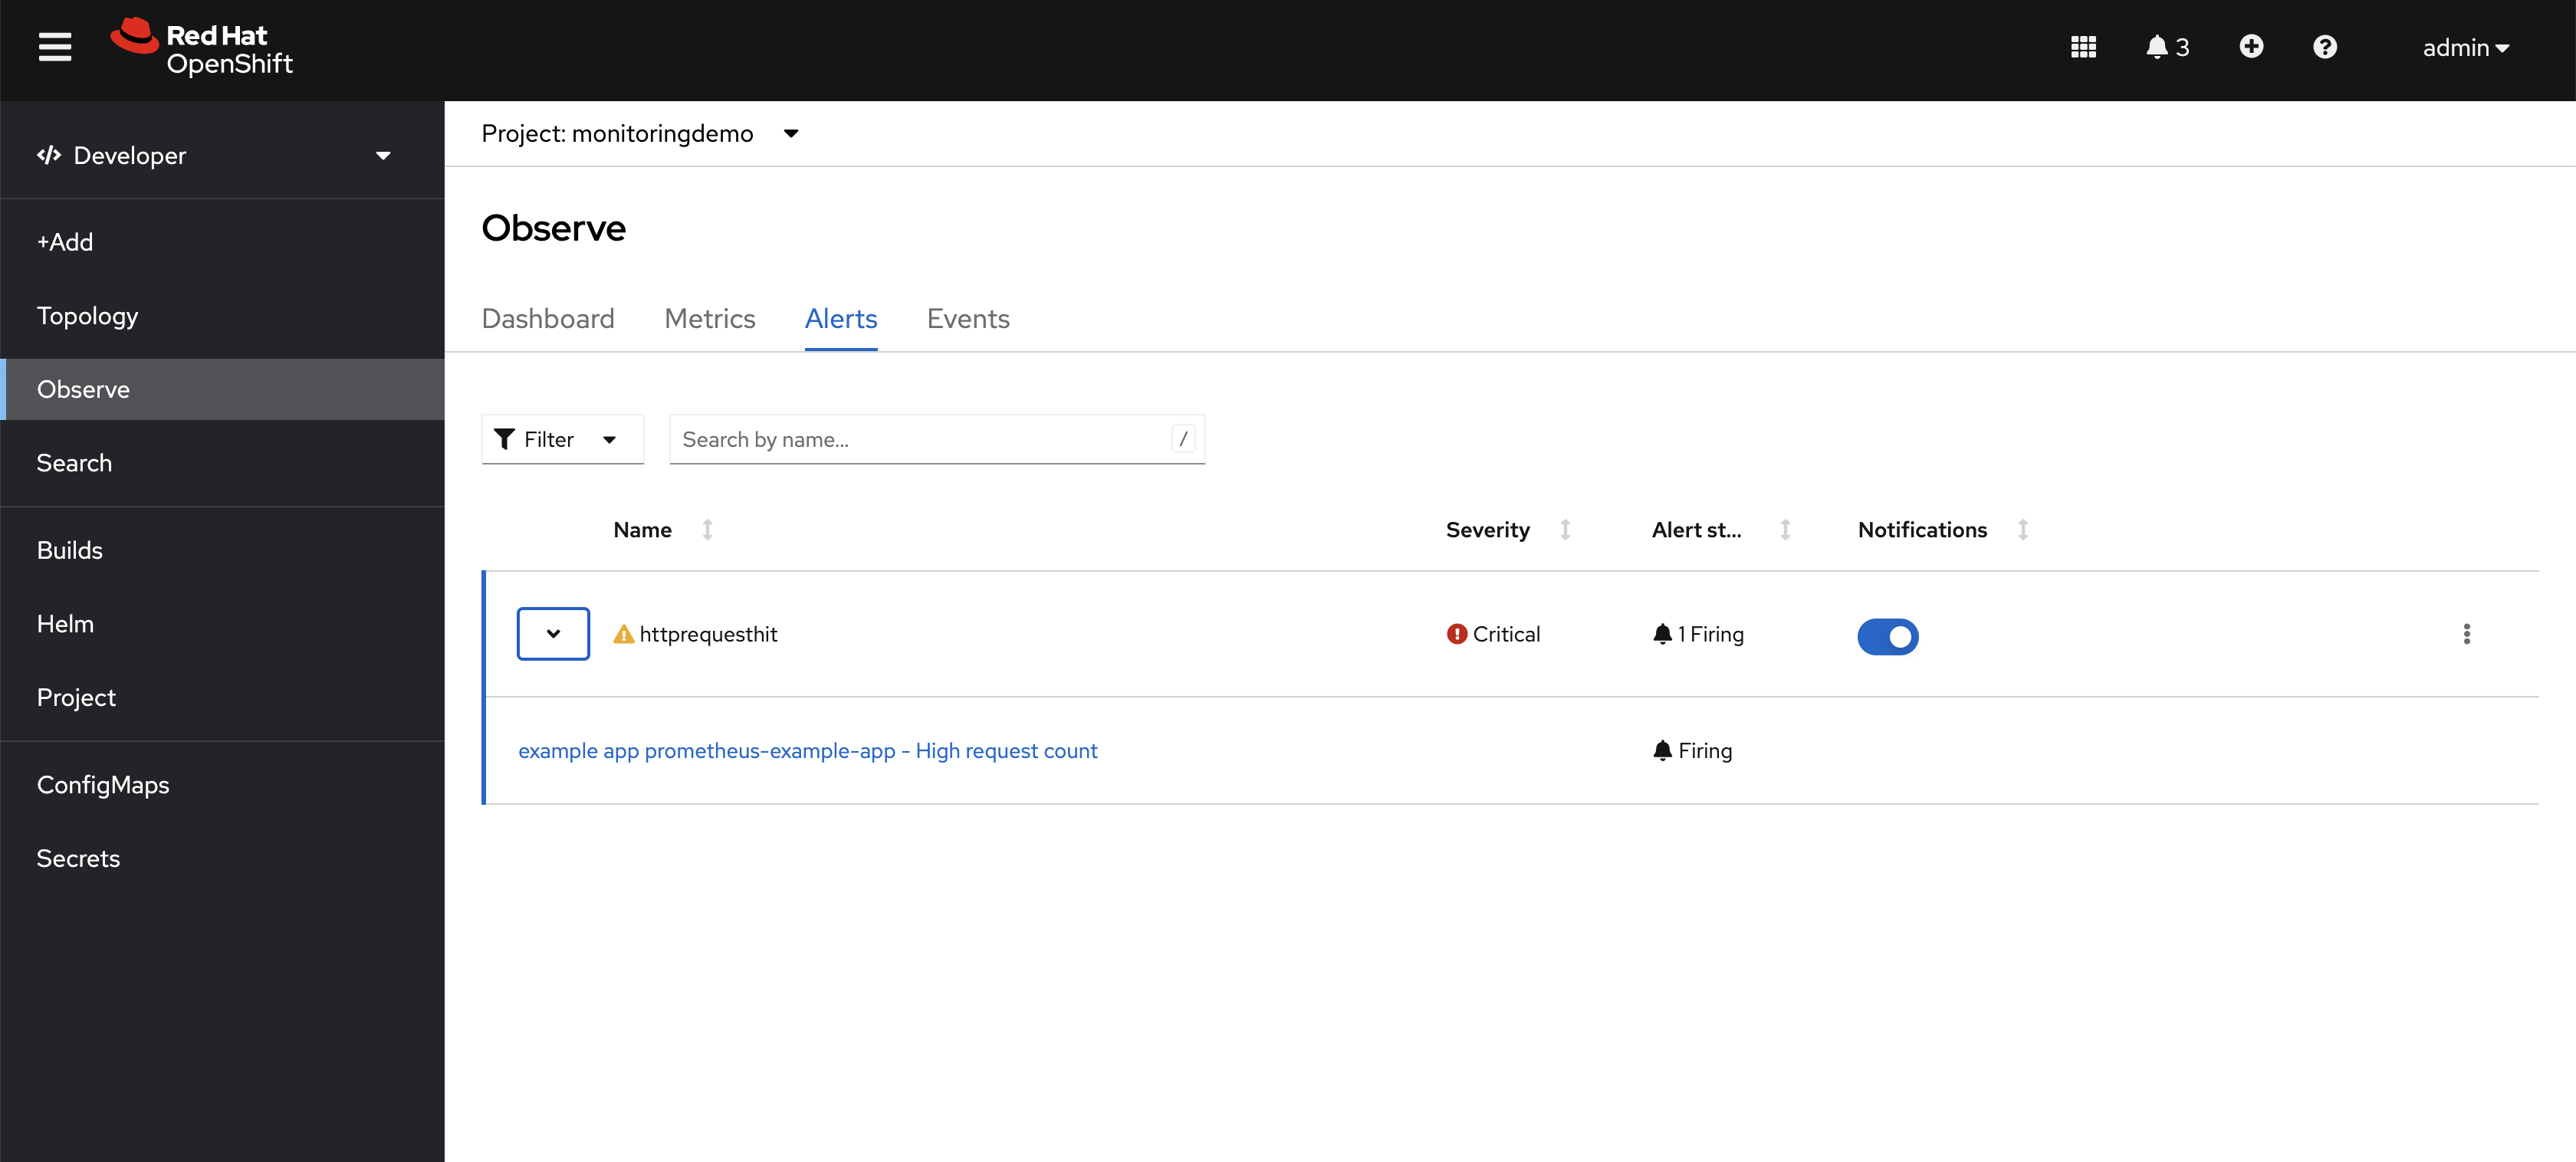
monitoring-editormonitoring-rules-editrole to the user or group responsible for themonitoringdemoproject.apiVersion: monitoring.coreos.com/v1 kind: PrometheusRule metadata: name: example-alert-http-requests-total namespace: monitoringdemo spec: groups: - name: example rules: - alert: httprequesthit expr: http_requests_total{job="prometheus-example-app"} > 5 - This is the threshold value labels: severity: critical - Define severity of this alert app: prometheus-example-app annotations: summary: Total request count is high description: example app {{ $labels.service }} - High request count message: Total message count is {{ $value }}As we have defined the Prometheus rule with a threshold value of 5 and the application current metric value as 8, which is greater than the threshold, an alert will be generated for this application and will be visible in the alerts section with the firing status shown in Figure 4.
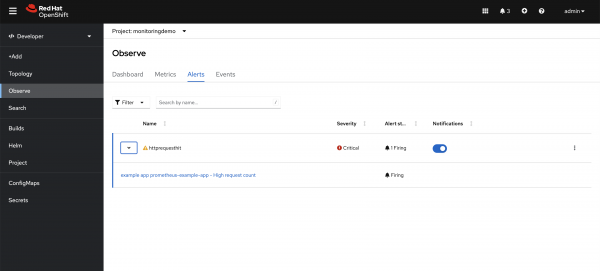
Figure 4: After creating the PrometheusRule, an alert displays in the OpenShift Container Platform web console. Create the Alertmanager configuration to define the external notification system for receiving the alerts created in OpenShift and visible in the OpenShift UI.
In the following example, the email notification system has been configured. We used the Gmail SMTP server to send notifications to certain email IDs.
Note: This resource can be created by cluster-admin or cluster administrator and assigned
alert-routing-editrole to the user or group responsible formonitoringdemoproject.apiVersion: monitoring.coreos.com/v1beta1 kind: AlertmanagerConfig metadata: name: alert-notifications namespace: monitoringdemo labels: alertmanagerConfig: main spec: route: receiver: mail groupby: [job] group_interval: 5m group_wait: 30s repeat_interval: 2h receivers: - name: mail emailConfigs: - to: xxxxxxxxx - This can be any email address or group email ID from: xxxxxxxx smarthost: smtp.gmail.com:587 - Gmail SMTP server details hello: smtp.gmail.com authUsername: xxxxxxxx - Gmail ID as the authentication username authPassword: name: mail-password key: password --- apiVersion: v1 kind: Secret metadata: name: mail-password namespace: monitoringdemo stringData: password: xxxxxxx - Need to create application password in gmailWe defined the mail as a receiver for alert notifications; an alert for the previous example application has been sent to the configured email ID, as shown in Figure 5.
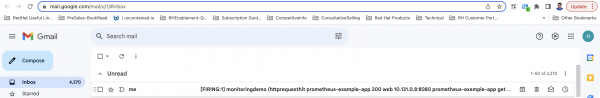
Figure 5: After enabling the AlertmanagerConfig resource, the email receives the alert from the OpenShift Container Platform web console. A detailed alert view with labels and annotation values will be displayed in the alert, as shown in Figure 6.
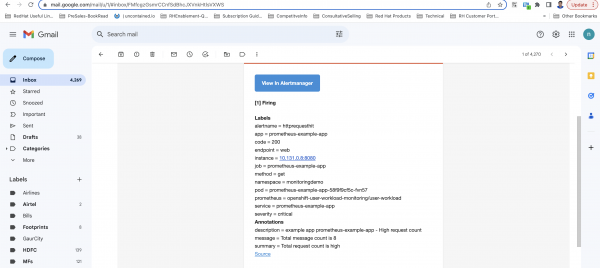
Figure 6: A detailed view of the alert received via email.


There are many other external notification systems and configurations that can be performed to further customize the monitoring stack. Please read the official OpenShift monitoring documentation for more details.
Find more resources
The OpenShift monitoring stack deployed with the default installation monitors the metrics for OpenShift cluster components. But most of the time, developers need to monitor the custom metrics for the applications and workloads they deployed in their projects. They expect to receive alert notifications by email for those custom metrics if they deviate from the threshold values.
We hope this article was helpful in providing configurations to set up monitoring and alerts for custom-deployed applications. The example YAML configurations are available at Resources YAML GitHub for reference. You can refer to Create app passwords for Gmail authentication for creating Gmail app passwords required for SMTP authentication.
Last updated: January 15, 2025