Have you ever enabled a HotSpot Java virtual machine (JVM) debugging option and had performance drastically improved? Totally unexpected and confusing. We had that very problem during a JVM warm-up investigation, and this article will detail the steps, options, and tools used to get to the bottom of the issue. Hopefully our journey will help you better understand how to debug unexpected warm-up behavior.
Problem and solution
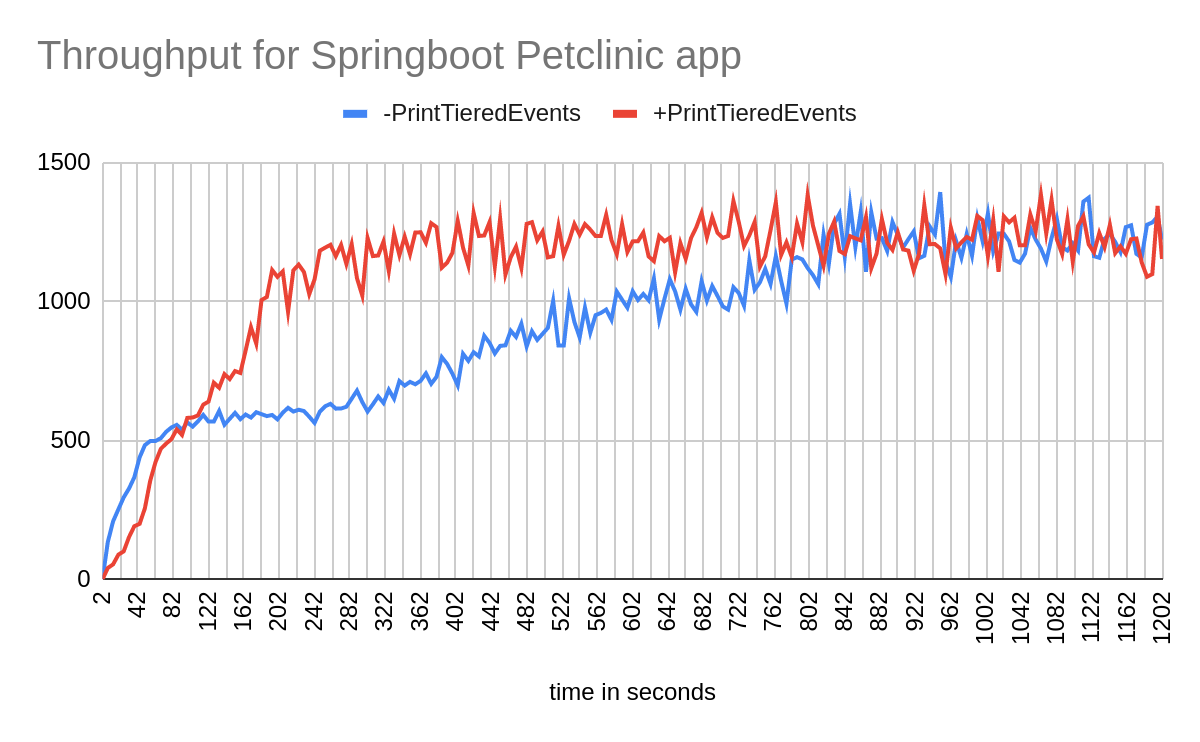
We observed a strange behavior affecting warm-up performance from HotSpot JVM while measuring throughput using Spring Boot's PetClinic application. During the measurement runs, the application warmed up much quicker when the PrintTieredEvents option is enabled (using -XX:+PrintTieredEvents) compared to the case when running with the default settings (i.e. without the PrintTieredEvents option or -XX:-PrintTieredEvents)
Note: "Warm-up time" refers to the time it takes to reach the peak throughput. An application's warm-up time depends a lot on the just-in-time (JIT) compilation of hot methods. HotSpot has two JIT compilers, C1 and C2, and, by default, employs tiered compilation where the compilation level ranges from 1 to 4. While the C1 compiler takes care of compilations done at levels 1 to 3, C2 is responsible for level 4 compilations. It is level 4 where all the heavy optimizations are performed and is therefore by far the most CPU-intensive compilation level.
PrintTieredEvents is an option that logs various tiered compilation events.
This was a very puzzling behavior because PrintTieredEvents is not expected to alter compilation behavior and, consequently, the performance characteristics of the application. To give an idea of the impact, the warm-up time with default settings (i.e., without PrintTieredEvents option or -XX:-PrintTieredEvents) was around 14 minutes, but when -XX:+PrintTieredEvents was added, the warm-up time decreased to around 4 minutes. The peak throughput in both cases was comparable, but the time to reach peak throughput is very different. (See Figure 1).
The root cause for this unexpected behavior turns out to be competition between compiler and application threads for CPU. With PrintTieredEvents disabled, the application threads run at full throttle. Large compilations get context switched more frequently to allow the application to run, so they take longer to complete. The result is a delay in delivery of the JITted code needed to boost throughput. With PrintTieredEvents enabled, the application threads suspend regularly on I/O waits. Large compilations switch less often or complete without switching, delivering JITted code and higher throughput earlier.
This highlights a configuration issue that HotSpot users need to be aware of. The request rate a server can support during warm-up needs to be capped at a lower value than the rate for peak running. This was confirmed when we started with fewer JMeter threads during the warm-up phase and then ramped up later; the compiler threads were no longer starved of the CPU.
This solution to the puzzle of delayed ramp-up makes sense and is relatively clear and understandable once you see it. However, when faced with the initial, counter-intuitive observed behavior, it was unclear what this resolution might be. It is no accident that we eventually solved the puzzle. HotSpot supports a host of built-in monitoring, tracing, and debugging tools and options that make it possible to gather evidence and analyze these sorts of anomalous behaviors. Although they are familiar to most HotSpot developers, they are less well known by end users, even though they are actually very useful.
The rest of this article explains how we used various available tools and options to arrive at the above resolution of this ramp-up puzzle.
Setup
This investigation was done on a 4-core system running Red Hat Enterprise Linux 8.6. The CPU model was Intel(R) i7-8665U. SMT (simultaneous multithreading) was disabled on the system. To prevent interference from other system processes, the PetClinic app was bound to 2 CPUs. You can achieve this using TuneD with "cpu-partitioning" profile and then using a taskset to pin the process to the desired CPUs. THP (transparent huge pages) and turbo boost were also disabled.
# disable SMP

sudo sh -c "/bin/echo off > /sys/devices/system/cpu/smt/control"


# disable THP

sudo sh -c "/bin/echo "never" > /sys/kernel/mm/transparent_hugepage/enabled"


# disable turbo boost

sudo sh -c "/bin/echo 1 > /sys/devices/system/cpu/intel_pstate/no_turbo"
To generate the load, we used Apache JMeter with 50 threads for a duration of 20 minutes.
Debugging
To determine the root cause of this behavior, we enabled the -XX:+PrintCompilation and -XX:+PrintCompilation2 options to get an idea of compilation progress in both -XX:-PrintTieredEvent and -XX:+PrintTieredEvents modes.
Note: -XX:+PrintCompilation logs a message for every compilation. The log includes the time, compilation level, and the method name. -XX:+PrintCompilation2 is a diagnostic option that logs a message when a compilation is completed. This message includes the time taken to compile the method.
An example of the output generated by -XX:+PrintCompilation and -XX:+PrintCompilation2 is:
     56    3       3       jdk.internal.util.Preconditions::checkIndex (18 bytes)

     56    3   size: 560(360) time: 0 inlined: 0 bytes

     56    4       3       java.lang.String::charAt (25 bytes)

     57    4   size: 1224(864) time: 0 inlined: 44 bytes

     58    5       3       java.util.zip.ZipUtils::SH (21 bytes)

     58    5   size: 488(272) time: 0 inlined: 0 bytes
After post-processing of the output, we realized that some of the C2 compilations are taking an exceptionally long time to complete when running with -XX:-PrintTieredEvents compared to -XX:+PrintTieredEvents. More importantly these results were consistent across multiple runs. Some examples from the log file of such compilations:
With -XX:-PrintTieredEvents:
  23692 10541       4       org.thymeleaf.engine.ElementTagStructureHandler::applyAttributes (247 bytes)

  27263 10541   size: 33400(23784) time: 3571 inlined: 3228 bytes


  27293 10281       4       org.thymeleaf.engine.ProcessorTemplateHandler::handleOpenElement (1189 bytes)

  36088 10281   size: 68408(42528) time: 8794 inlined: 7688 bytes


  62596 9872       4       org.thymeleaf.engine.ProcessorTemplateHandler::handleStandaloneElement (1266 bytes)

  68251 9872   size: 65560(39920) time: 5513 inlined: 8636 bytes
Compilation of same methods when running with -XX:+PrintTieredEvents:
 44083 13049       4       org.thymeleaf.engine.ElementTagStructureHandler::applyAttributes (247 bytes)

  44155 13049   size: 9632(6600) time: 71 inlined: 573 bytes


  27899 9771       4       org.thymeleaf.engine.ProcessorTemplateHandler::handleOpenElement (1189 bytes)

  28323 9771   size: 50120(36416) time: 423 inlined: 3899 bytes


  28526 9789       4       org.thymeleaf.engine.ProcessorTemplateHandler::handleStandaloneElement (1266 bytes)

  28855 9789   size: 57816(34400) time: 329 inlined: 9389 bytes
Here is a table created from the above logs for easier comparison of the compilation time of the methods with and without PrintTieredEvents option:
|
Method |
-XX:-PrintTieredEvents |
-XX:+PrintTieredEvents |
|
ElementTagStructureHandler::applyAttributes |
3571 ms |
71 ms |
|
ProcessorTemplateHandler::handleOpenElement |
8794 ms |
423 ms |
|
ProcessorTemplateHandler::handleStandaloneElement |
5513 ms |
329 ms |
So now we have a lead to follow. It seems like something is wrong with C2 compilation, at least for these methods.
We decided to focus on the org.thymeleaf.engine.ProcessorTemplateHandler::handleOpenElement() method and trace its compilation to look for oddities and anything that would explain the additional time.
Using LogCompilation and CompilerDirectives
To get compilation logs, HotSpot provides the -XX:+LogCompilation option. OpenJDK has a nice wiki page describing LogCompilation. This option produces an XML-based output of the compilations. By default, it generates logs for each compilation, which is almost too much data for any useful analysis. Instead, we limited the logs to only the handleOpenElement method under investigation using Compiler Directives.
See the JEP and the documentation, which describes how to use them. Compiler Directives provide fine-grained control over compilations performed by C1 and C2 compilers. They are specified in JSON format in a file which is passed to the JVM using -XX:CompilerDirectivesFile option.
To enable logging for the org.thymeleaf.engine.ProcessorTemplateHandler::handleOpenElement() method, we used the following directives:
[

  {

    match: "org/thymeleaf/engine/ProcessorTemplateHandler.handleOpenElement",

    c2: {

      Log: true,

    },

  },

  {

    match: "*.*",

    Log: false,

  },

]
The above snippet has two directives. The first directive matches the method org/thymeleaf/engine/ProcessorTemplateHandler.handleOpenElement and tells the compiler to generate the logs for C2 compilation(s).
The second directive matches any method (using regex *.*) and disables the generation of compilation logs.
The order of the directives is important here because the compiler applies the first directive whose pattern matches the method being compiled. So, if we reverse the order of directives, then no logs will be generated.
The actual command line options to use for generating the logs for the target method is:
-XX:+UnlockDiagnosticVMOptions -XX:+LogCompilation -XX:CompilerDirectivesFile=<file name>
Looking at the logs thus generated, we realized it was missing the information about each individual phase of the compilation performed by the C2 compiler. To get that data, we need to add -XX:+CITimeVerbose to the command line. So the command line expands to:
-XX:+UnlockDiagnosticVMOptions -XX:+LogCompilation -XX:CompilerDirectivesFile=<file name> -XX:+CITimeVerbose
The compilation logs now show the timestamp (elapsed time in milliseconds since the start of the application) for the start and end of each phase from which the time taken can be computed. For instance:
  <phase name="scheduler" nodes="13572" live="13572" stamp="31.857">

    <phase name="ctorChaitin" nodes="13697" live="13572" stamp="31.870">

      <phase_done stamp="31.870"/>

    </phase>

    <phase name="computeLive" nodes="13697" live="13572" stamp="31.871">

      <phase_done stamp="31.883"/>

    </phase>

    <phase_done stamp="31.889”/>
The same information can also be obtained using -XX:+PrintCompilation-XX:+CITimeVerbose, but in this case the output generated by -XX:+CITimeVerbose can be interleaved with the -XX:+PrintCompilation output and makes it difficult to read the data correctly.
The compilation process can be divided into a few main phases, each of which can have many sub-phases. Compilation time obtained for each phase is compared in the table below. As there are many sub-phases in C2 compilation, we have omitted their details to keep the table short.
|
Phase |
Time in msecs with -XX:-PrintTieredEvents |
Time in msecs with -XX:+PrintTieredEvents |
|
parse |
870 |
39 |
|
optimizer |
1877 |
131 |
|
matcher |
176 |
32 |
|
scheduler |
32 |
38 |
|
regalloc |
2522 |
190 |
|
output |
15 |
20 |
Other than scheduler and output phases, the time taken without PrintTieredEvents varies from 5–20 times the time taken with PrintTieredEvents.
One of the reasons for the difference in compilation time could be a result of different inlining decisions between the two runs. As JIT compilation is non-deterministic and depends on various counters, etc, that vary from run to run, Inlining decisions can also vary across runs depending on various factors. So, we switched our focus on getting the inlining sequence for this method.
Inlining
One approach to obtain the inlining sequence is to use -XX:+PrintInlining. But we can also extract the same information from compilation logs that we already have. There is a tool called LogCompilation available in OpenJDK. This tool can parse the compilation log and generate PrintCompilation type output. It also has various other options to derive useful information from the compilation log. One of the options is to print the inlining decisions which is the same as the data generated by -XX:+PrintInlining.
List of options supported by LogCompilation:
Usage: LogCompilation [ -v ] [ -c ] [ -s ] [ -e ] file1 ...

By default, the tool will print the logged compilations ordered by start time.

  -c:   clean up malformed 1.5 xml

  -i:   print inlining decisions

  -S:   print compilation statistics

  -U:   print uncommon trap statistics

  -t:   print with time stamps

  -s:   sort events by start time (default)

  -e:   sort events by elapsed time

  -n:   sort events by name and start

  -z:   sort events by compiled code size

  -C:   compare logs (give files to compare on command line)

  -d:   do not print compilation IDs
Comparing the inlining decisions generated by LogCompilation for ProcessorTemplateHandler.handleOpenElement we did see differences in the inlining sequence. Some call trees were inlined when running with -XX:+PrintTieredEvents but were absent in the logs for -XX:-PrintTieredEvents, and vice-versa.
But these inlining decisions also differed across different runs. So, it was not very clear if these differences were responsible for the compilation time deltas.
HotSpot has a mechanism called replay compilation that allows a compilation process to be recorded and replayed later in another JVM process. At this point in our investigation, we decided to try replay compilation so that if the same behavior is reproduced, it will give us some confidence that the compilation process is misbehaving somewhere. And if it doesn't reproduce, we can, with some certainty, rule out the compilation process from the picture.
Either way it would help us to make further progress.
Replay compilation
How does replay compilation work? During a normal run, the JVM outputs all the dependencies and profiling data used by the compiler during compilation of a method to a replay file. Using this replay file, the JVM can replay the compilation of that particular method. The key assumption is that if all the dependencies are met, then the recorded profiling data would cause the compiler to exhibit the same behavior during replay compilation as in the initial run.
This technique is really helpful in debugging crashes during compilation. But be aware that it is not always successful in recreating the issue, as mentioned in Tobias Hartmann's talk Debugging the Java HotSpot VM.
The first step in replay compilation is to create the replay file. The compiler directives we used earlier also support a DumpReplay option to dump the replay file (See the documentation for the list of supported options). So we updated our directives file as follows:
[

  {

    match: "org/thymeleaf/engine/ProcessorTemplateHandler.handleOpenElement",

    c2: {

      Log: true,

      DumpReplay: true,

    },

  },

  {

    match: "*.*",

    Log: false,

  },

]
This would generate a replay file that captures all the information that the compiler needs to replay the compilation later. To use the replay file, we need to specify two options:
-XX:+ReplayCompiles -XX:ReplayDataFile=<replay file>
In addition to that, all the classes that the compiler needs to compile the method must be specified on the classpath. How do you know all the classes needed for compilation? You don't. And actually, you don't need to know the exact set of classes. It's sufficient to specify all the jar files used by the app on the classpath, which should certainly be the super set of the classes needed by the compiler.
We generated a replay file for the ProcessorTemplateHandler.handleOpenElement method without PrintTieredEvents (the slow run) and then used it with PrintTieredEvents enabled. The amount of time consumed for compilation was in the same order as the time taken when running with PrintTieredEvents. So, this kind of confirmed for us that the problem is not really with the compilation of the method. Something else is off here.
Perf
Another tool commonly used to detect where an application is spending time is the Linux perf tool. You can find many resources on using perf for performance investigations. One such resource is Brendan Gregg's blog.
We decided to try out perf-stat on the C2 compiler thread. But you need the thread ID of the C2 compiler thread to do that. This can be obtained easily using jcmd's Thread.print command and grepping for "C2 CompilerThread".
For example:
$ jcmd <PID> Thread.print | grep "C2 CompilerThread"

"C2 CompilerThread0" #13 [1114912] daemon prio=9 os_prio=0 cpu=5134.24ms elapsed=62.64s tid=0x00007fa0bc134200 nid=1114912 waiting on condition  [0x0000000000000000]
Here, the native thread ID is 1114912. We can now run perf-stat on this thread after the application has started:
$ perf stat -t 1114912 -i record -o perf.data
When the application terminates, the perf-stat data can be shown using following command:
$ perf stat report -i perf.data
To continue with our investigation, we realized ProcessorTemplateHandler.handleOpenElement gets compiled quite early in our run; within 15 seconds of the load. So we decided to cut down the load time to 15 seconds and recorded perf-stat for the C2 compiler thread.
With PrintTieredEvents disabled, perf-stat showed following output:
          2,741.32 msec task-clock:u              #    0.132 CPUs utilized

                 0      context-switches:u        #    0.000 /sec

                 0      cpu-migrations:u          #    0.000 /sec

             3,046      page-faults:u             #    1.111 K/sec

     5,029,272,291      cycles:u                  #    1.835 GHz

     6,754,992,986      instructions:u            #    1.34  insn per cycle

     1,414,343,830      branches:u                #  515.935 M/sec

        43,941,056      branch-misses:u           #    3.11% of all branches


      20.771120850 seconds time elapsed
With PrintTieredEvents enabled, the perf-stat data was:
          4,830.36 msec task-clock:u              #    0.238 CPUs utilized

                 0      context-switches:u        #    0.000 /sec

                 0      cpu-migrations:u          #    0.000 /sec

               531      page-faults:u             #  109.930 /sec

     8,764,471,042      cycles:u                  #    1.814 GHz

    11,598,331,303      instructions:u            #    1.32  insn per cycle

     2,436,266,591      branches:u                #  504.365 M/sec

        78,176,556      branch-misses:u           #    3.21% of all branches


      20.261335595 seconds time elapsed
The two profiles gathered are very different in every relevant event. The main takeaway is that when running PrintTieredEvents disabled, the C2 compiler thread gets only half of as much CPU time as with PrintTieredEvents enabled—i.e., 2.7 seconds versus 4.8 seconds of CPU time. This clearly indicates that enabling PrintTieredEvents results in the C2 compiler thread getting more CPU cycles.
Recall that PrintTieredEvents causes frequent I/O to log compilation events. These I/O operations allow the OS scheduler to give the C2 compiler thread more cycles. This is also reflected in the number of context switches reported by perf if we use the event context-switches:k to measure the context switches.
With -XX:-PrintTieredEvents:
C2 CompilerThre-3119318 609 context-switches:k
With -XX:+PrintTieredEvents:
C2 CompilerThre-3121836 4,307 context-switches:k
Another mystery is if the perf shows C2 compiler thread ran for only 2.7 seconds, why do the logs generated by -XX:+PrintCompilation2 indicate that the compilation of ProcessorTemplateHandler::handleOpenElement took almost 8 seconds. How is that possible?
Looking at the source code, we realized the values reported by -XX:+PrintCompilation2 are the system-wide elapsed time, not the actual compilation time taken by the compiler thread. Even the timestamps generated for each phase of compilation in LogCompilation are also the elapsed time. The elapsed time is obtained using clockid CLOCK_MONOTONIC on Linux. To track the actual compilation time, we updated the HotSpot code to use clock id CLOCK_THREAD_CPUTIME_ID to show the thread-specific CPU time for each phase. And as expected, the compilation time was almost the same with the PrintTieredEvents option disabled or enabled.
We have created an issue with OpenJDK to enhance the compilation logs by logging the actual compilation time of each phase.
Conclusion
With the help of various tools and options provided by HotSpot, we were able to rule out any issue in the compilation process. Furthermore, the perf report clearly highlighted the role of CPU contention between application threads and the C2 compiler thread, leading to the slow warm-up observed when PrintTieredEvents option was disabled.
Summary
This article shared various tools and techniques that HotSpot provides to allow the user to gain useful insights into the compilation strategy, thus getting a better understanding of the JIT compilation process. It also introduced the reader to some advanced debugging techniques like replay compilation.
We hope these techniques will be useful to you in your debugging journey with HotSpot JVM.
Acknowledgements
I would like to acknowledge Roland Westrelin (Red Hat) for helping in this investigation, and Andrew Dinn (Red Hat), Dan Heidinga (Red Hat), and Francesco Nigro (Red Hat) for reviewing the content and suggesting numerous changes to improve the content of the article.
