I work at Red Hat on GCC, the GNU Compiler Collection. For the last four releases of GCC, I've been working on -fanalyzer, a static analysis pass that tries to identify various problems at compile-time, rather than at runtime. It performs "symbolic execution" of C source code—effectively simulating the behavior of the code along the various possible paths of execution through it (with some caveats that we'll discuss).
This article summarizes what's new with -fanalyzer in GCC 13, which has just been released.
[ Learn more: New C features in GCC 13 ]
New warnings
I first added the analyzer to GCC in GCC 10, with 15 new warnings for the compiler, and we've added more in each subsequent release (Table 1).
| Release | New warnings | Cumulative warnings |
|---|---|---|
| GCC 10 | 15 | 15 |
| GCC 11 | 7 | 22 |
| GCC 12 | 5 | 27 |
| GCC 13 | 20 | 47 |
As you can see in Table 1, GCC 13 is a big release for -fanalyzer, adding 20 new warnings. Let's take a look at some of them.
Track dynamic buffer size
Can you spot the bug in the following C code?
#include <stdlib.h>
#include <string.h>

struct str {
  size_t len;
  char data[];
};

struct str *
make_str_badly (const char *src)
{
  size_t len = strlen(src);
  struct str *str = malloc(sizeof(str) + len);
  if (!str)
    return NULL;
  str->len = len;
  memcpy(str->data, src, len);
  str->data[len] = '\0';
  return str;
}
The above example makes the common mistake with C-style strings of forgetting the null terminator when computing how much space to allocate for str.
GCC 13's -fanalyzer option now keeps track of the sizes of dynamically allocated buffers, and for many cases it checks the simulated memory reads and writes against the sizes of the relevant buffers. With this new work it detects the above problem by emitting this new warning:
<source>: In function 'make_str_badly':
<source>:18:18: warning: heap-based buffer overflow [CWE-122] [-Wanalyzer-out-of-bounds]
   18 |   str->data[len] = '\0';
      |   ~~~~~~~~~~~~~~~^~~~~~
  'make_str_badly': events 1-4
    |
    |   13 |   struct str *str = malloc(sizeof(str) + len);
    |      |                     ^~~~~~~~~~~~~~~~~~~~~~~~~
    |      |                     |
    |      |                     (1) capacity: 'len + 8' bytes
    |   14 |   if (!str)
    |      |      ~
    |      |      |
    |      |      (2) following 'false' branch (when 'str' is non-NULL)...
    |   15 |     return NULL;
    |   16 |   str->len = len;
    |      |   ~~~~~~~~~~~~~~
    |      |            |
    |      |            (3) ...to here
    |   17 |   memcpy(str->data, src, len);
    |   18 |   str->data[len] = '\0';
    |      |   ~~~~~~~~~~~~~~~~~~~~~
    |      |                  |
    |      |                  (4) write of 1 byte at offset 'len + 8' exceeds the buffer
    |
I want to thank Tim Lange who implemented this warning as part of Google's Summer of Code program last year (along with two other new warnings: -Wanalyzer-allocation-size and -Wanalyzer-imprecise-fp-arithmetic).
Check if NULL is dereferenced
Here's an example of another new warning—what's wrong with the following C code?
#include <assert.h>
#include <stdio.h>

extern FILE *logfile;

struct obj
{
  const char *name;
  int x;
  int y;
};

int is_within_boundary (struct obj *p, int radius_squared)
{
  fprintf (logfile, "%s: (%i, %i)\n", p->name, p->x, p->y);
  if (!p)
    return 0;
  return (p->x * p->x) + (p->y * p->y) < radius_squared;
}
The issue is that the code is unclear about whether p can be NULL: it's dereferenced unconditionally at the fprintf call, but then checked for NULL later on. A pointer that's unconditionally dereferenced can be assumed by a compiler to be non-NULL, and thus the check against NULL can potentially be optimized away, which is probably not want you want—but the compiler has no way to know what you meant.
As of GCC 13, the -fanalyzer option now detects the above by emitting this warning:
<source>: In function 'is_within_boundary':
<source>:16:6: warning: check of 'p' for NULL after already dereferencing it [-Wanalyzer-deref-before-check]
   16 |   if (!p)
      |      ^
  'is_within_boundary': events 1-2
    |
    |   15 |   fprintf (logfile, "%s: (%i, %i)\n", p->name, p->x, p->y);
    |      |   ^~~~~~~~~~~~~~~~~~~~~~~~~~~~~~~~~~~~~~~~~~~~~~~~~~~~~~~~
    |      |   |
    |      |   (1) pointer 'p' is dereferenced here
    |   16 |   if (!p)
    |      |      ~
    |      |      |
    |      |      (2) pointer 'p' is checked for NULL here but it was already dereferenced at (1)
    |
Other new warnings
I don't have space in this article to give examples of every new warning added in GCC 13, but here's a round-up of the others.
I added support to -fanalyzer for tracking the state of <stdarg.h>:
-Wanalyzer-va-list-leakfor complaining about missingva_endafter ava_startorva_copy-Wanalyzer-va-list-use-after-va-endfor complaining aboutva_argorva_copyused on ava_listthat's hadva_endcalled on it-Wanalyzer-va-arg-type-mismatchfor type-checking ofva_argusage in interprocedural execution paths against the types of the parameters that were actually passed to the variadic call-Wanalyzer-va-list-exhaustedfor complaining in interprocedural execution paths ifva_argis used too many times on ava_list
Immad Mir implemented tracking of file descriptors within the analyzer as part of Google Summer of Code 2022. We added seven new warnings relating to this in GCC 13:
-Wanalyzer-fd-access-mode-mismatch-Wanalyzer-fd-double-close-Wanalyzer-fd-leak-Wanalyzer-fd-phase-mismatch(e.g. callingaccepton a socket before callinglistenon it)-Wanalyzer-fd-type-mismatch(e.g. using a stream socket operation on a datagram socket)-Wanalyzer-fd-use-after-close-Wanalyzer-fd-use-without-check
along with attributes for marking int function arguments as being file descriptors.
Finally, I implemented various other warnings:
-Wanalyzer-exposure-through-uninit-copy(for detecting "infoleaks" in the Linux kernel)-Wanalyzer-infinite-recursion-Wanalyzer-jump-through-null-Wanalyzer-putenv-of-auto-var-Wanalyzer-tainted-assertion
SARIF output
In GCC 9 I added an option -fdiagnostics-format=json to provide machine-readable output for GCC's diagnostics. This is a custom JSON-based format that closely follows GCC's own internal representation.
In the meantime, another JSON-based format has emerged as the standard in this space: SARIF (the Static Analysis Results Interchange Format). This file format is suited for capturing the results of static analysis tools (like GCC's -fanalyzer), but it can also be used for plain GCC warnings and errors.
So for GCC 13 I've extended -fdiagnostics-format= to add two new options implementing SARIF support: -fdiagnostics-format=sarif-stderr and -fdiagnostics-format=sarif-file. I've also joined the technical committee overseeing the standard.
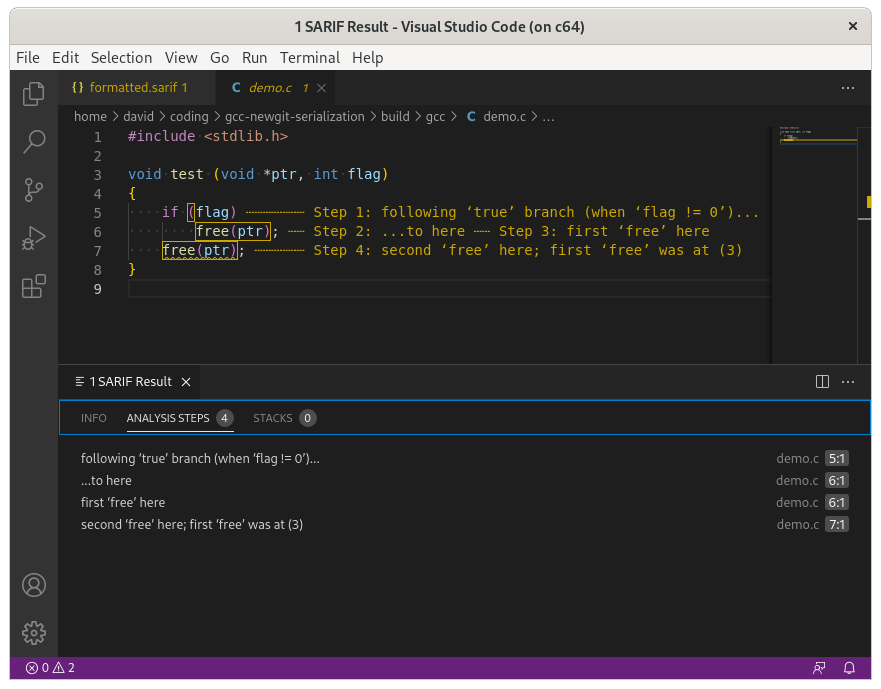
By producing data in an industry standard format we benefit from interoperability with existing consumers of SARIF data. Figure 1 is a simple example, showing VS Code (with a SARIF plugin) viewing a SARIF file generated by GCC. The IDE is able to annotate the source code, adding squiggly lines under code where GCC finds problems. Here I've clicked on a line where -fanalyzer reported a double-free bug, and the IDE is showing the path of execution through the code that GCC predicted will trigger the problem.
Fixing false positives
Static analyzers are not perfect—it's impossible to reason perfectly about the most interesting properties of source code. The GCC analyzer performs a crude simulation of the state of the inside of the program, and I've made many tradeoffs to try to make it fast enough to use when working on code. I receive anecdotal reports that people are using it and it's finding bugs for them earlier than they would have found them otherwise, but there will be false positives and false negatives. The analyzer is a bug-finding tool, rather than a tool for proving program correctness (and, alas, sometimes bugs lead to it being too slow). In technical terms, it's neither "sound" nor "complete."
I've spent the first few months of this year trying to reduce "spam" from the analyzer for GCC 13. I created an integration testing suite: I picked various real-world C projects, including Doom, the Linux kernel, and qemu. I've been building them with their standard options, but with -fanalyzer added to the build flags, examining the warnings emitted, and trying to fix the false positives.
I made a lot of fixes to the analyzer; Table 2 shows some before and after numbers for the warnings that were most improved by this work, where FP means a "false positive" (a bogus warning about a non-problem) and TP means a "true positive" (a valid warning about a real problem in the source code).
| Warning |
FP before |
FP after |
TP before |
TP after |
|---|---|---|---|---|
-Wanalyzer-deref-before-check |
63 | 12 | 1 | 1 |
-Wanalyzer-malloc-leak |
78 | 50 | 0 | 61 |
-Wanalyzer-use-of-uninitialized-value |
998 | 125 | 0 | 0 |
You can see that I eliminated most (but not all) of the false positives from -Wanalyzer-deref-before-check , and that I reduced the number of FPs from -Wanalyzer-malloc-leak whilst fixing it so that it correctly detected a bunch of real memory leaks that it had previously missed (in Doom's initialization logic, as it happens). Unfortunately, -Wanalyzer-use-of-uninitialized-value is still the "spammiest" warning, despite me making a big dent in its number of FPs; it seems to be most prone to exploring paths through the code that can't happen in practice, where the analyzer doesn't have enough high-level information about invariants in the code to figure that out.
Trying it out
GCC 13 has been released upstream, and is the system compiler in the recently-released Fedora 38.
For simple C examples, you can play around with the new GCC online at the Compiler Explorer site. Select GCC 13.1 and add -fanalyzer to the compiler options to run static analysis.
As noted above, the analyzer isn't perfect, but I hope it's helpful. Given that every compiler and analyzer finds a slightly different subset of bugs it's usually a good idea to run your code through more than one toolchain to see what shakes out.
Finally, if you're interested in getting involved in compiler development, I've written a guide to getting started as a GCC contributor. It includes lots of ideas for new warnings and features in GCC's Bugzilla.
Have fun!
Last updated: December 5, 2023