This is the second article in a two-part series about displaying information from the GNU Debugger (GDB) in a custom window while you are debugging a C or C++ program. The first article introduced GDB's Text User Interface (TUI) and showed how to create a window using the Python API. This second part finishes the example program by displaying values from GDB's history list.
Loading history values
To get started, add an extra line in the __init__ method you created in the previous article:
self._next_history_index = 1
The _next_history_index variable will be used to fetch values from GDB's history list. The value starts at 1 because the first value in GDB's value history is numbered 1. At each iteration of a loop you'll write, the _next_history_index variable will represent the next index you need to fetch from GDB's value history.
Next, add two new methods to the history_window class, which will do the job of fetching values from the history list:
    def _add_next_history_value(self):
        try:
            value = gdb.history(self._next_history_index)
            string = value.format_string(pretty_arrays=False,
            pretty_structs=False)
            string = "$%d = %s" % (self._next_history_index,
            re.sub(r"\\s*\n\\s*", " ", string))
            self._lines.append(string)
            self._next_history_index += 1
        except:
            return False
        return True

    def _update(self):
        while self._add_next_history_value():
            pass
The _add_next_history_value method tries to fetch the next item from GDB's value history. If this is successful, the value is converted to a single-line string and added to the _lines list. Finally, the method increments the _next_history_index.
To keep this tutorial simple, the method converts each value to be represented to a single line. This conversion uses the re.sub call, which replaces any newline characters with a single space using a regular expression. To enable the use of a regular expression, you need to add the following line to the top of the history.py file:
import re
The _update method just calls _add_next_history_value until all history values have been processed.
Finally, you need to call _update in two places.
First, call _update from the __init__ method to ensure that, as soon as your window is created, all existing history values are loaded into the _lines list. The complete __init__ method should now look like this:
    def __init__(self, tui_window):
        self._tui_window = tui_window
        self._tui_window.title = 'Value History'
        self._before_prompt_listener = lambda : self._before_prompt()
        gdb.events.before_prompt.connect(self._before_prompt_listener)
        self._lines = []
        self._next_history_index = 1
        self._update()
Next, add a call to _update from the _before_prompt method, replacing the existing debug line. The full _before_prompt method should now look like this:
    def _before_prompt(self):
        self._update()
        self.render()
And with these changes, you have a basic, working history window. Restart GDB using the command line:
gdb -ex 'source history.py' \
    -ex 'tui new-layout example_1 history 1 cmd 1 status 1' \
    -ex 'layout example_1'
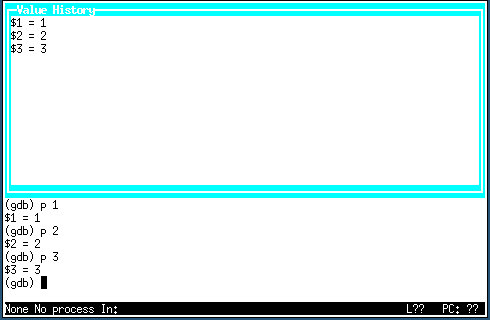
Figure 1 shows what the window should look like in action after entering a few commands in the command window:
Preparing for scrolling
What you have so far is great. But there is one problem. Once the window gets a lot of history values, the earlier ones are lost off the top of the window. It would be great if you could scroll back to view earlier values. So this will be the last feature you add in this tutorial.
But first, you need to rework the code a little to make it easier to add scrolling support.
Add the following methods to your history_window class:
    def _history_count(self):
        return self._next_history_index - 1

    def _display_start(self):
        return self._max_history_start()

    def _max_history_start(self):
        count = self._history_count()
        height = self._tui_window.height
        return max(1, count - height + 1)
The _history_count method returns the number of history items that have been loaded into the _lines variable.
The _display_start method returns the index of the first history value that should be displayed in the window. You don't do much here yet, but will extend the method later.
Finally, _max_history_start returns the history value index that the code should start from (that is, the value displayed at the top of the window) so that the last known history value also appears in the window (at the bottom).
Finally, go back to the following line that is currently in your render method:
lines = self._lines[-height:]
Replace that line with the following:
        start = self._display_start() - 1
        end = start + height
        lines = self._lines[start:end]
The function is now printing height number of lines starting from _display_start(). The - 1 is required because _display_start() returns a history index, which counts from 1, whereas _lines is a Python list, indexed from 0.
After these changes, the history_window should work just as it did before, and now you're ready for the final part of this tutorial.
Scrolling support
You need to make three more small changes to add scrolling support.
First, add the following line to the __init__ method before the call to self._update():
self._vscroll_start = None
This variable acts as a marker to indicate whether the window is scrolled. When set to None, the window is not scrolled. Therefore, new values should be added to the end of the window and old values should disappear from the top. In contrast, when the variable is set to an integer, it indicates which history value to scroll back to. The window will then always display items starting from that index.
Next, rewrite the _dispay_start method like this:
    def _display_start(self):
        if self._vscroll_start is None:
            start = self._max_history_start()
        else:
            start = self._vscroll_start
        return start
Now, if _vscroll_start has been set, the window treats it as the index to start the display. If _vscroll_start is not set, the method does things exactly as before.
Finally, add the following vcsroll method to your history_window class:
    def vscroll(self, num):
        start = self._display_start()
        start += num
        start = max(1, start + num)
        max_start = self._max_history_start()
        if start >= max_start:
            self._vscroll_start = None
        else:
            self._vscroll_start = start
        self.render()
The num argument indicates the number of lines by which GDB would like to scroll the window contents. Pressing the up or down arrow keys results in a single line change, whereas the PageUp or PageDown keys result in a larger change based on the current size of the window.
The vscroll method figures out the history index for the current first line of the window, and adjusts this index by the value of num. The method clamps this value to some sane bounds: thus, you can't scroll back before index 1 (the first GDB history index), nor should you scroll forward beyond the value of max_start. This variable stores the index from which you can start printing items and still get the last item from the history shown within the window.
Finally, if the user has scrolled as far down as the value in max_start, the method sets _vscroll_start to None. This indicates that as new history values appear, they should be added to the bottom of the window, pushing older values off the top.
And with that, your window is complete. You can scroll back to view all the old history values, and forward again to view the latest history values.
What next?
There are two useful TUI window methods you haven't used in this tutorial: hscroll and click.
The hscroll method allows horizontal scrolling, just as vscroll allows vertical scrolling. A good exercise would be to add horizontal scrolling to your history window. Currently, any long history values are truncated. It would be great if you could scroll left and right to view the full value.
The click method allows basic mouse interaction with the window. You could use this method to enhance the example to display history values in their multiline format and use mouse clicks to expand or hide the full values.
To read more about the hscroll and click methods, see the TUI-specific documentation. To read more about GDB's Python API, see the complete Python API documentation.