The financial industry is increasingly embracing International Organization for Standardization (ISO) 20022-based standards (MX messaging) to exchange messages for both payments and securities. Key benefits of MX messaging include its ability to capture richer data, flexibility, and machine-readable format. However, the older SWIFT MT message set is still deeply entrenched in the core systems and processes of the financial sector. This situation has created a growing demand for MT-MX conversion.
In this article, I will show you one way to achieve MT to MX mapping on Red Hat OpenShift using the message transformation platform from Trace Financial, a Red Hat Independent Software Vendor (ISV), and Red Hat Fuse.
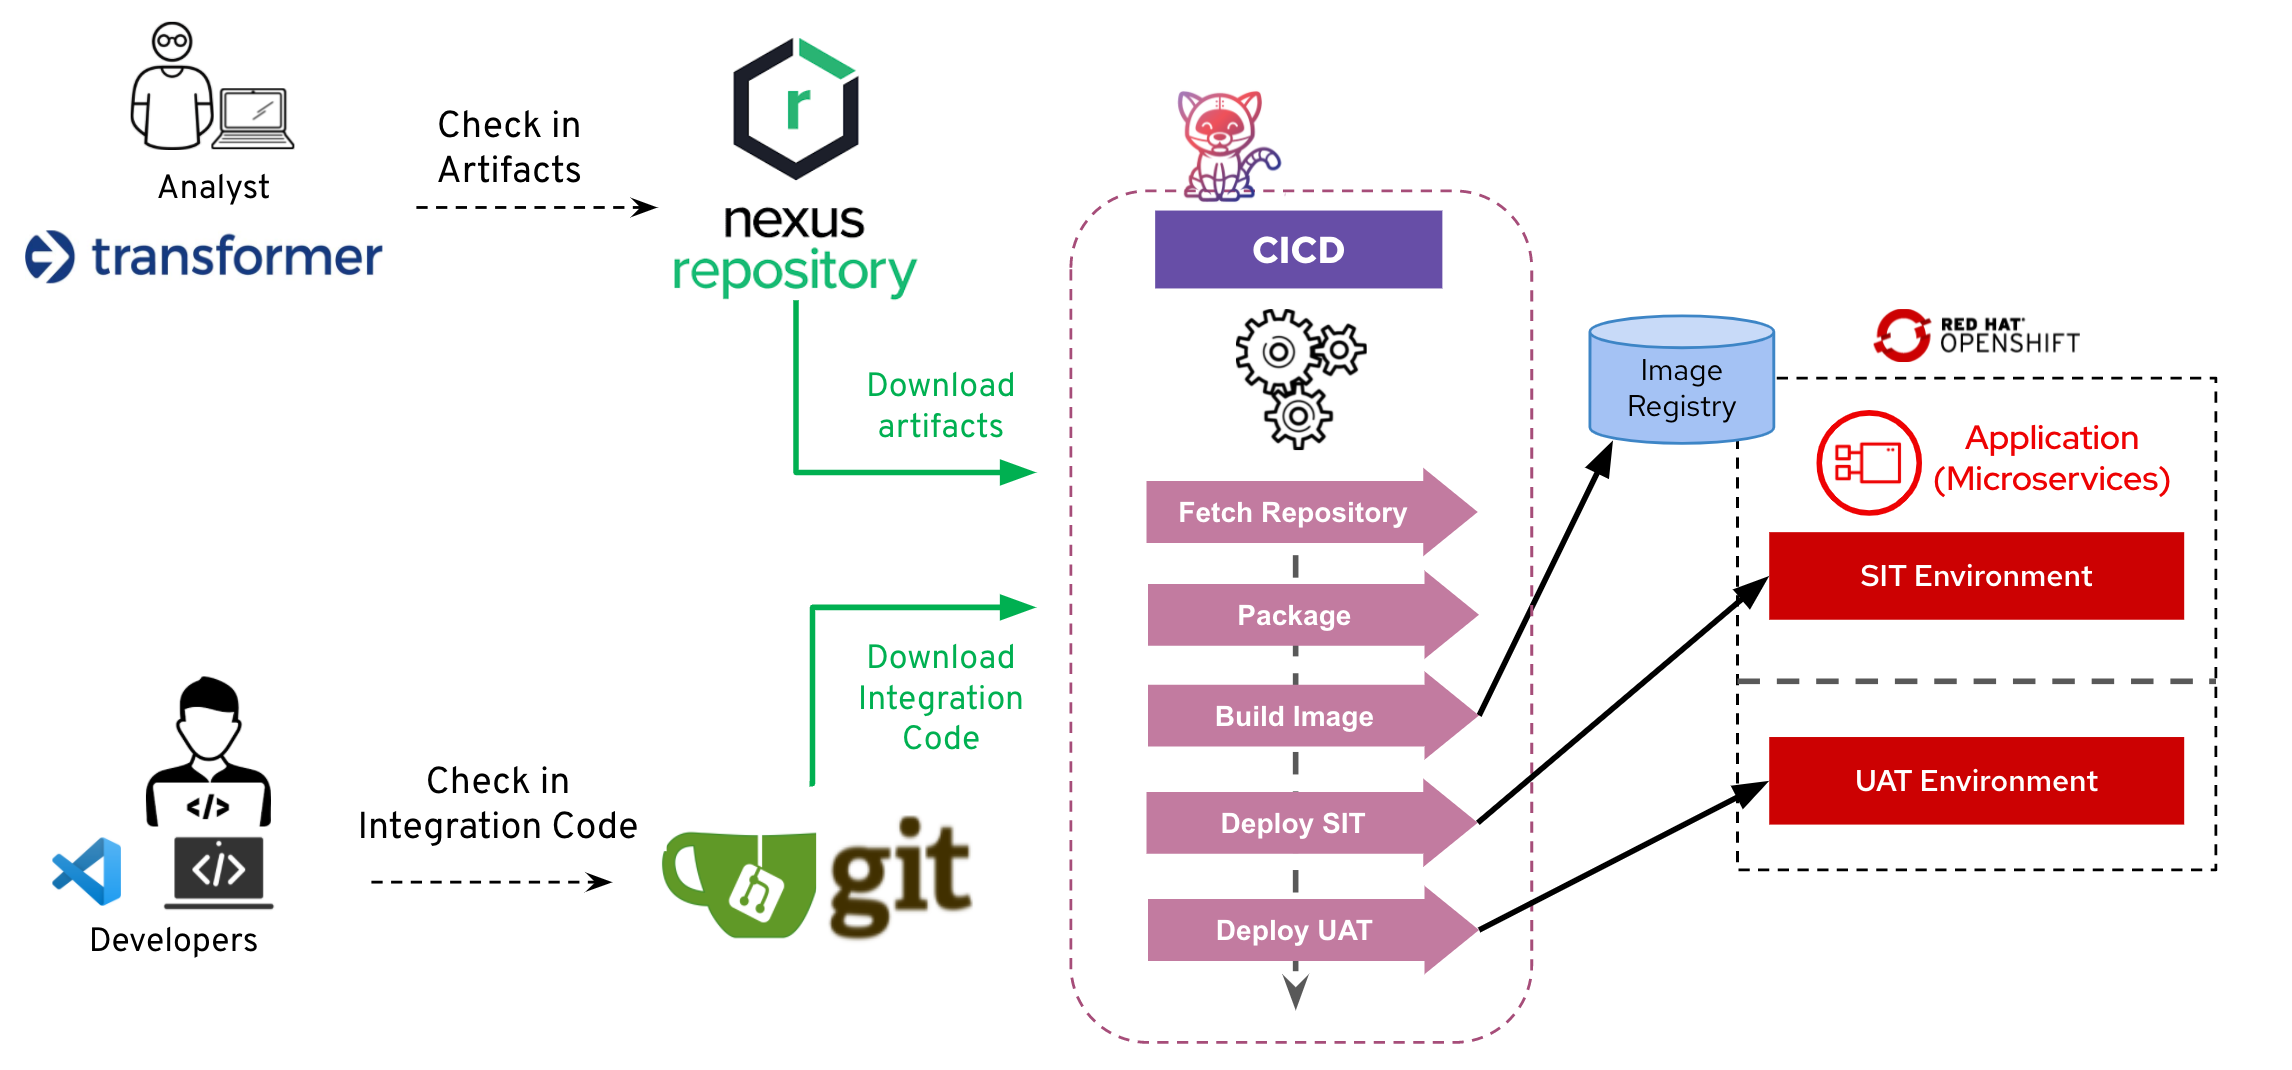
ISO 20022 MX transformation with CI/CD
This approach minimizes the dependency between the business analysts and integration developers: Business analysts can focus on building the message/data transformations using the Trace Transformer tool, while integration developers focus on building the integration routes and endpoints. The output from the business analysts is uploaded into an artifact repository, while the developers' code is stored in a Git repository.
The CI/CD pipeline automates building, packaging, and deployment into multiple environments in OpenShift (Figure 1). OpenShift's monitoring stack monitors the transactions and issues alerts, which developers can view using the Prometheus metrics service and the Grafana display tool.
MT-MX mapping with Trace Transformer
Trace Transformer is a desktop IDE that lets a non-programmer business analyst create, consume, validate, and transform complex messages rapidly while complying with message standards that are themselves rapidly evolving. The advantages of Trace Transformer include the following:
- It comes with a full set of ready-built, high-quality message definitions and mappings.
- It validates messages against public standards such as ISO 20022, as well as in-house rules.
- It eliminates coding for message transformations, even for very complex ones.
- It builds in quality control by making testing integral to development, executing tests "as you build."
Transformer's ready-built mappings capture all of the intricacies of SWIFT's global MT-MX specification, which runs to several hundred pages. This MT-MX mapping suite is based on consistently updated libraries of SWIFT standards. The mappings can support both Extensible Markup Language (XML) and JavaScript Object Notation (JSON) as input or output. The MT format does not have to be transformed into an XML equivalent before starting to use Trace Transformer.
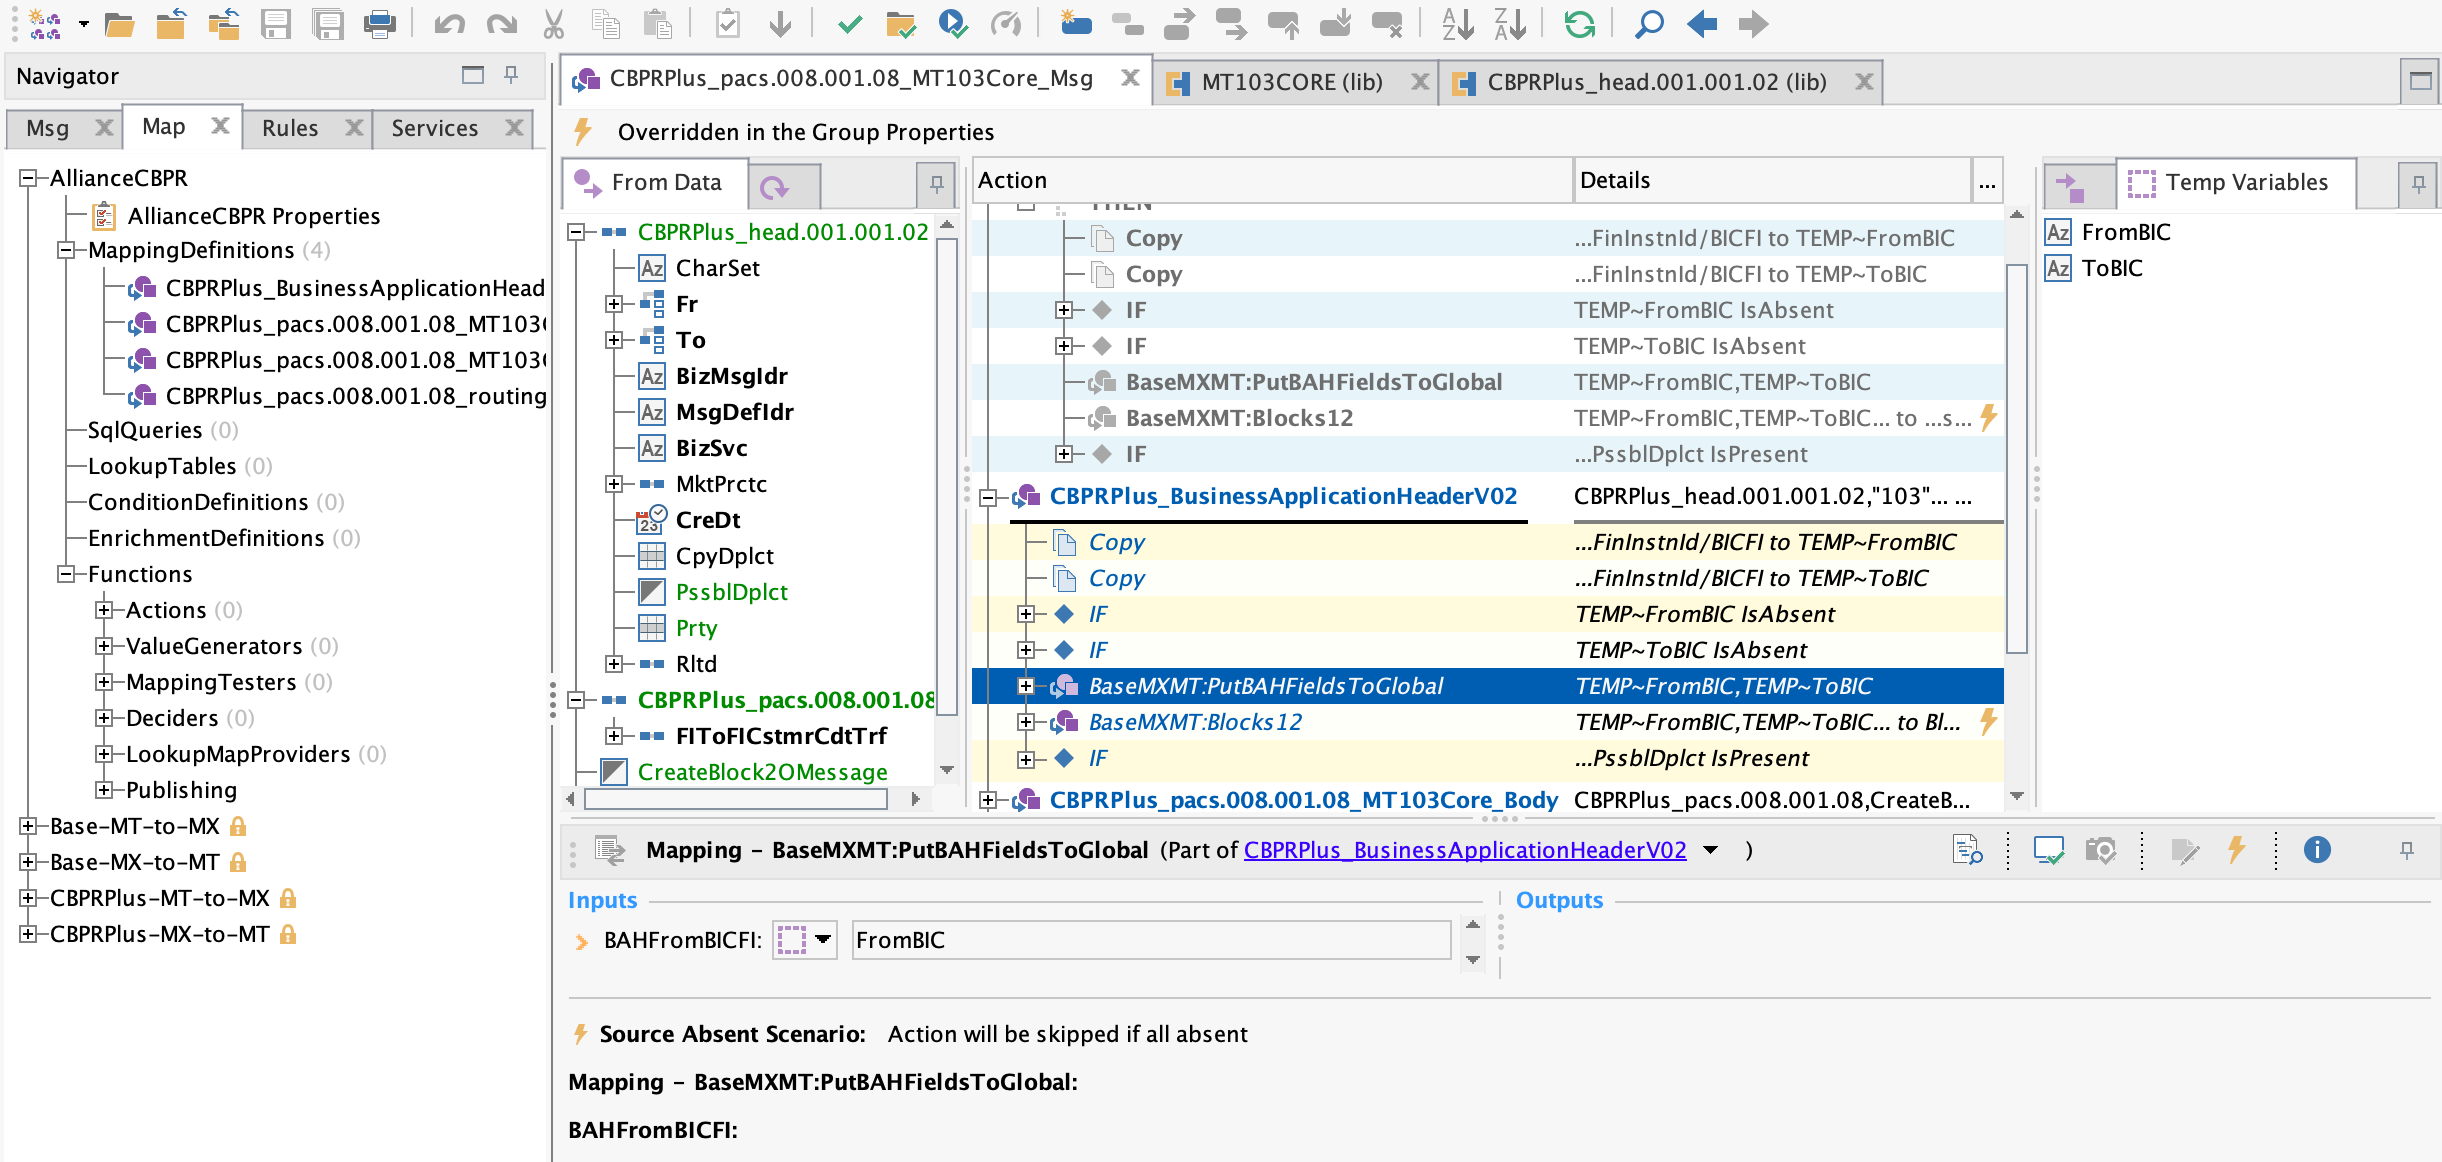
Users can view the mappings in the Transformer Design-Time GUI, which provides a very clear and nontechnical visualization, ideal for analysts (Figure 2).
Cloud-based integration tools
Red Hat Integration provides developers and architects with cloud-based tools for integrating applications and systems. Its capabilities include application and application programming interface (API) connectivity, API management and security, data transformation, service composition, service orchestration, real-time messaging, data streaming, change data capture, and maintaining consistency across data centers.
Red Hat Integration was built for cloud-based development, so developers can use the same advanced build, management, and runtime platforms to connect systems that they use for new service development and integration. The cloud-based tools create deployable artifacts for cloud platforms. Platforms can be combined for public cloud, private cloud, and on-premise environments for scalable, highly available microservices using powerful container management tools.
Red Hat Fuse is a distributed, cloud-based integration platform based on open source projects such as Apache Camel. Fuse allows you to define routing and mediation rules in a variety of languages and between different types of endpoints.
Transformer provides an Apache Camel Component implementation that is bound into the CamelContext by default. The Transformer Camel Component is bound against the txfrmr URI scheme. For instance, a route to a message transformation service might start with a txfmr:com.alliance.mxToMt/ string. When you include txfrmr in a route, the URI resolves to an exposed service operation.
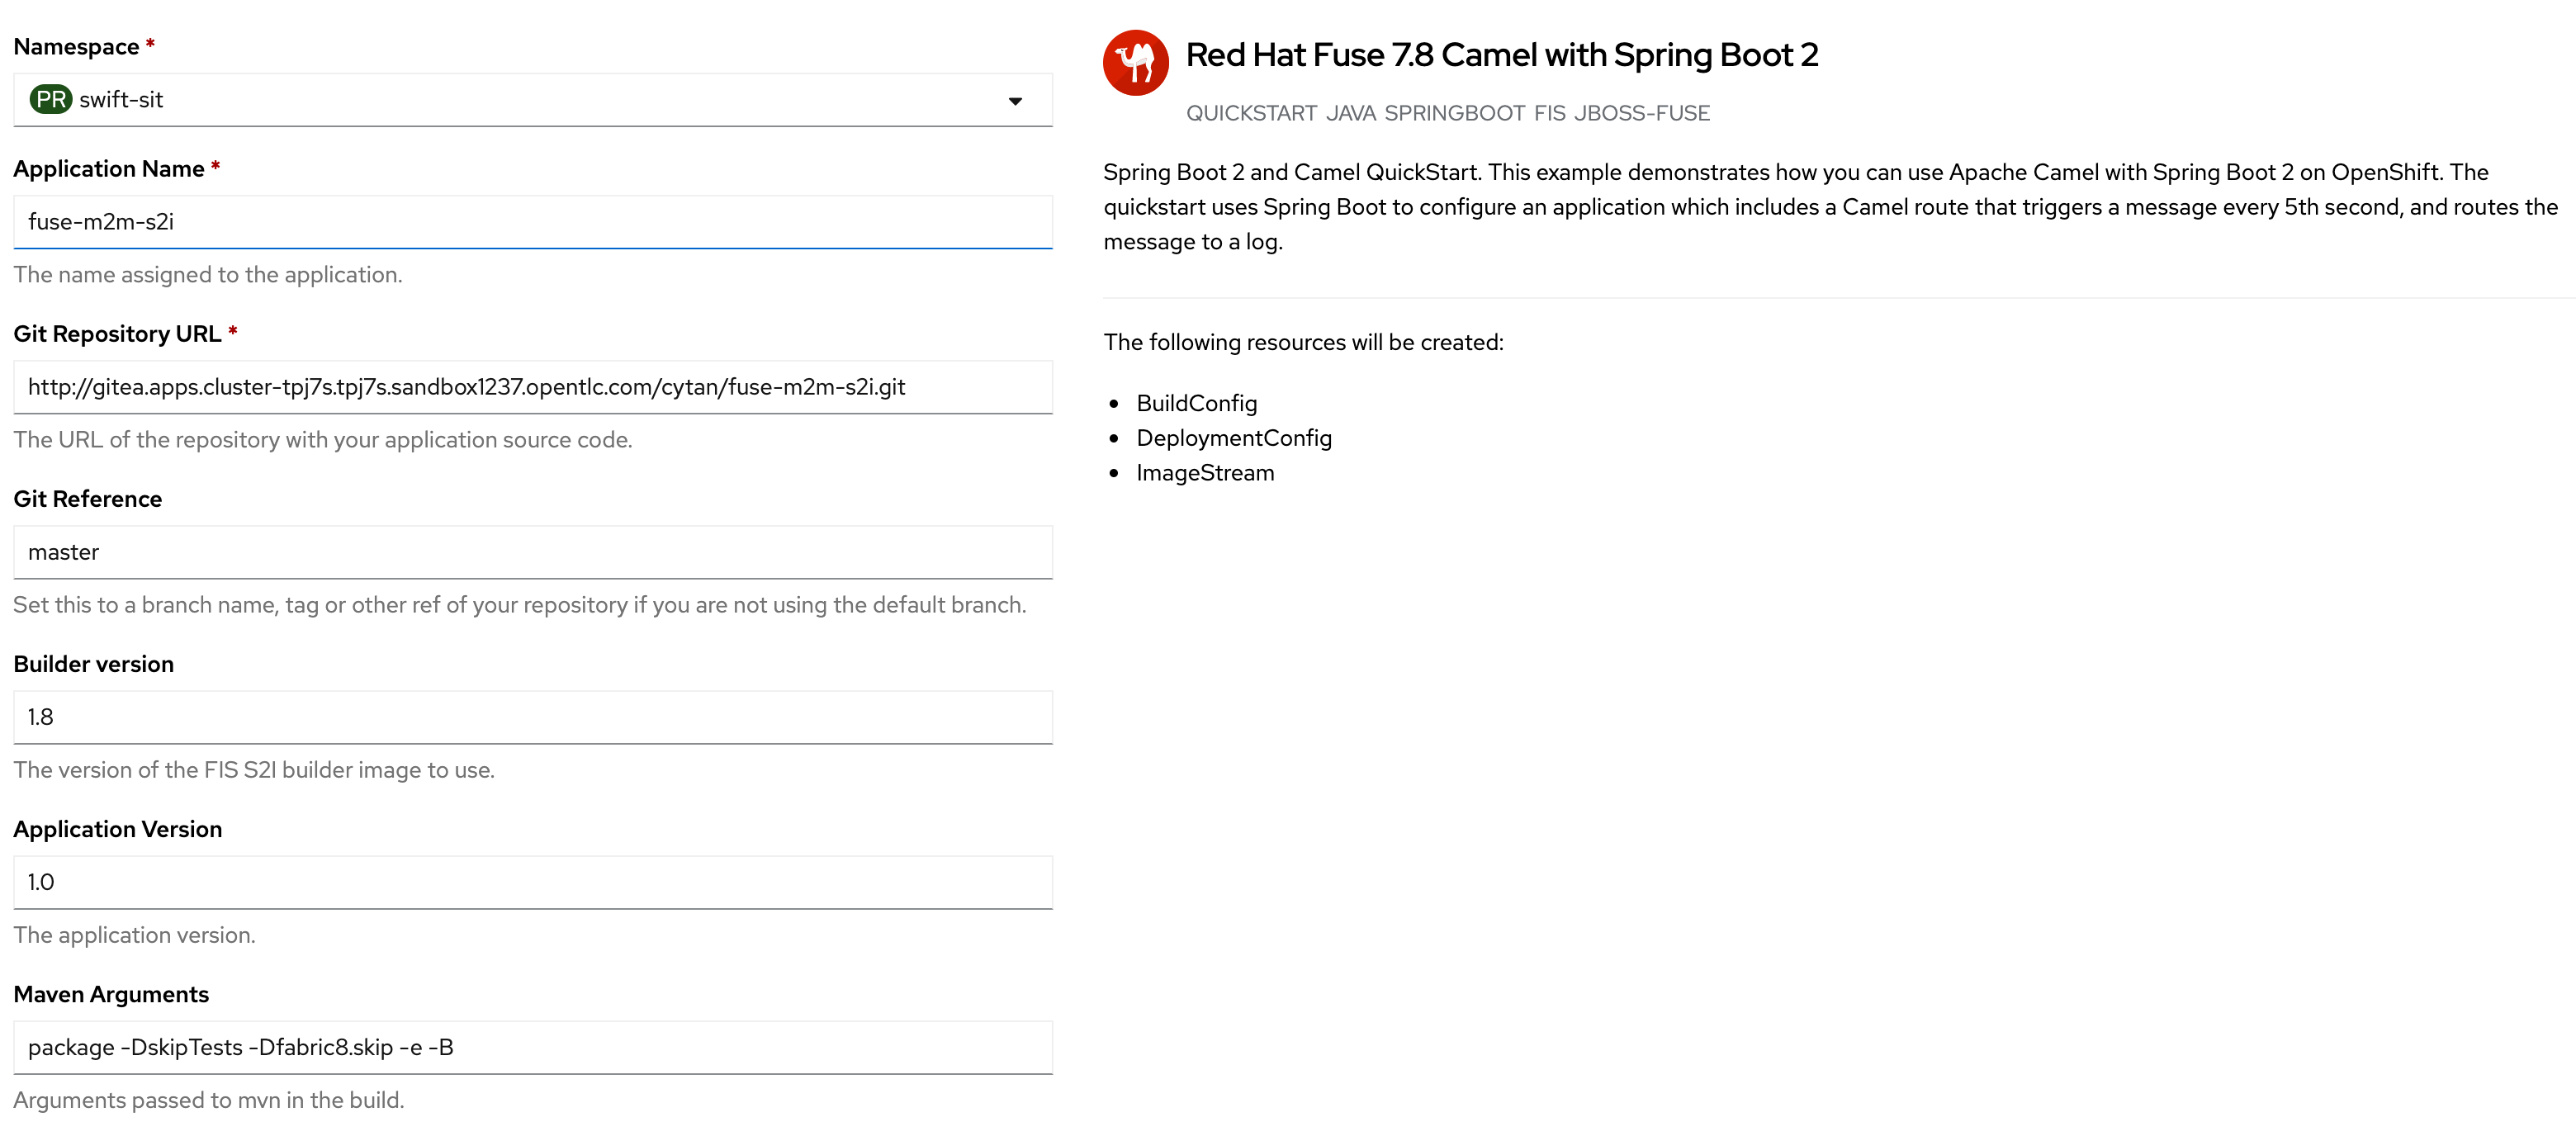
Red Hat Fuse Source-to-Image (S2I) is available as a template in OpenShift (Figure 3), making it easy to build and package the integration source code and transformer libraries as inputs and produce a container image that runs the assembled application as output.
Automate cloud-based CI/CD with Tekton
Because financial messaging formats and standards are rapidly updated to meet market demand, automation is mandatory to deploy and release the new changes and products into production.
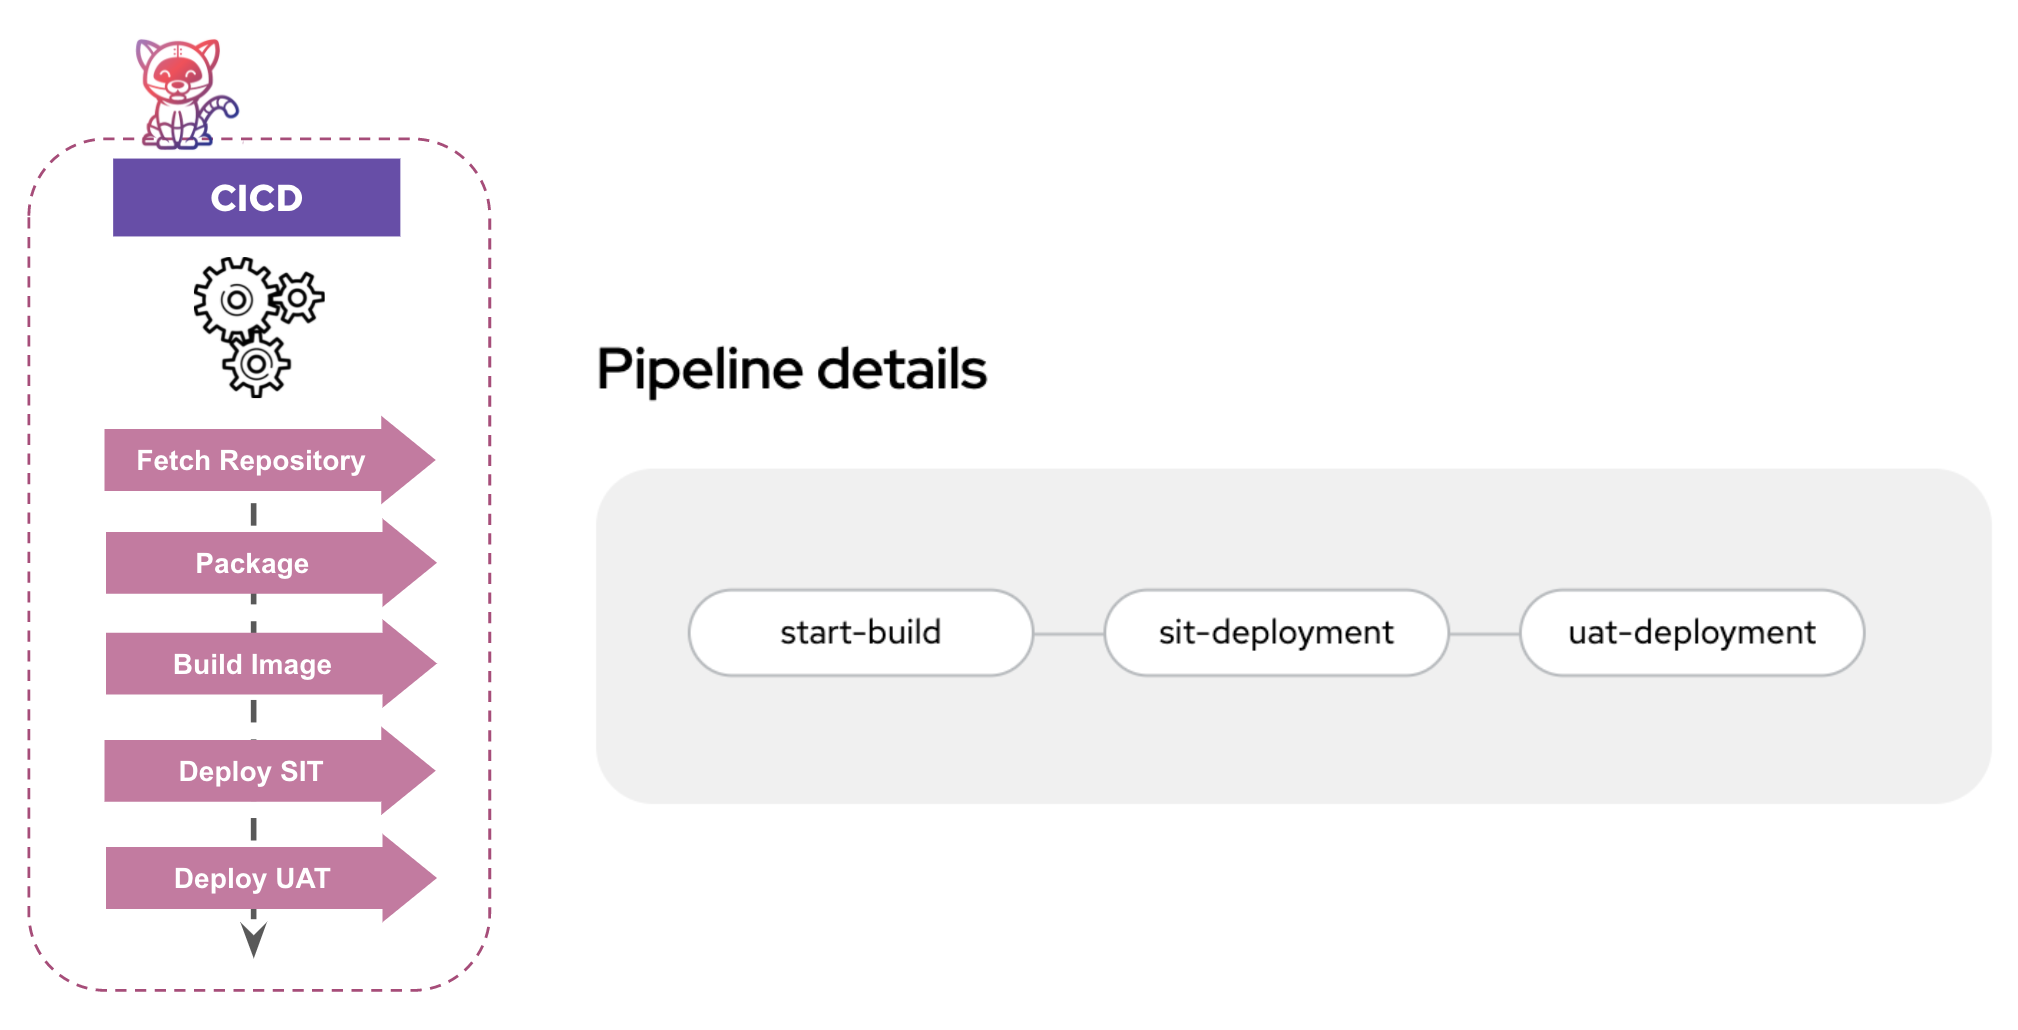
Tekton is a powerful, cloud-aware CI/CD tool available as an OpenShift Pipeline in OpenShift, enabling the automation of CI/CD.
Business analysts can update changes to the message transformation process using Transformer and upload the output JAR into an artifact repository. The upload triggers the Pipeline to automate the CI/CD process and deliver results quickly (Figure 4). The process does not require developers to make any code changes or to be involved in the packaging/deployment processes.
On the other hand, developers must get involved when additional business channels are required for business expansion, which happens less often than changes to message standards. Developers can create new integration flows and endpoints to extend the new business channels by reusing the transformation libraries. The developers do not require deep knowledge of financial message transformation and mapping.
This decoupling eliminates the bottleneck of the traditional approach to financial message delivery, where the analysts are required to document the message transformation and to elaborate the steps to the developers in order for them to program the logic.
Monitoring and alerting tools
The OpenShift graphical interface offers tools for setting up and viewing monitoring and alerts. This section steps through some available tools.
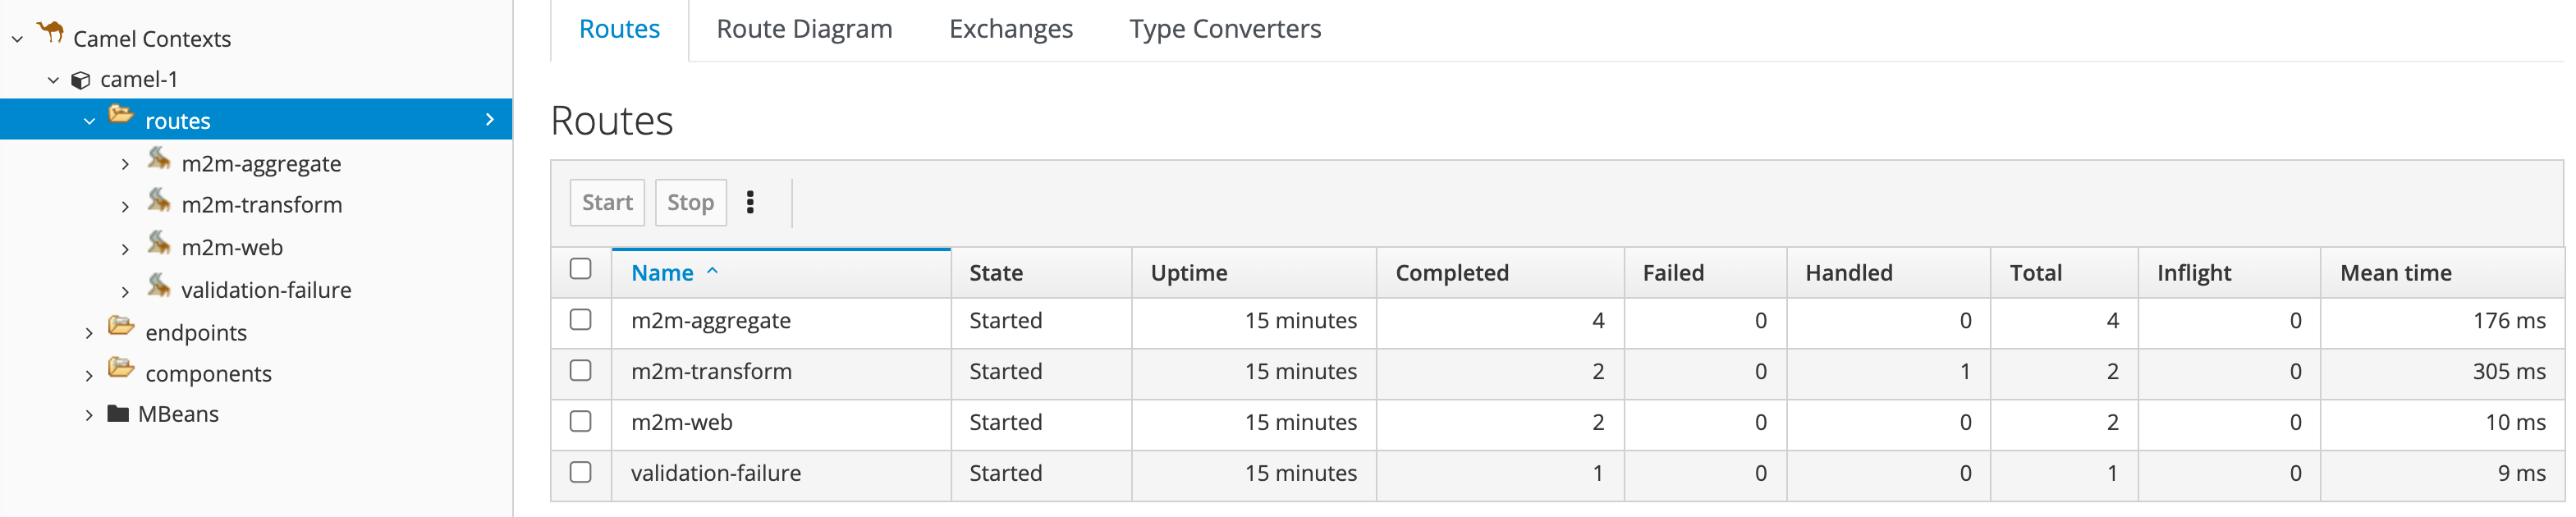
Red Hat Fuse console
Red Hat Fuse includes a web console (Figure 5) based on Hawtio open source software. The console provides a central interface to examine and manage the details of one or more deployed Red Hat Fuse containers. You can also monitor Red Hat Fuse and system resources, perform updates, and start or stop services.
OpenShift monitoring
OpenShift includes a preconfigured, preinstalled, and self-updating monitoring stack that provides monitoring for core platform components (Figure 6). A set of alerts are included that, by default, immediately notify cluster administrators about issues with a cluster.
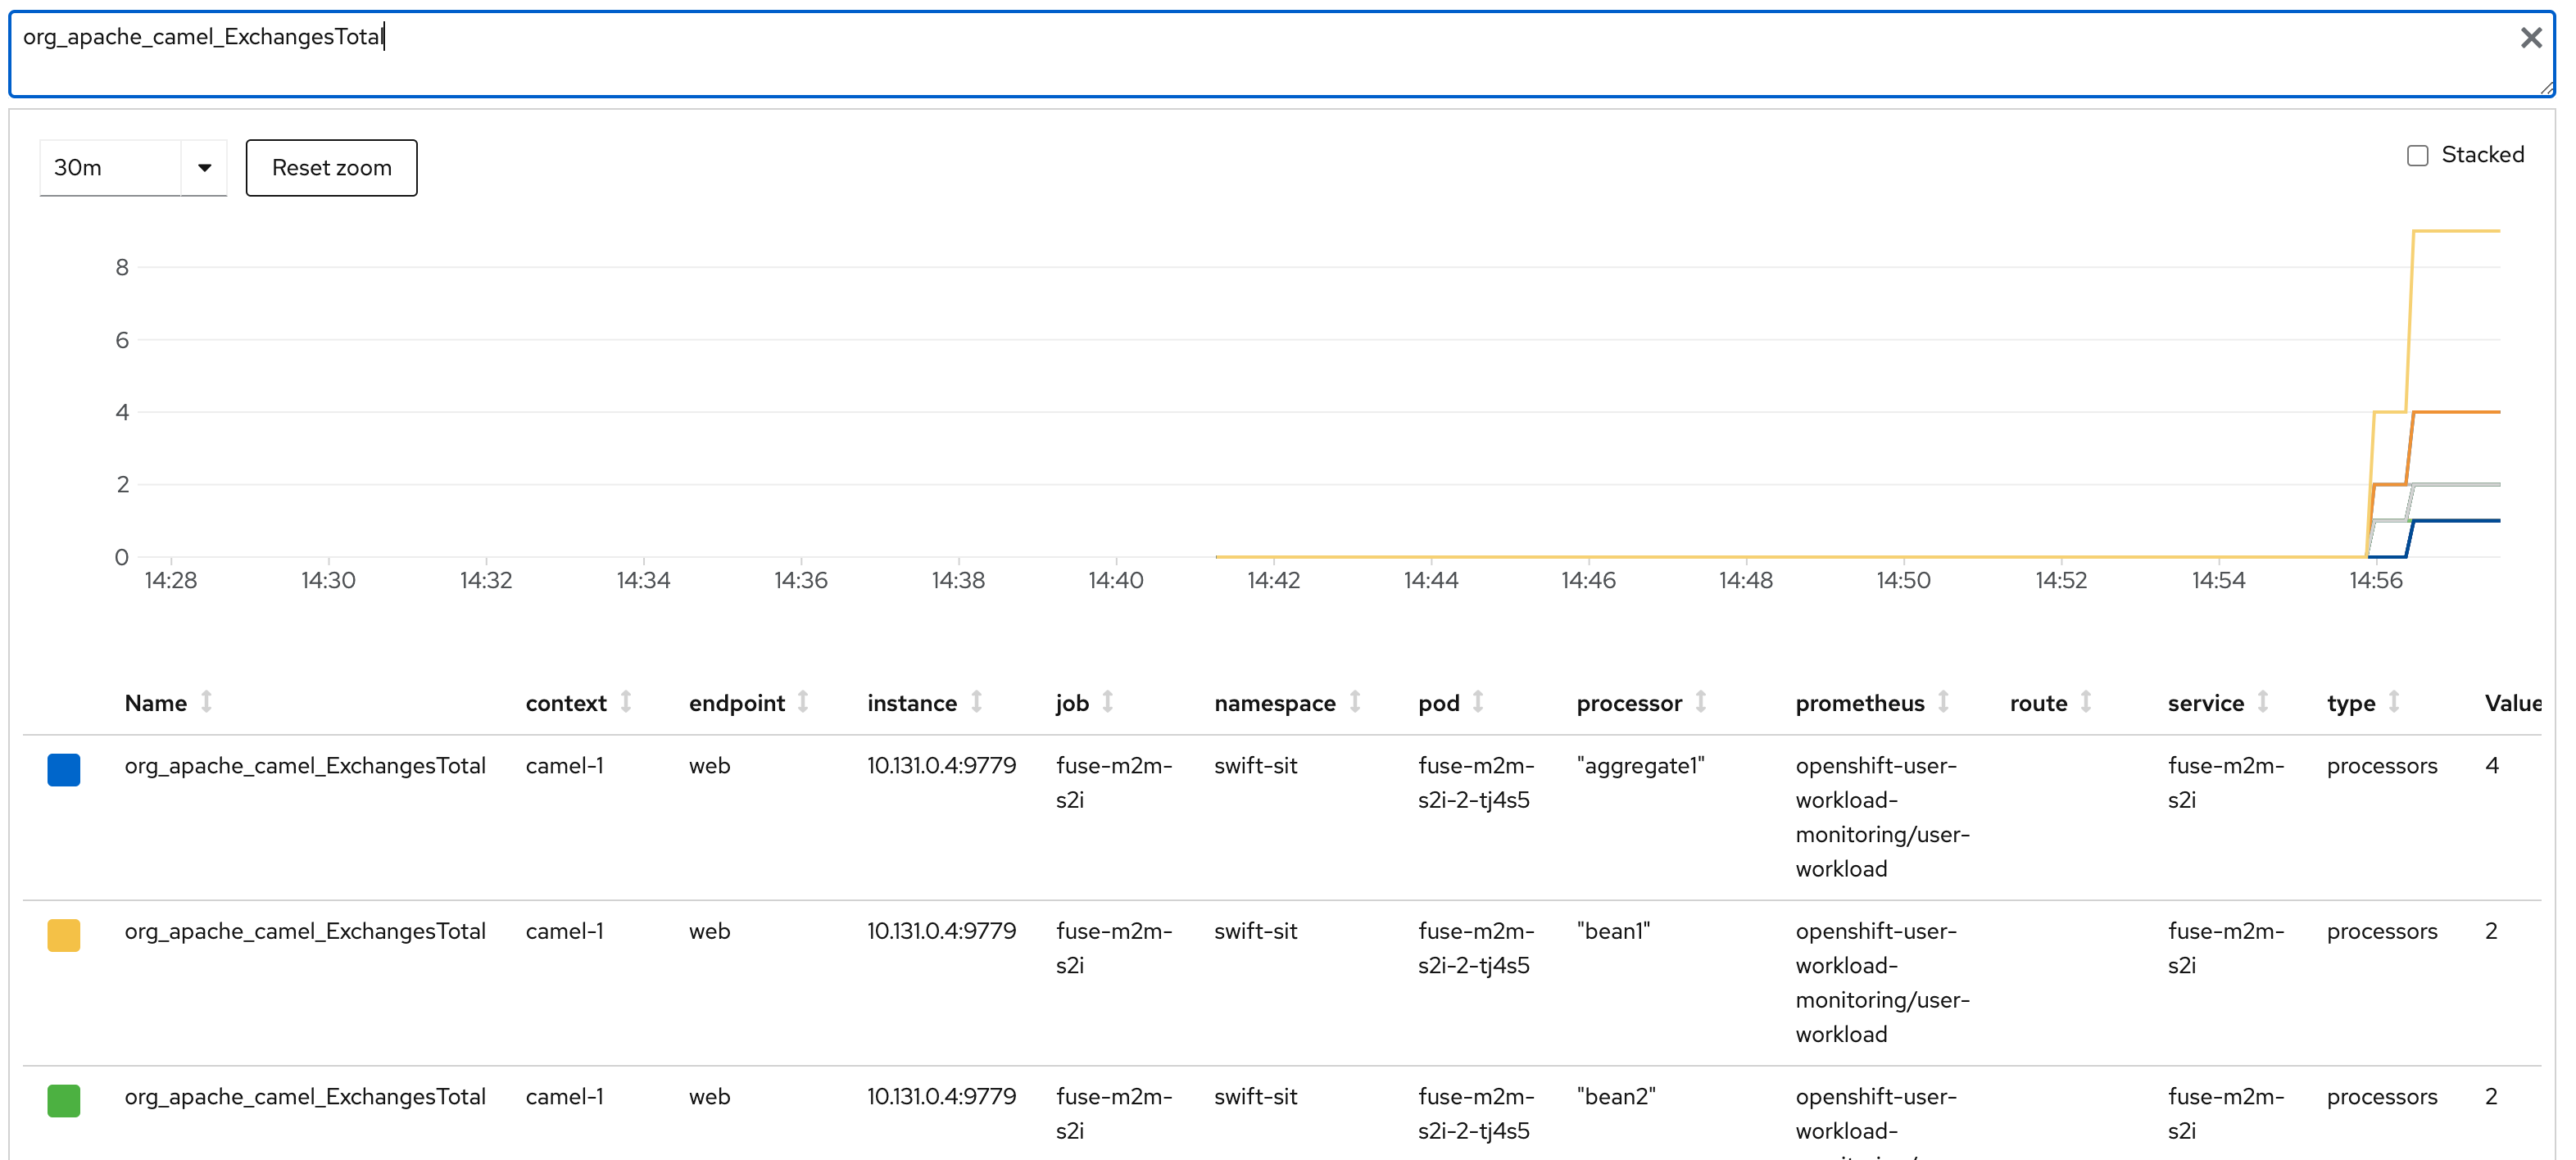
By enabling the monitoring for user-defined projects, you can define the business services and pods to be monitored in their own projects. You can then query metrics, review dashboards, and manage alerting rules and silences for your projects in the OpenShift web console.
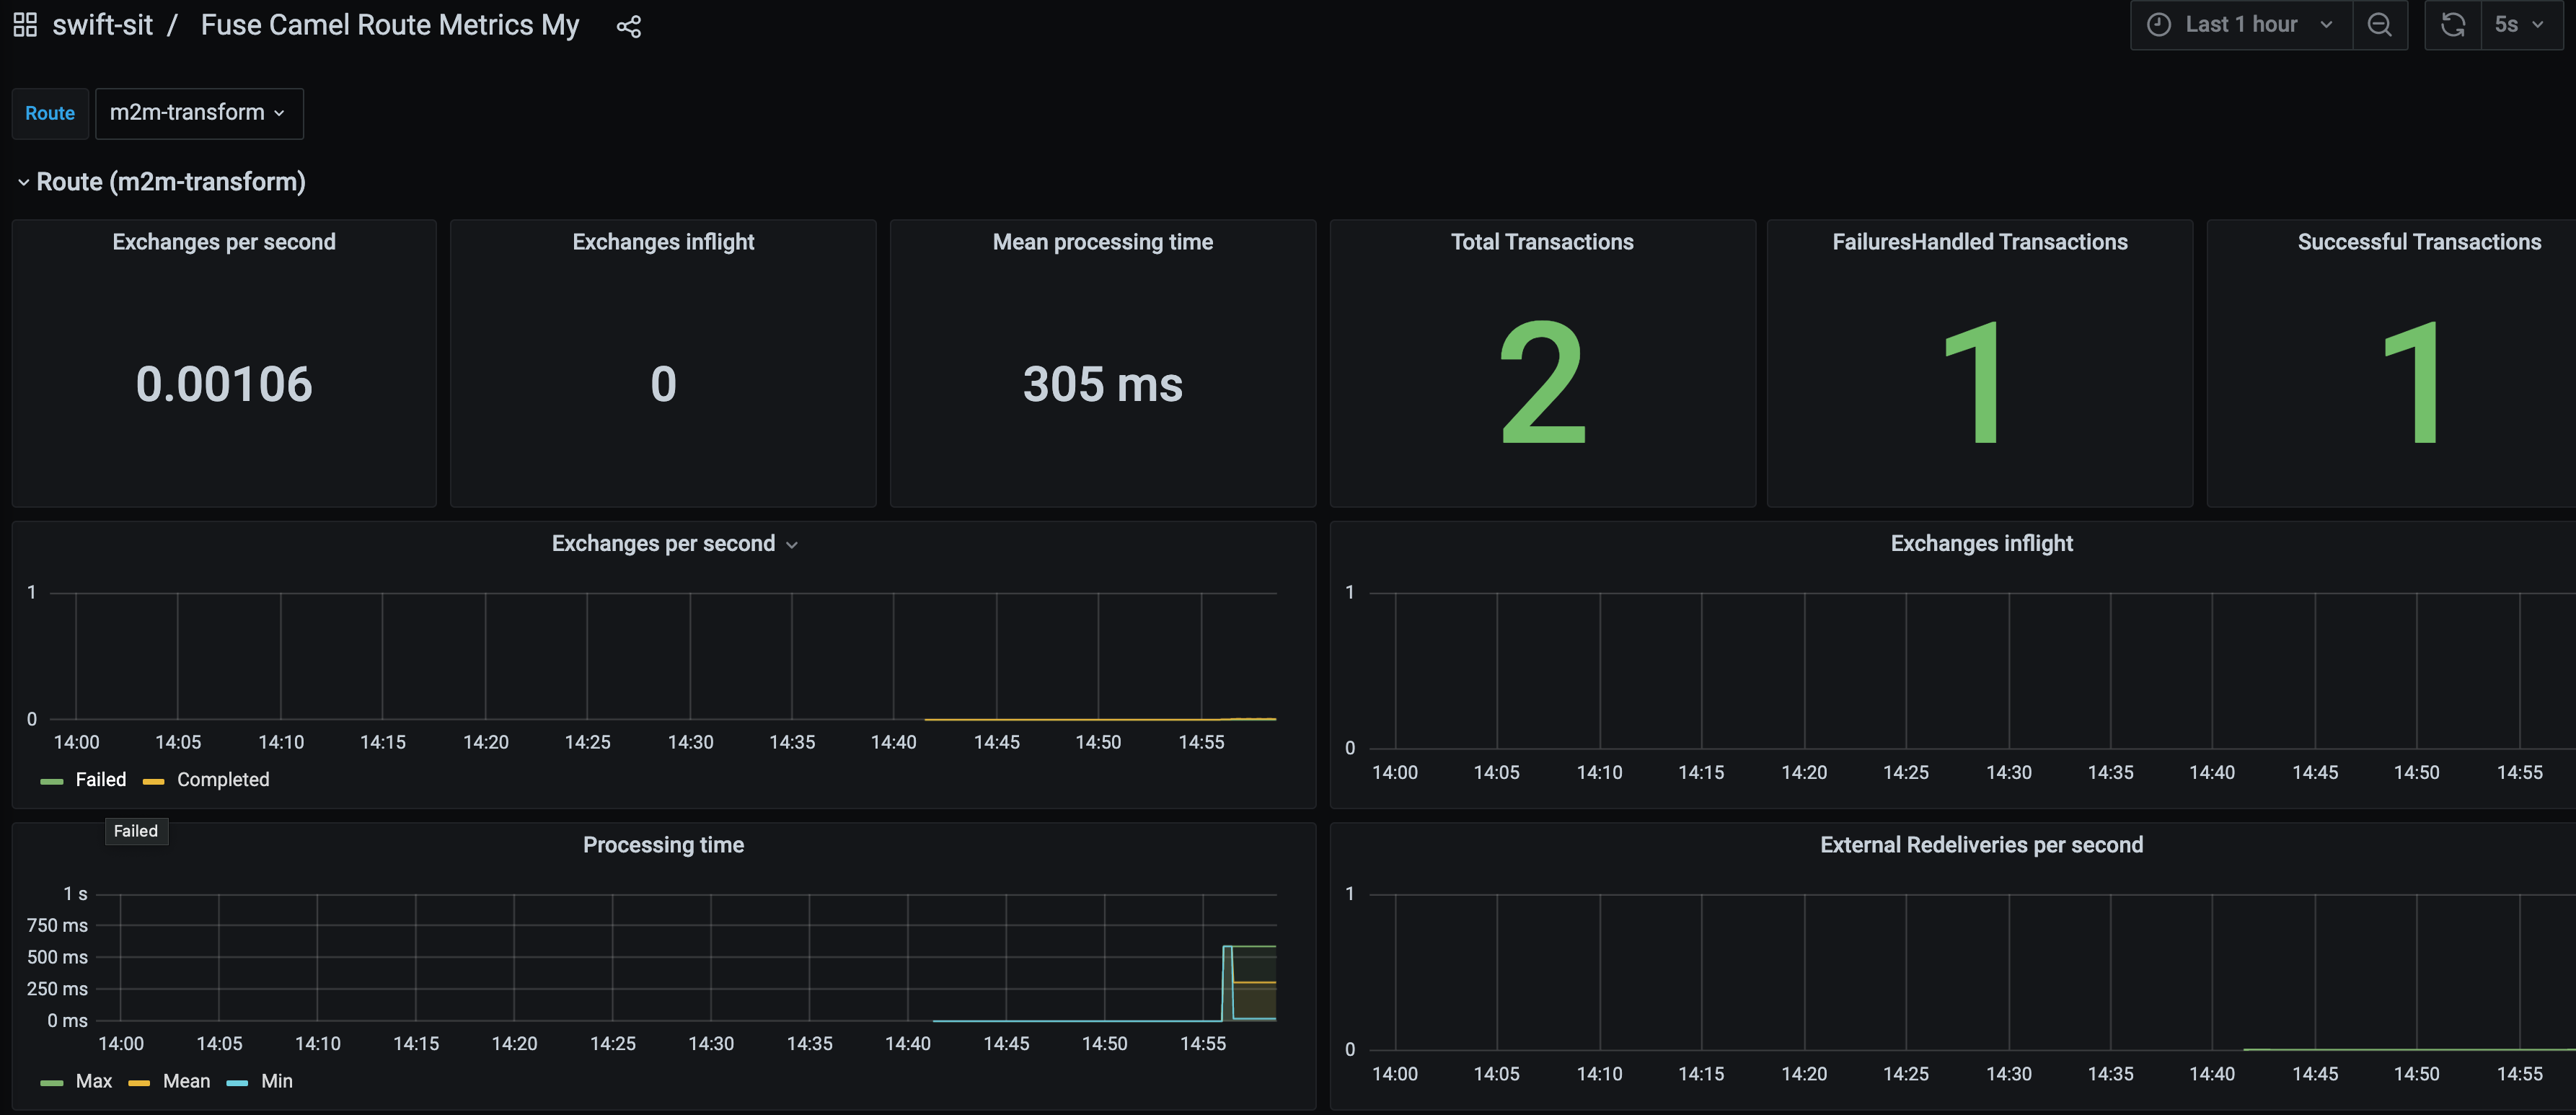
Grafana data visualization
For visualizing the data and metrics generated by the monitoring, Grafana can be used as a dashboard. Grafana is an open source tool for running data analytics and pulling up metrics that make sense of the massive amount of data with customizable dashboards. You can create charts, graphs, and alerts for the Red Hat Fuse message transactions when connected to Prometheus in the OpenShift platform (Figure 7).
Video demo
I have created a video to show the elements of the approach presented in this article.
Conclusion
The approach described in this article decouples the dependencies between the technologies used. Thus, it is potentially possible to further modernize the integration piece with Red Hat OpenShift Serverless, Red Hat build of Quarkus, Camel K, Kamelets, and Red Hat AMQ Streams (Apache Kafka).
Keen to explore some hands-on interactive lessons? The following links can help you learn more about the central technologies in this article:
Last updated: November 3, 2023