Knowledge meets machine learning for smarter decisions, Part 1
Learn how to use Red Hat Decision Manager to create your own machine learning model that blends the domains of knowledge enginering and machine learning.

Learn how to use Red Hat Decision Manager to create your own machine learning model that blends the domains of knowledge enginering and machine learning.

Explore the updates in the odo 2.0 CLI, which now integrates with Kubernetes, defaults to devfile deployments, and lets you deploy Operators.
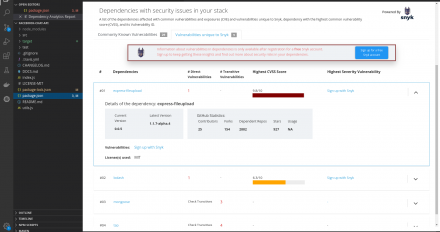
Tackle security vulnerabilities in your open source code with the latest CodeReady Dependency Analytics and its Snyk Intel Vulnerability DB integration.

Explore the range of Kubernetes 1.18-based technology updates that improve the operational and development experience when using OpenShift 4.5.
Improve Python 3.8's run speed by 30% in RHEL 8.2 by compiling with GCC's -fno-semantic-interposition flag.

Explore the Red Hat Enterprise Linux (RHEL) 7 language and runtime updates available in Red Hat Software Collections 3.5 and Red Hat Developer Toolset 9.1.

Learn how to use Nagios passive checks and OpenShift's Watchdog alert to make sure that alerting is still working in your cluster.

Write a Python-based application binary interface (ABI) checker to ensure backward compatibility between shared libraries in Linux systems

Support for Python 2 ends January 1, 2020; make plans to move to Python 3 now.
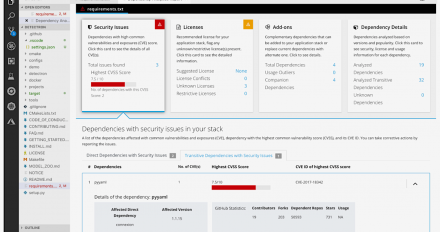
The Red Hat Dependency Analytics IDE plugin is now available; we explain the new capabilities of this release.

Guidance for creating ABI compatible Python wheels for RHEL and the new manylinux2014 standard
You can use Red Hat Enterprise Linux 8 Universal Base Images and application streams to develop in containers even if you are still running RHEL 7
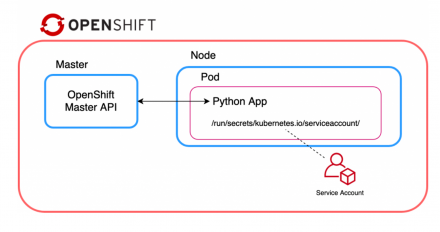
How to configure a Python application running within Red Hat OpenShift to communicate with the OpenShift cluster via the openshift-restclient-python.

The Raspberry Pi is a popular, powerful, low-cost Linux machine that can do amazing things. This article shows you how to build a photo booth with one.
Learn how to create a Flask application running on OpenShift, which will use the Kubernetes Python client to interact with the OpenShift API.
Of course RHEL 8 has Python, both Python 3 and 2. Changes in RHEL 8 such as platform python and application streams improve the Python experience in RHEL.

To install Python, type `yum install python3`. To run Python, type `python3`. What you need to know for using Python in RHEL 8.

Everything you need to install Python and related utilities on Red Hat Enterprise Linux 7, 8, and 9. Includes Python tips and FAQs.
This article shows how to use Python-based messaging clients and STOMP to connect and subscribe to a durable topic in the Apache ActiveMQ Artemis or the Red Hat AMQ 7 broker. STOMP clients can communicate with any STOMP message broker, providing messaging interoperability among many languages, platforms, and brokers.

If you need to build some Python-based microservices, one way to do it is to install Python in a Red Hat Enterprise Linux virtual machine and use Flask, a microframework that makes building RESTful services easy.

Introducing conu - low-level python library for container scripting. conu gathers utilities that come in handy when creating tests, provides nice logging for troubleshooting and is easily extensible.

APIs are critical to automation, integration and developing cloud-native applications, and it's vital they can be scaled to meet the demands of your user-base. In this article, we'll create a database-backed REST API based on the Python Falcon framework using Red Hat Software Collections (RHSCL)

Rust is a language that has no runtime so it can be used to integrate with any runtime; You can write modules in Rust and call using Python
