Page
Monitor and scale JBoss EAP 8 applications on OpenShift
In this lesson, you will:
- Scale up and down the EAP 8 application pod using the Red Hat OpenShift web console.
- Configure HPA autoscaling for the JBoss EAP 8 application.
- Verify the autoscaling based on incoming network traffic.
Observe the modern application to monitor resource utilization
The Observe section in the OpenShift web console serves as a central hub for all your monitoring and observability needs. It provides functionalities to keep tabs on the health and performance of your cluster, applications, and resources.
- When you go back to the Topology view from the developer perspective in the OpenShift web console, you will see the running JBoss EAP 8 application and PostgreSQL pod (Figure 1).
Click the JBoss EAP 8 pod to show the details on the right. Then, select the Observe tab, which showcases the JBoss EAP 8 pod’s CPU usage.
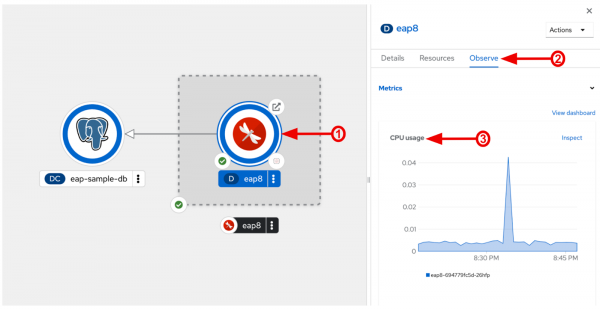
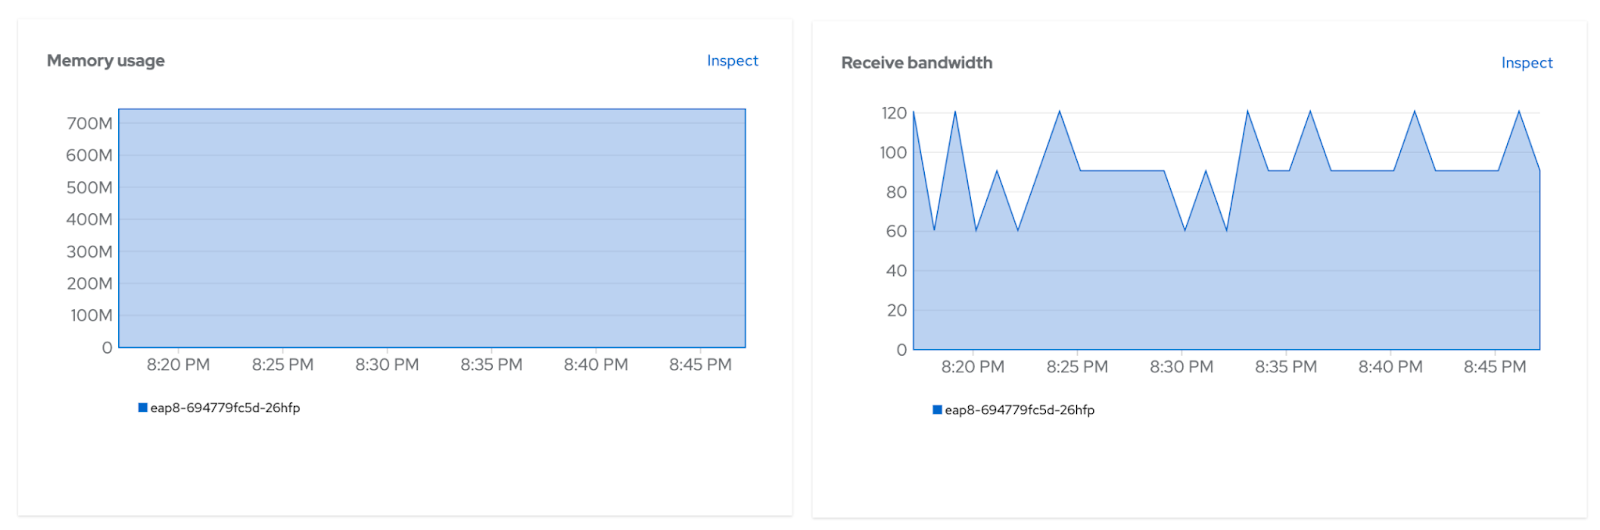
Figure 1: Observe the JBoss EAP 8 application’s CPU usage. When you scroll down the Observe panel, you can find more metrics about the JBoss EAP 8 application’s memory and receive bandwidth usage (Figure 2).

Figure 2: Observe the JBoss EAP 8 application’s memory and receive bandwidth usage. In addition, the observation capability in OpenShift does not just provide metrics, but it also allows you to access a holistic dashboard in terms of proactive problem detection, root cause analysis, performance optimization, and improved application health while maintaining the JBoss EAP 8 servers as Day 2 operations. For example, dashboard alerts help identify potential issues before they impact your users or JBoss EAP 8 applications. You can also explore predefined queries or create custom PromQL queries to drill down into specific aspects like CPU usage, memory consumption, network traffic, and more.
When you click View dashboard, you will see the Dashboard page (Figure 3). You can also select the other tab menu to retrieve Metrics, Alerts, Silences, and Events for running pods (e.g., JBoss EAP 8 application, PostgreSQL) in your project.
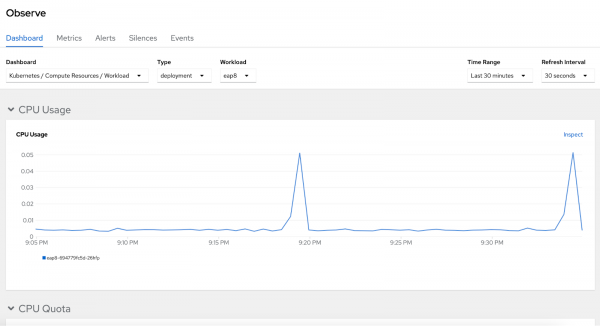
Figure 3: Observe Dashboard. You might be wondering how you could handle scaling (i.e., increasing and decreasing) the JBoss EAP servers (pods) along with the observation (e.g., metrics). For example, let’s say you need to increase the number of JBoss EAP servers to process rapidly increasing network traffic during Black Friday, since you already identified unexpected memory spikes in the past. To address this event, you can scale up the JBoss EAP pods manually via the OpenShift web console just as you would on-premise or in virtual machine environments.
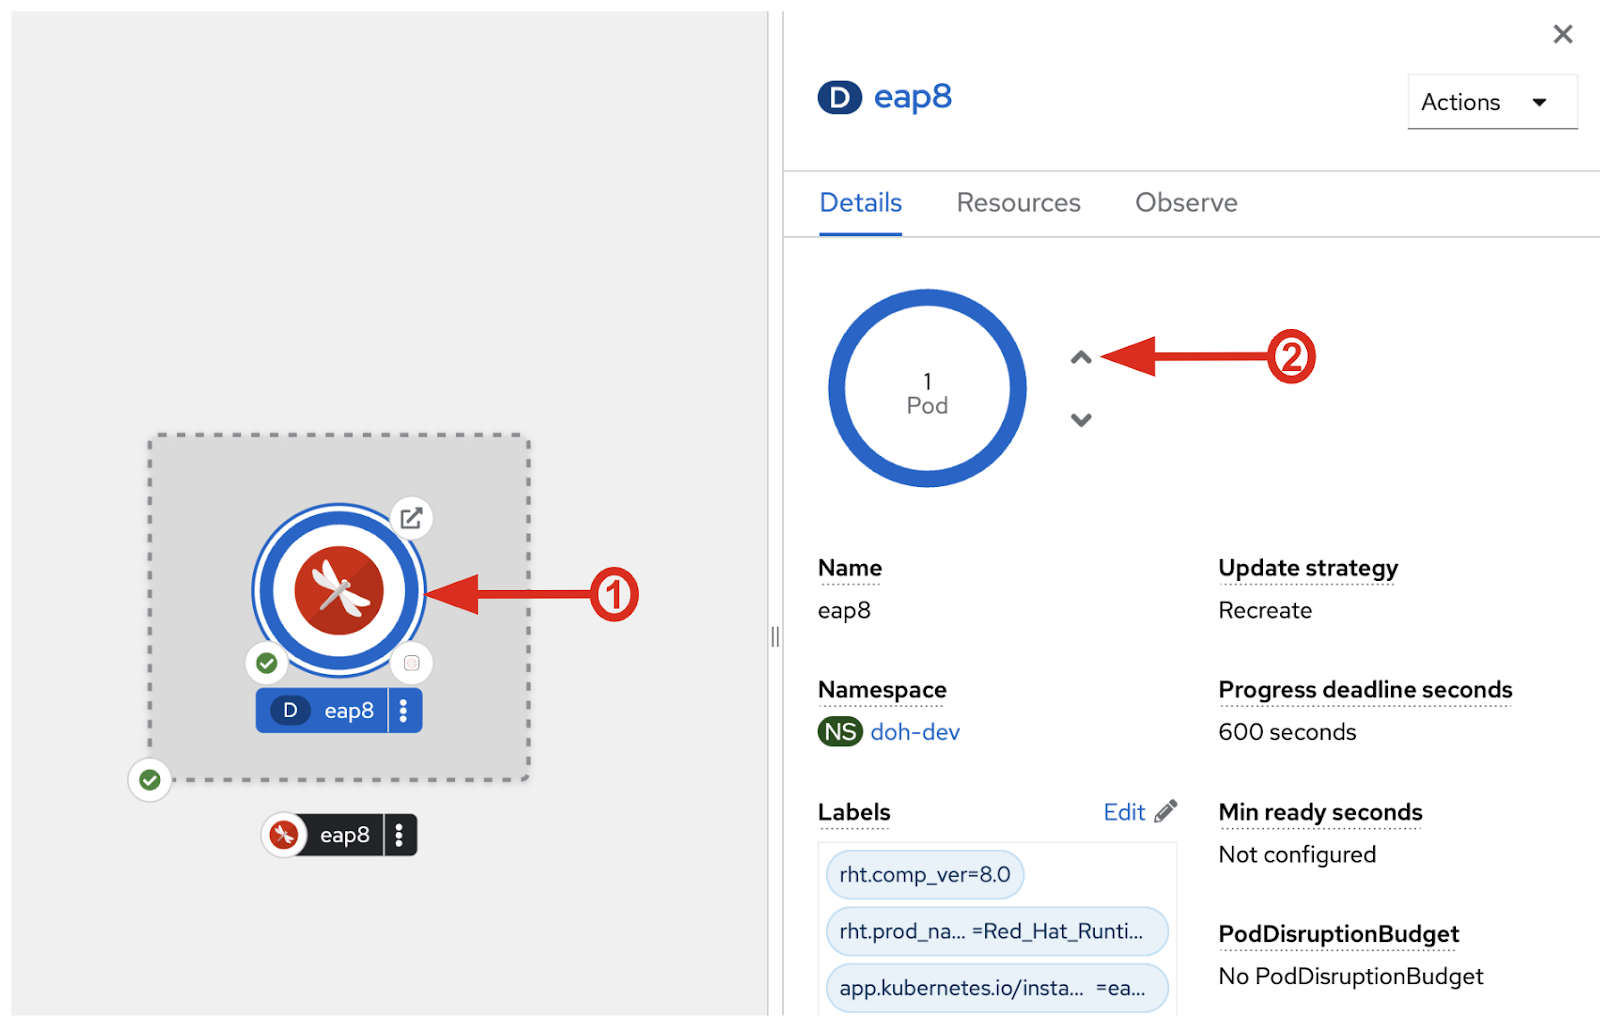
In the Topology view, click the JBoss EAP 8 pod to display the Details tab on the right. You will see up-and-down arrows next to the blue circle Pod image, as shown in Figure 4.

Figure 4: Scale the JBoss EAP 8 pod manually. Click the up arrow twice to increase the JBoss EAP 8 pod from 1 to 3. A few minutes later, you will see 3 JBoss EAP 8 application pods, as shown in Figure 5.
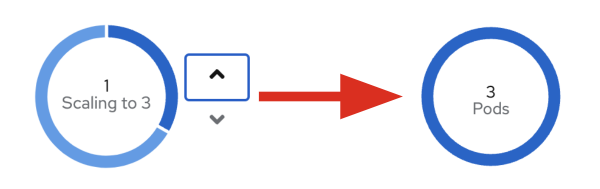
Figure 5: Scaled up to 3 pods manually. Info alert: You can continue to access the front page without any network failure by load balancing automatically via the OpenShift router (HAProxy). The web session across the JBoss EAP servers (pods) can be replicated or distributed automatically while scaling the pods up and down on the OpenShift cluster.
- Make sure to scale down to 1 pod before you move forward to the next step; we’re going to cover how to configure the autoscaling for the JBoss EAP 8 application rather than manually scaling up and down (Figure 6).


Autoscale a modern application for handling high workloads
Now it’s time to learn how to configure the scaling in and out of the JBoss EAP 8 application automatically based on a seasonal high workload. In OpenShift, Horizontal Pod Autoscalers (HPAs) are powerful tools for automatically adjusting the number of pods running for a specific deployment, replica set, or other workload object. They achieve this by constantly monitoring resource metrics (CPU, memory, or custom metrics) and dynamically scaling the pods up or down to maintain a targeted utilization level.
Here are the key benefits of the HPA autoscaling when your cloud admins (or DevOps team) maintain the modern JBoss EAP 8 applications:
- Improved resource utilization: By scaling pods based on actual demand, you avoid over-provisioning resources and optimize your cluster's efficiency.
- Cost savings: Reduced resource usage translates to lower infrastructure costs, especially in cloud environments.
- Enhanced application performance: Autoscaling ensures your applications have the resources they need to handle changing workloads, leading to better responsiveness and stability.
- Automatic scaling: By not relying on manual intervention to adjust pod counts, you save time and effort.
As a best practice, it's crucial to set target utilization levels and scaling parameters carefully to avoid instability or excessive resource churn. Consider exploring custom metrics specific to your application's health and performance for more fine-grained autoscaling control.
To create a new HPA for the running JBoss EAP 8 application, you can run the OpenShift command-line tool (oc autoscale) in the OpenShift web terminal.
Click the shell command icon on the top-left menu (Figure 6).
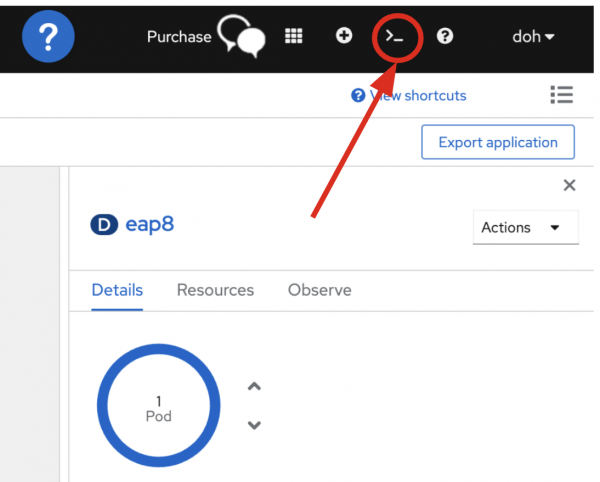
Figure 6: Open a new OpenShift web terminal. - You will see the Bash terminal at the bottom of the screen once the web terminal is created. It normally takes a few minutes to create the resource for the first time. You might encounter a resource limit issue if you’re running multiple pods. In that case, you can run the
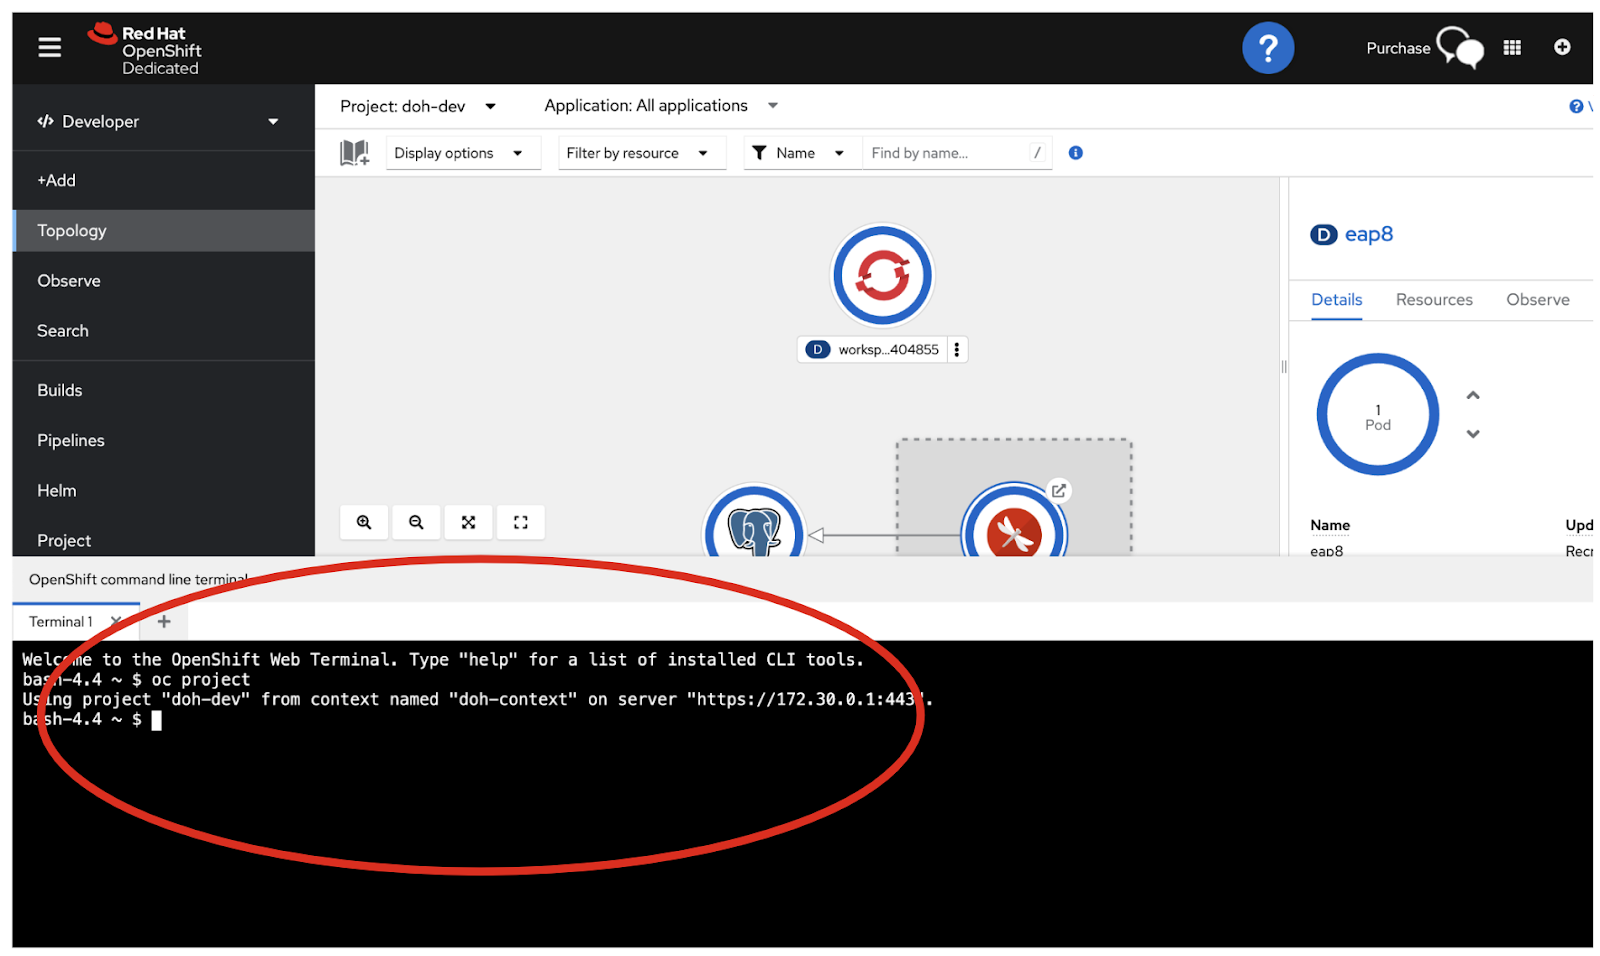
occommand in your local environment instead. Find more information about getting started with the OpenShift CLI. Once the web terminal starts, you can quickly verify if you’re already logged in to the correct project/namespace (e.g.,
xxx-dev). Run the followingoccommand in the web terminal, as shown in Figure 3:$ oc projectThe output should look something like this (Figure 7):
$ Using project "xxx-dev" from context named "xxx-context" on server "https://172.30.0.1:443".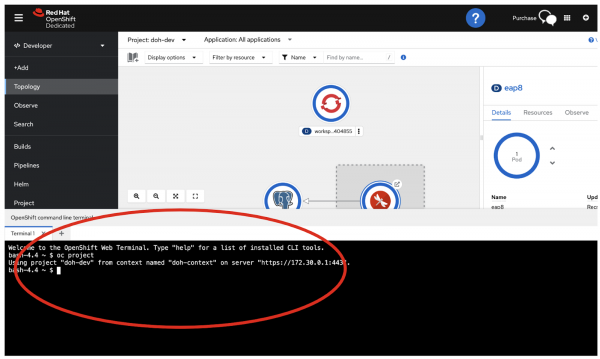
Figure 7: Verify the opening of a new OpenShift web terminal. - The
oc autoscalecommand lets you automatically adjust the number of pods running for the JBoss EAP 8 deployment based on resource metrics (e.g., CPU):--max: Upper limit for the number of pods that can be set by the autoscaler. Required.-
--min: Lower limit for the number of pods that can be set by the autoscaler. If it's not specified or negative, the server will apply a default value. --cpu-percent: Target average CPU utilization (represented as a percent of requested CPU) over all the pods. If it's not specified or negative, a default autoscaling policy will be used.
Run the following command in the web terminal:
$ oc autoscale deployment/eap8 --min=1 --max=10 --cpu-percent=50- Note that the Developer Sandbox sets resource limits for normal users like you (e.g., developers) so you will see the JBoss EAP 8 application scales out in a few seconds right after you create the HPA based on a 50% CPU utilization condition.
The output should be something like this:
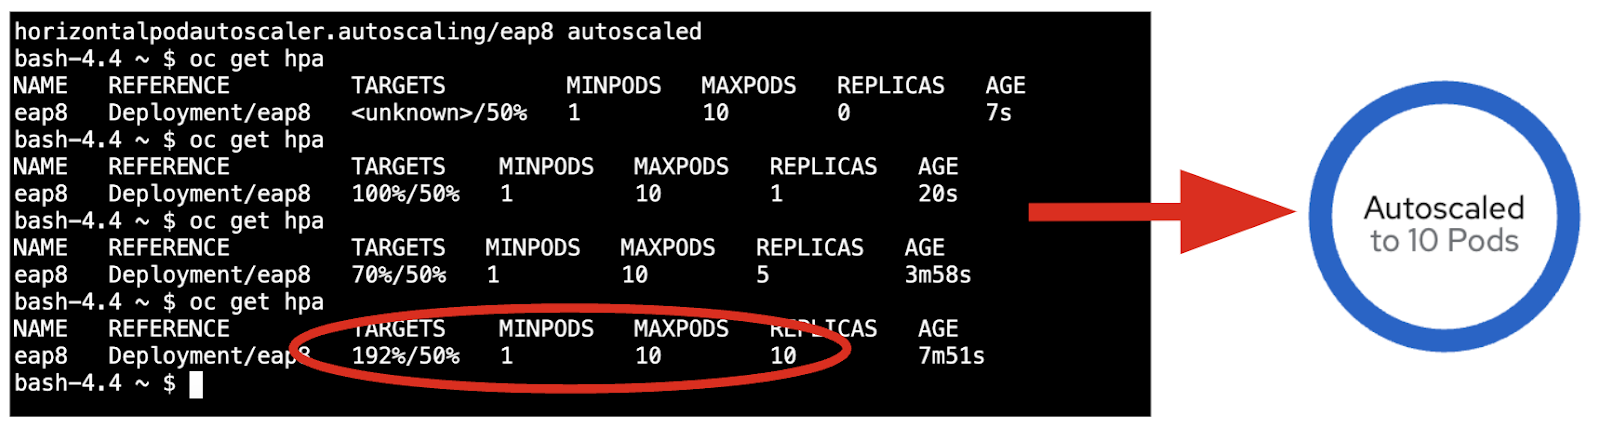
horizontalpodautoscaler.autoscaling/eap8 autoscaledThen, you’ll see that the up and down arrows have disappeared, but “Autoscaled” is marked on the pod. When you run the following
occommand, you can notify how much memory the JBoss EAP 8 pods are currently consuming (Figure 8):$ oc get hpaFor example, 100%/50% triggers to scale out to 2 pods.
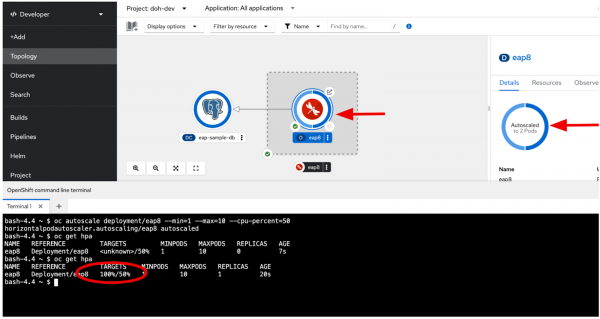
Figure 8: Autoscaling the JBoss EAP 8 Pod. A few minutes later, the replicas will increase to 10 as the maximum limit of the HPA, as shown in Figure 9. Note that you have to set the min/max and CPU percent properly based on the actual workload.

Figure 9: Autoscaled to 10 Pods. If you want to save your resources in the Developer Sandbox after you complete the hands-on experience, you can delete the HPA resource and scale the EAP 8 application down to 1 using the following command:
$ oc delete hpa/eap8
$ oc scale deployment/eap8 --replicas 1


Summary
In this learning path, we walked you through a simple example that shows modern Java application development with Red Hat JBoss Enterprise Application Platform 8 and Red Hat OpenShift Dev Spaces (cloud IDE) for developers.
You learned how to enable the JBoss EAP Helm chart to quickly deploy JBoss EAP 8 applications to a Developer Sandbox for the Red Hat OpenShift cluster.
Finally, we showcased tips and practices on how to observe your JBoss EAP 8 application and set up autoscaling for high workloads.
Want to learn more?
Try these resources: