Welcome to the dashboard in Cryostat 2.3! The Cryostat dashboard is the main page of the Cryostat console. It provides a high-level overview of the connected target JVMs and the instance itself through the use of Dashboard Cards.
The dashboard in earlier versions of Cryostat was limited to just a target selection dropdown. However, with Cryostat 2.3, users can now add Dashboard Cards to display a variety of information about the connected JVMs in easy-to-read charts. Users can create new dashboard layouts easily with Layout Templates and configure the layout of their dashboard with portable Dashboard Layouts, providing a customizable experience.
Dashboard
The Cryostat 2.3 dashboard has been significantly improved with new features that allow users to easily view important information about their target JVMs.
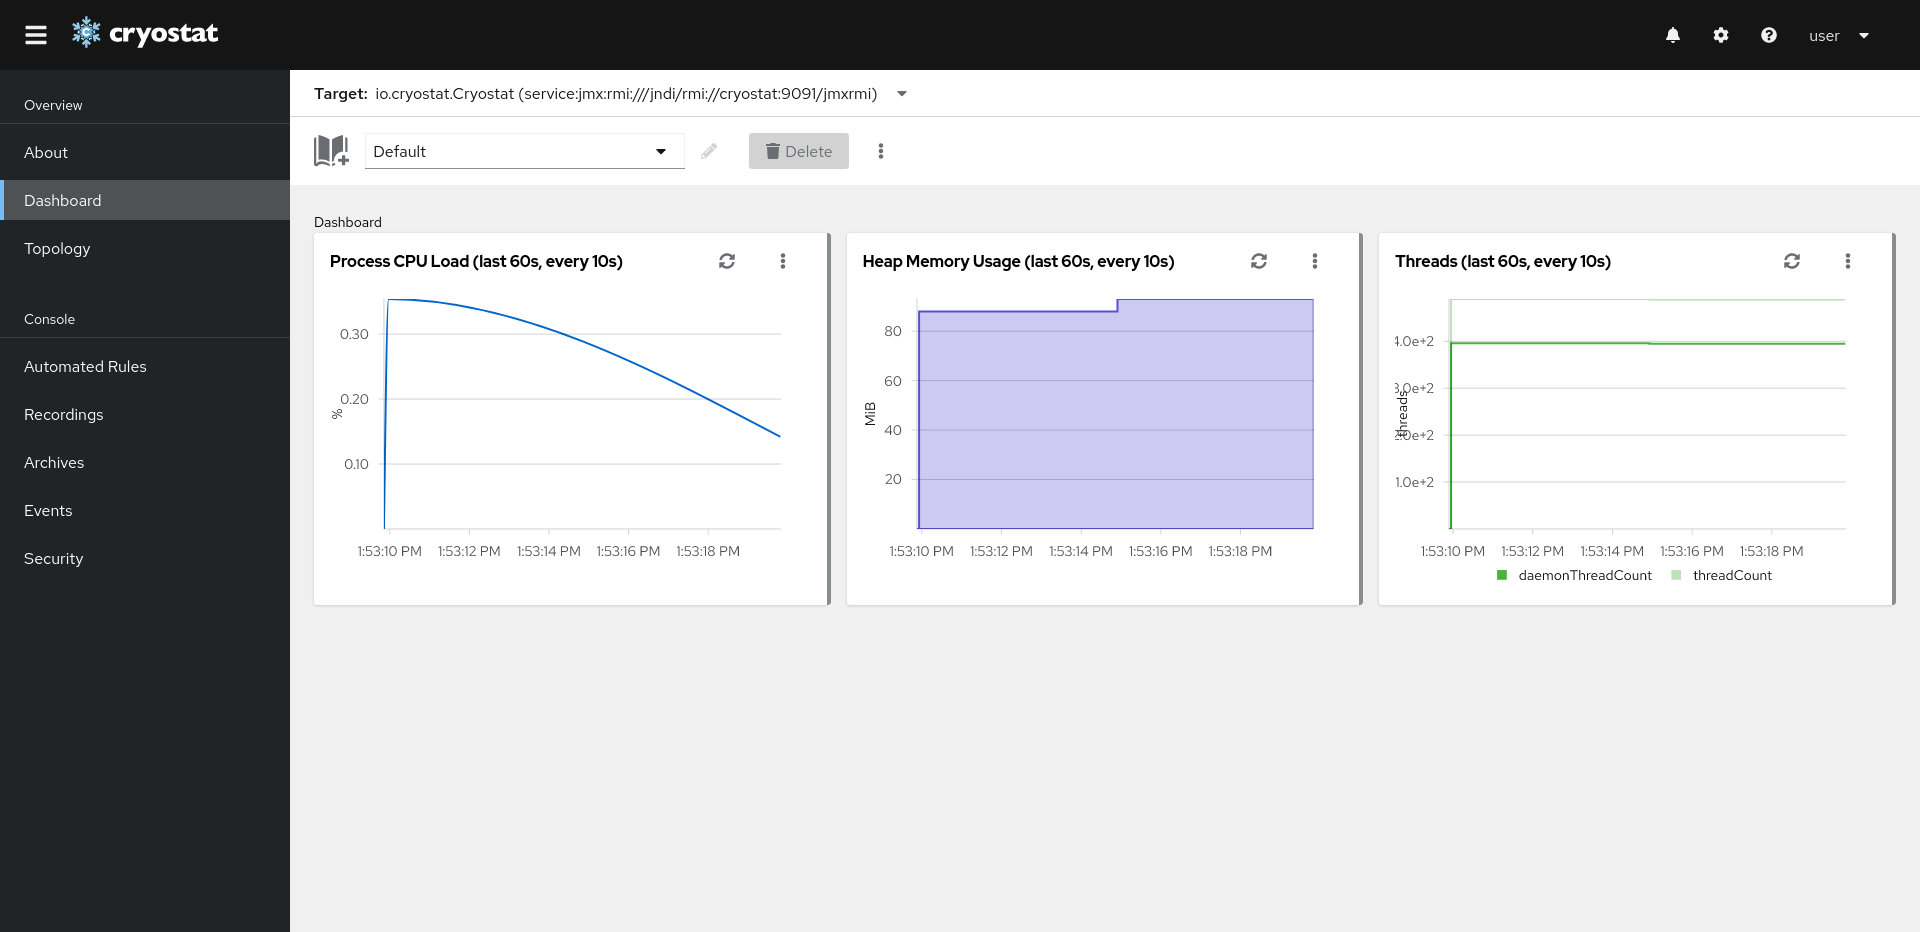
When you first access the web console after installing Cryostat 2.3, you will notice that the dashboard is populated with several charts displayed within the new dashboard cards. These cards provide a quick and easy way to view multiple metrics related to the selected target JVM.
Below the target selector dropdown, you will see a toolbar that includes several items. Let's go into detail about each of these options in-order from left to right:
- Card Catalog: This button allows you to add a new card to the current layout. Clicking it will open a modal that displays a catalog of the different cards currently supported in Cryostat and viewable with your feature level configuration.
- Layout Selector: This dropdown allows you to switch between, rename, delete, and favorite dashboard configurations by selecting user-created Dashboard Layouts. In the dropdown footer, this is where you are able to create new layouts, either from a template, or a blank layout. The template option will open a modal with a list of Cryostat templates, and user-created templates. In the dropdown, you are also able to rename, delete, and favorite layouts that you have created. (Note: you cannot rename or delete the `Default` layout)
- Rename and Delete buttons: The pencil icon simply allows you to rename the currently selected layout. Likewise, the delete button deletes the current layout, and switches the current view to the `Default` layout.
- More options: After clicking more options "⋮", two additional options appear. The first is Set as template. This action allows you to set the current layout as a Layout Template so layouts can be created easily from your current configuration. The second option is Download as template which similarly downloads the current layout as a template. Both options require a name for the template, and an optional description.
Dashboard Cards
There are three production-ready cards in Cryostat 2.3: Target JVM Details card, Automated Analysis card, and the MBean Metrics Chart card. There is 1 beta-ready card which is the JFR Metrics Chart card. Learn more about Feature Flags in Cryostat with the upstream guide post [here](link to upstream website blog post).
Target JVM Details
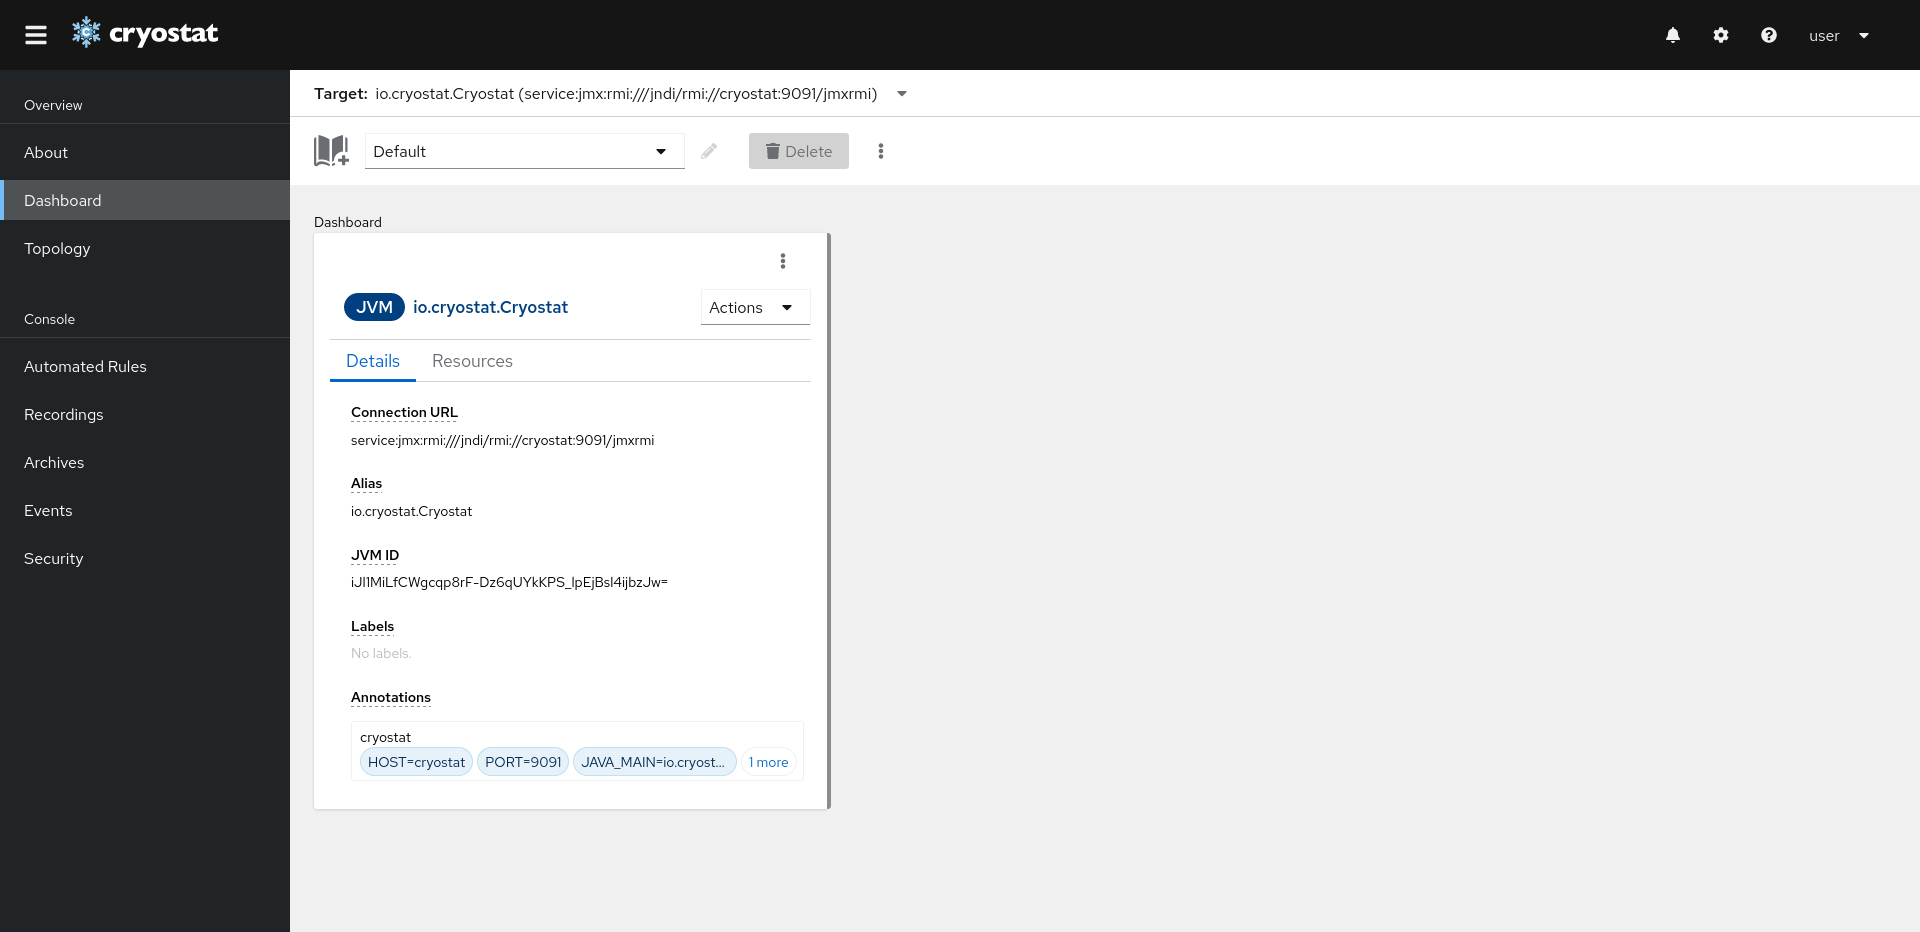
The Target JVM Details card provides a high-level overview of some static information pertaining to the currently selected target JVM. It displays quick JVM information such as the JVM start time, version, vendor, operating system architecture, as well as the number of available processors. The card also contains quick action links to associated recordings, the ability to start a new recording, and the creation of automated rules. Additionally, users can see a quick overview of the resources owned or related to the current target, such as the number of active recordings or the number of automated rules that have matched the current target.
Automated Analysis
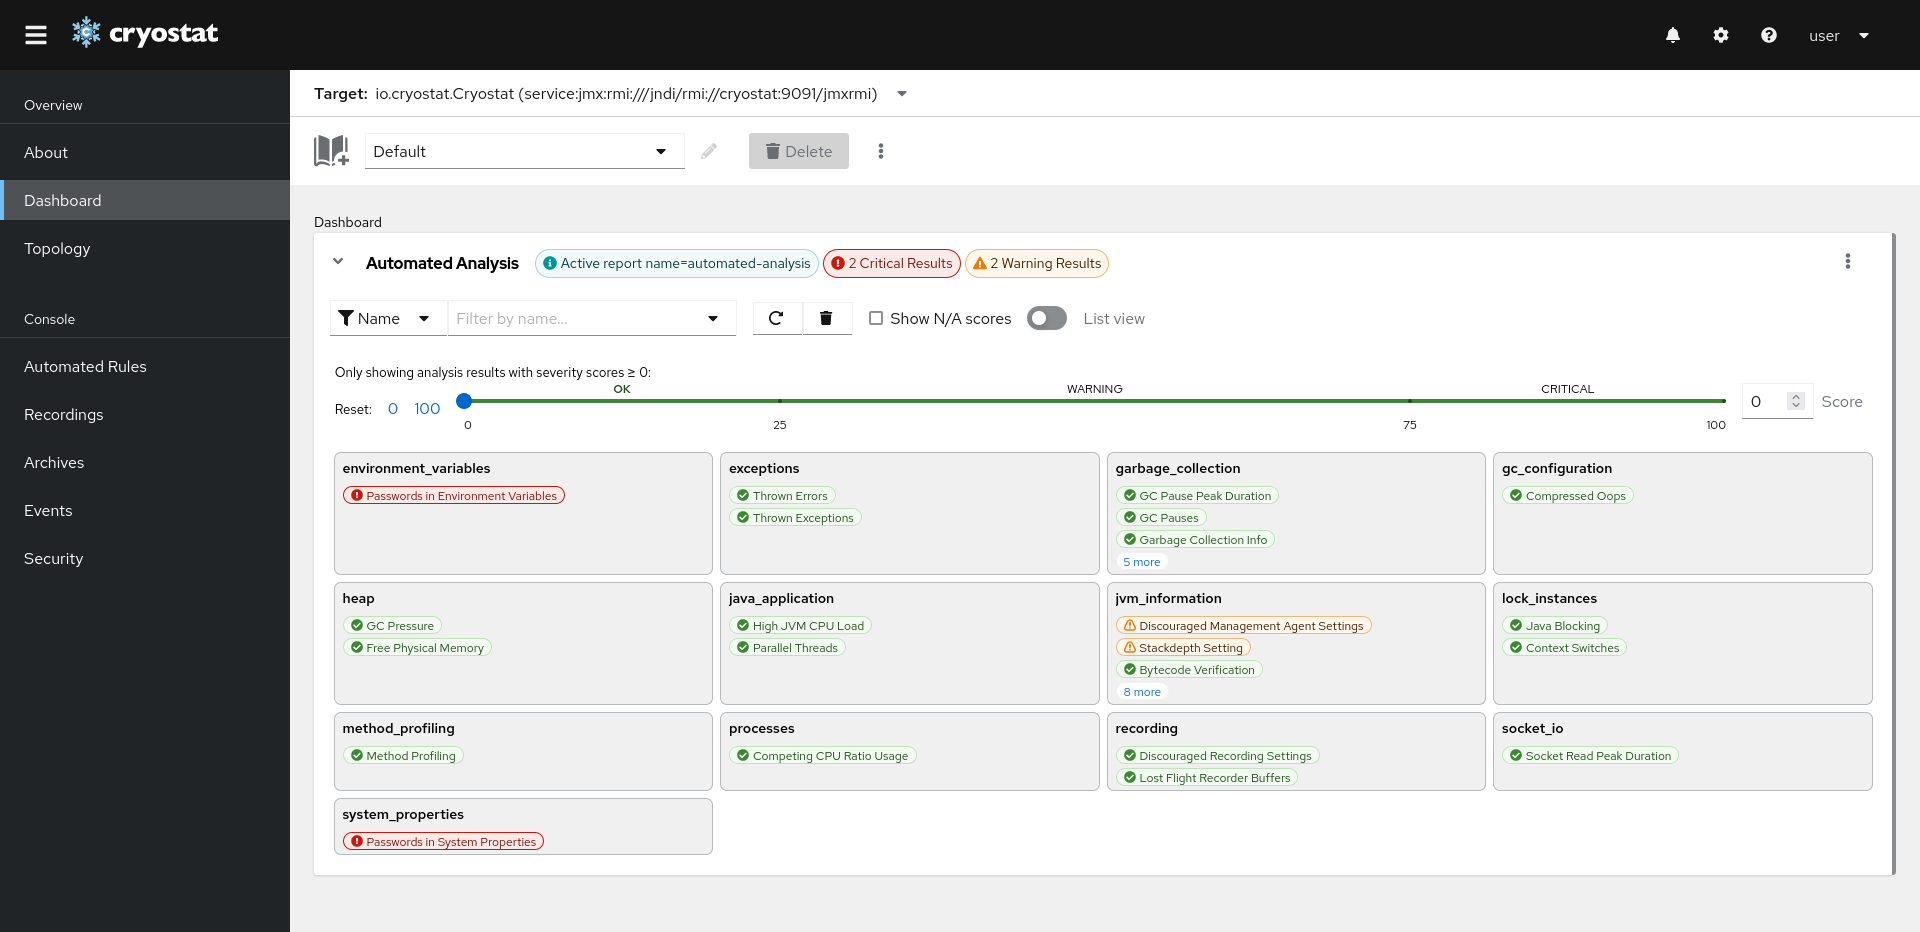
The Automated Analysis card allows users to view Automated Analysis reports in a more user-friendly and accessible way. Automated Analysis is a JDK Mission Control tool that enables users to diagnose issues with their JVMs quickly by inputting a Java flight recording. Cryostat now leverages this tool to generate results and format them into a dashboard card, which is much more convenient than the previous method of displaying results in an HTML document.
MBean Metrics Chart
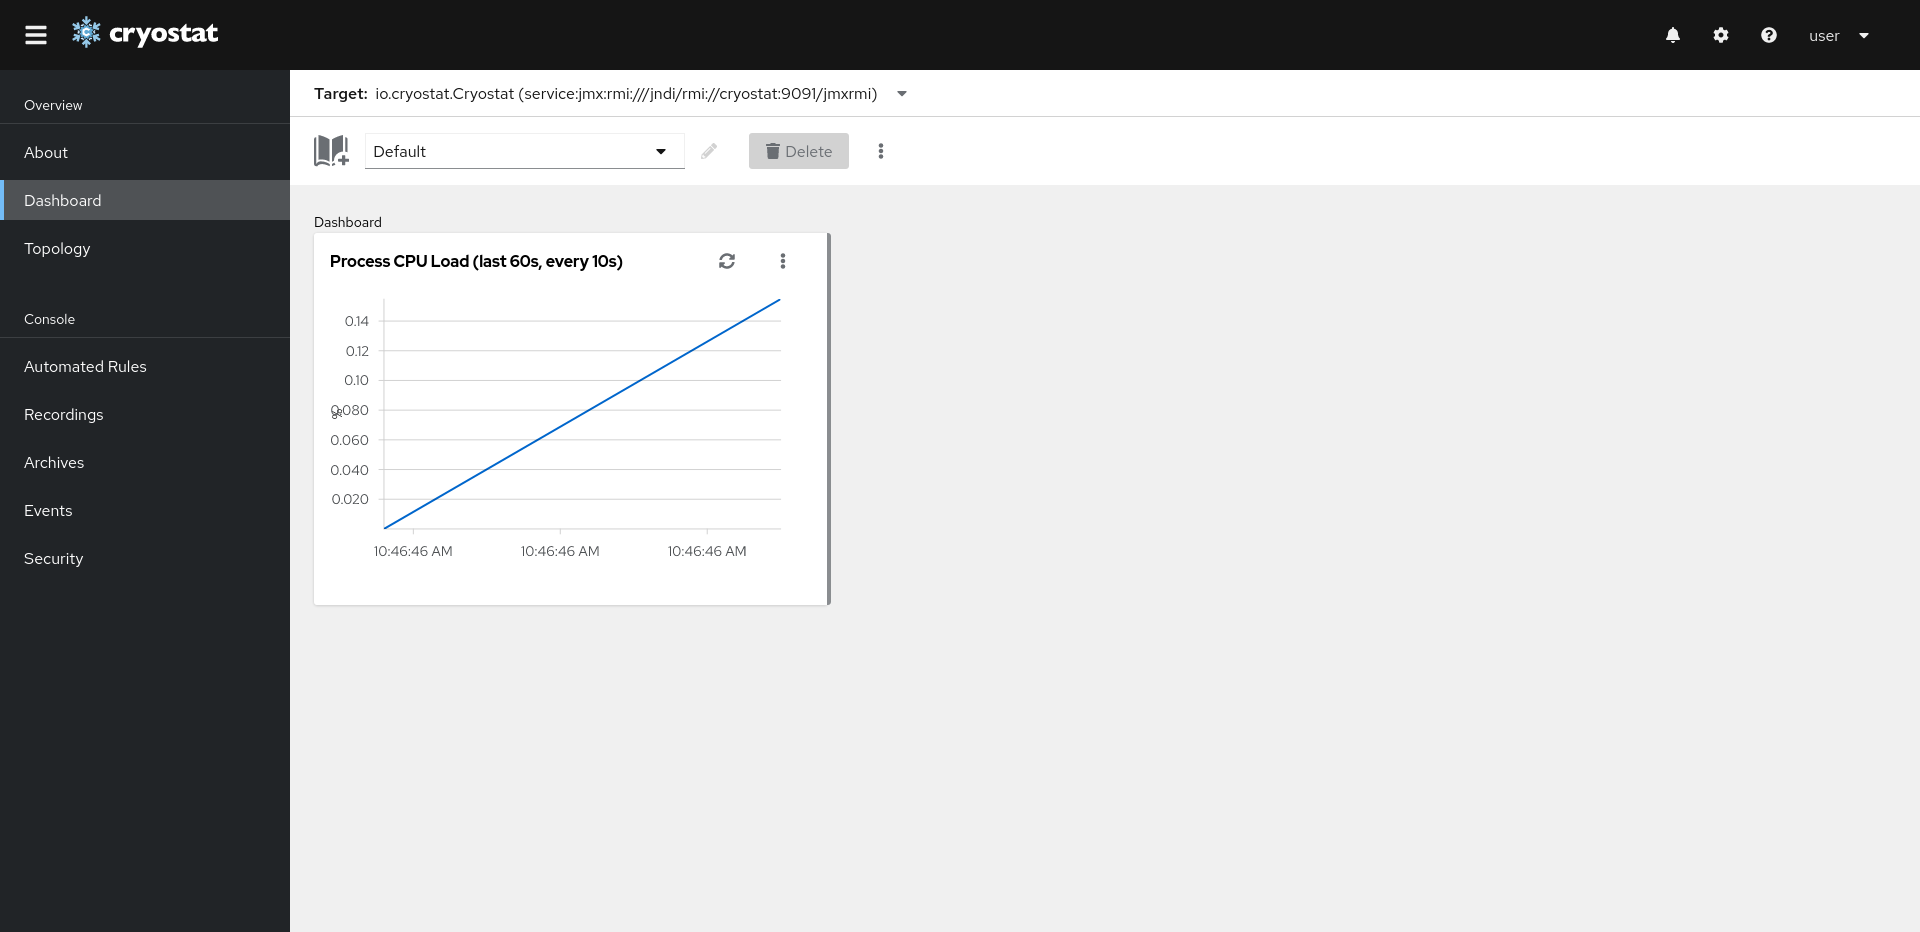
The MBean Metrics Chart card provides users with valuable information about the target JVM through remote access of the JVM's MXBean interfaces, including the Thread, Runtime, OperatingSystem, and Memory MXBeans. Cryostat can retrieve a wide range of useful data from these interfaces and display them in easy-to-read chart cards, such as Heap Memory Usage or the number of Threads, depending on the selected metric during card creation.
JFR Metrics Chart (BETA)
The JFR Metrics Chart card allows users to embed a Grafana chart directly into a Cryostat dashboard card. This card provides access to various JFR metrics and leverages Grafana's capabilities to visualize the data within Cryostat.
However, please note that this card is currently in beta and can only be accessed while under the beta feature level. This is because the jfr-datasource is currently stateful and can only handle one JFR recording input at a time. Therefore, multiple instances of Cryostat web-console may override the JFR metrics data. We are actively working on making these components stateless to ensure that our datasource can handle multiple recordings simultaneously so that this card can be promoted to a PRODUCTION feature in a future release.
Dashboard Layouts
Dashboard Layouts allow you to switch between different card configurations on the fly, making it easier to quickly access and analyze the data that is most relevant to your current needs. With Dashboard Layouts, users can create custom views that highlight specific metrics or areas of interest, and switch between them with just a few clicks. This can help to streamline workflows and improve productivity, as users do not need to modify their dashboard manually every time they want to view different information.
Upon the first installation of Cryostat 2.3 and newer, the Default layout is selected and contains three MBean Metric Chart cards, as an example layout. The Default layout can be edited to change its card configuration, but cannot be renamed or deleted.
Layout Templates
With Layout Templates in Cryostat 2.3, users can easily import and export dashboard layouts to share with others or to use on different systems. This provides a quick and efficient way to ensure that different teams or individuals have access to the same set of metrics and visualizations, without the need for individual customization.
Conclusion
Cryostat 2.3's updated dashboard provides users with a more flexible and user-friendly tool for monitoring and analyzing Java applications. With the ability to add dashboard cards, create custom layouts, and view static and dynamic information about connected JVMs, users can quickly identify and resolve performance issues, improve system efficiency, and optimize application performance for their containerized Java applications.