Red Hat Process Automation Manager is a platform for developing containerized microservices and applications that automate business decisions and processes. Combining process- and task-level SLA metrics plus case-related breakdowns can be beneficial for identifying trends and reorganizing the workforce as necessary. So, a critical piece of a business process system is having real-time insights into what is happening, and both monitoring KPI metrics and responding to problem trends is an integral part of operations.
Integration with Elasticsearch improves our search capabilities and provides a unified reporting environment for the business. Maciej Swiderski blogged about how we can potentially use Elasticsearch to capture KPI metrics and provide for full-text search capabilities. This article extends the idea and walks through how to enable integration with Elasticsearch on a Red Hat OpenShift environment, and how to represent the KPIs in a graphical business-friendly dashboard using Kibana.
Preparing the demo environment
Let’s install the necessary components for this demonstration on Red Hat OpenShift, which enables efficient container orchestration and allows rapid container provisioning, deployment, scaling, and management.
Setting up Elastic and Kibana
Let's make use of the Elastic cluster Operator to set up Elastic/Kibana on OpenShift:
$ oc apply -f https://download.elastic.co/downloads/eck/1.0.1/all-in-one.yaml
$ oc new-project elastic
Now, we can deploy an Elastic instance:
$ cat <<EOF | oc apply -n elastic -f -
# This sample sets up an Elasticsearch cluster with an OpenShift route
apiVersion: elasticsearch.k8s.elastic.co/v1
kind: Elasticsearch
metadata:
  name: elasticsearch-sample
spec:
  version: 7.6.2
  nodeSets:
  - name: default
    count: 1
    config:
      node.master: true
      node.data: true
      node.ingest: true
      node.store.allow_mmap: false
---

apiVersion: route.openshift.io/v1
kind: Route
metadata:
  name: elasticsearch-sample
spec:
  #host: elasticsearch.example.com # override if you don't want to use the host that is automatically generated by OpenShift (<route-name>[-<namespace>].<suffix>)
  tls:
    termination: passthrough # Elasticsearch is the TLS endpoint
    insecureEdgeTerminationPolicy: Redirect
  to:
    kind: Service
    name: elasticsearch-sample-es-http
EOF
Next, let us deploy a Kibana instance:
$ cat <<EOF | oc apply -n elastic -f -
apiVersion: kibana.k8s.elastic.co/v1
kind: Kibana
metadata:
  name: kibana-sample
spec:
  version: 7.6.2
  count: 1
  elasticsearchRef:
    name: "elasticsearch-sample"
  podTemplate:
    spec:
      containers:
      - name: kibana
        resources:
          limits:
            memory: 1Gi
            cpu: 1
---
apiVersion: v1
kind: Route
metadata:
  name: kibana-sample
spec:
  #host: kibana.example.com # override if you don't want to use the host that is automatically generated by OpenShift (<route-name>[-<namespace>].<suffix>)
  tls:
    termination: passthrough # Kibana is the TLS endpoint
    insecureEdgeTerminationPolicy: Redirect
  to:
    kind: Service
    name: kibana-sample-kb-http
EOF
We can now access the Kibana dashboard from the route exposed:
$ oc get route -n elastic
The credentials for logging into Kibana can be found under Secrets for the Elastic project, as shown in Figure 1.

Setting up the Elasticsearch event emitter
The event emitter integration code is a single Java class that implements the EventEmitter interface. A basic implementation of the emitter can be found here. By default process, task, and case metrics are pushed on to the corresponding indexes on Elastic:
if (view instanceof ProcessInstanceView) {
    index = "processes";
    type = "process";
    id = ((ProcessInstanceView) view).getCompositeId();
} else if (view instanceof TaskInstanceView) {
    index = "tasks";
    type = "task";
    id = ((TaskInstanceView) view).getCompositeId();
} else if (view instanceof CaseInstanceView) {
    index = "cases";
    type = "case";
    id = ((CaseInstanceView) view).getCompositeId();
}
content.append("{ \"index\" : { \"_index\" : \"" + index + "\", \"_type\" : \"" + type + "\", \"_id\" : \"" + id + "\" } }\n");
content.append(json);
We can now extend this basic implementation and allow for HTTPS authentication because the Elastic instance on OpenShift is exposed over HTTPS:
protected CloseableHttpClient buildClient() throws Exception{
   HttpClientBuilder builder = HttpClients.custom();
   if (elasticSearchUser != null && elasticSearchPassword != null) {
       SSLContextBuilder builder1 = new SSLContextBuilder();
       builder1.loadTrustMaterial(null, new TrustStrategy() {
           @Override
           public boolean isTrusted(X509Certificate[] chain, String authType) throws CertificateException {
               return true;
           }
       });
       CredentialsProvider provider = new BasicCredentialsProvider();
       UsernamePasswordCredentials credentials = new UsernamePasswordCredentials(elasticSearchUser, elasticSearchPassword);
       provider.setCredentials(AuthScope.ANY, credentials);
       SSLConnectionSocketFactory sslConnectionSocketFactory = new SSLConnectionSocketFactory(builder1.build(), new NoopHostnameVerifier());
       builder.setDefaultCredentialsProvider(provider);
       builder.setSSLSocketFactory(sslConnectionSocketFactory).build();
   }
   return builder.build();
}
Please note that for the purpose of this demonstration, we bypassed the certificate check and used the basic authentication mechanism. For a production use case, it is necessary to authenticate with a valid certificate.
We can now build a custom Docker image with the event emitter JAR on the KIE server war’s classpath:
FROM docker-registry.default.svc:5000/openshift/rhpam-kieserver-rhel8:7.5.0
COPY contrib/jbpm-event-emitters-elasticsearch-7.36.0-SNAPSHOT.jar /opt/eap/standalone/deployments/ROOT.war/WEB-INF/lib/jbpm-event-emitters-elasticsearch-7.36.0-SNAPSHOT.jar
USER root
RUN chownjboss:root /opt/eap/standalone/deployments/ROOT.war/WEB-INF/lib/jbpm-event-emitters-elasticsearch-7.36.0-SNAPSHOT.jar && \
chmod 664 /opt/eap/standalone/deployments/ROOT.war/WEB-INF/lib/jbpm-event-emitters-elasticsearch-7.36.0-SNAPSHOT.jar
USER jboss
We also need to pass the corresponding metadata for the Elastic cluster using the JAVA_OPTS Kie Server property:
$ oc set env dc/{{ pam_app_name }}-kieserver JAVA_OPTS_APPEND=>\"-Dorg.jbpm.event.emitters.elasticsearch.url=https://{{routeelastic.stdout}} -Dorg.jbpm.event.emitters.elasticsearch.user=elastic -Dorg.jbpm.event.emitters.elasticsearch.password={{elasticpwd.stdout}}\" -n {{ OCP_PROJECT }}Business activity monitoring
Now that we are done with the setup, let us quickly look at to visualize the process, task, and case metrics using Kibana. Let us begin by logging into Business Central and pulling a project from the Try Samples section, as shown in Figures 2 and 3.


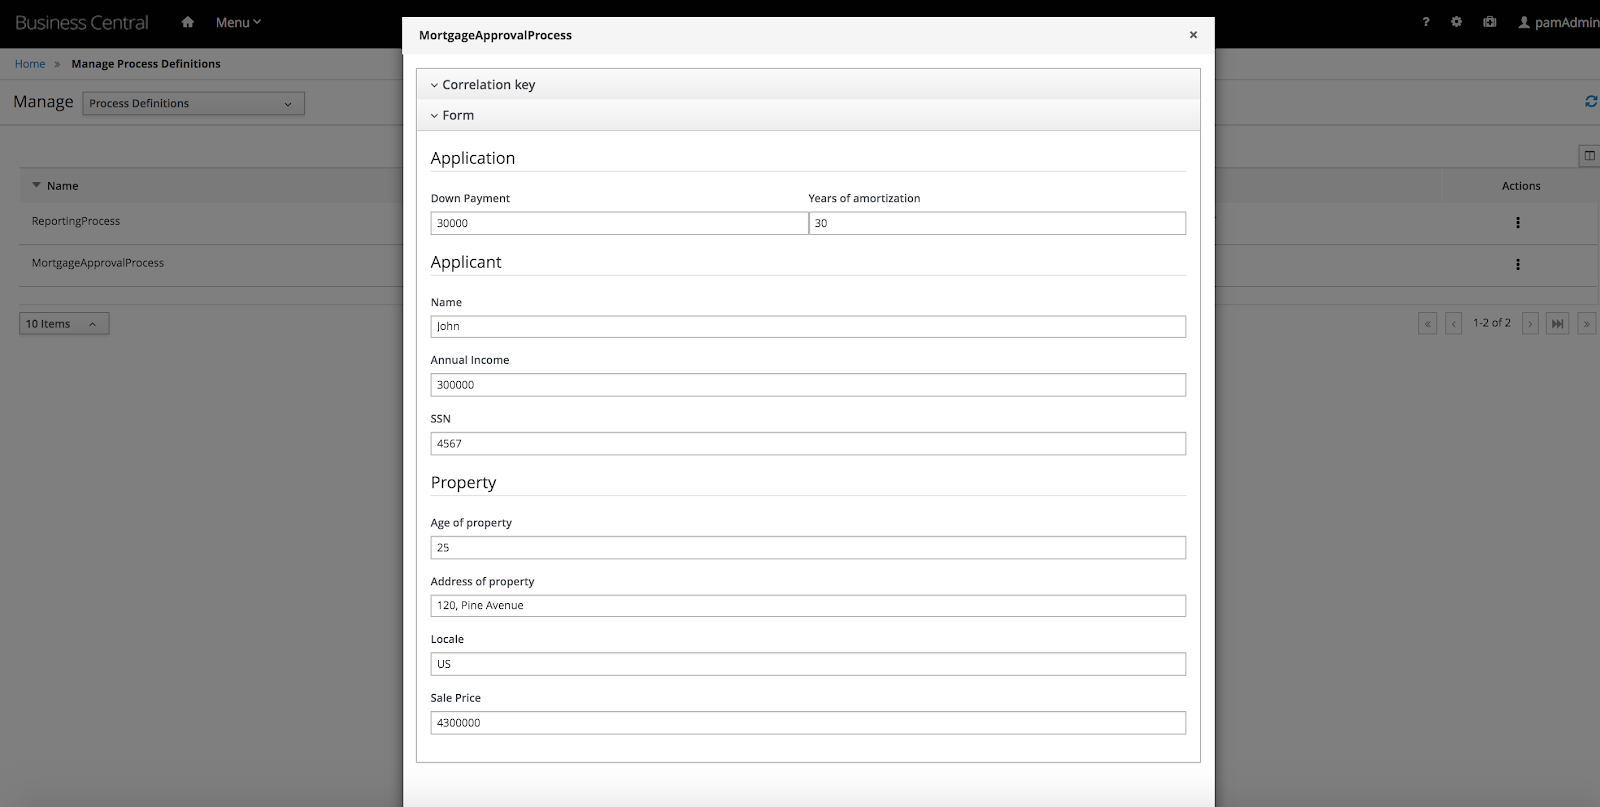
For this example, we will build and deploy the Mortgage_Process project. We will use this project for metrics visualization. Let us now kickstart a process using the process start form:
The process is created, as shown in Figure 5.

Now, log into the Kibana dashboard. We will start with a basic visualization for both processes and tasks. Kibana templates provide an exportable JSON format for sharing graphical reports across instances of Kibana. A sample template can be found here. Import the template from the Kibana dashboard's Saved Objects section, under the Management option.
We now have a sample dashboard available for processes (Figure 6) and tasks (Figure 7).


As these tasks are worked on and the processes head to completion, their status and updates are pushed to Elastic, as shown in Figure 8.

Now let us create custom metrics from the process data. We can assume that we need to filter out the cases where property price is over 2 million and property age is less than 25 years. Kibana provides a convenient way to create full-text searches and then lets us convert the result to a visualization.
Open the raw data section of Kibana and create a custom query to filter out the data, as shown in Figure 9.

We can easily convert this data into a visualization by saving this search and creating a bar chart out of it, as shown in Figures 10 and 11.


Similar visualizations can be created for cases, too. A sample case visualization using KPI metrics for the case can be set up as shown in Figure 12.

A complete example of the setup can be found here.
Summary
By setting up an integration with Elasticsearch, we can visualize data from the business automation engine side-by-side with the metrics from other disparate systems. Doing this also provides for faster, more scalable, business-friendly visualizations fit for operations management.
