The latest release of OpenShift Connector enhances the developer experience on Red Hat OpenShift with support for local code debugging. This enhancement lets the user write and debug local code without leaving the editor.
Based on developer community feedback related to OpenShift Connector for Visual Studio Code (VS Code), one of the main focuses was to simplify the OpenShift workflow for developers by letting them debug code that is deployed on OpenShift directly from VS Code. Visual Studio Code's debugging architecture allows extension authors to easily integrate existing debuggers into VS Code while offering a common user interface for all of them.
Following this principle, we added a new debug feature to our OpenShift extension for VS Code. This feature allows debugging local NodeJS and Java components deployed on an OpenShift instance directly from the IDE.
This feature is available to the community from version 0.1.3 onwards and the extension can be installed from the VS Code Marketplace.
How does it work?
This release provides the new OpenShift: Debug command, which provides a simpler way to start debugging OpenShift components pushed to a cluster.
OpenShift: Debug is an experimental feature that uses the experimental OpenShift Do (odo) debug command under the hood. This enhancement allows developers to set breakpoints directly in the source code, watch variables, and follow the full call stack when debugging—all without leaving the editor.
Note: The debug feature is supported only for components created using local workspace and deployed on OpenShift. Components created using Git Repository and Binary File are not supported.
The debug command can be invoked in following ways:
- Using the Command Palette [OpenShift: Debug] (Figure 1)

Figure 1: Accessing the OpenShift: Debug command through the command palette.">
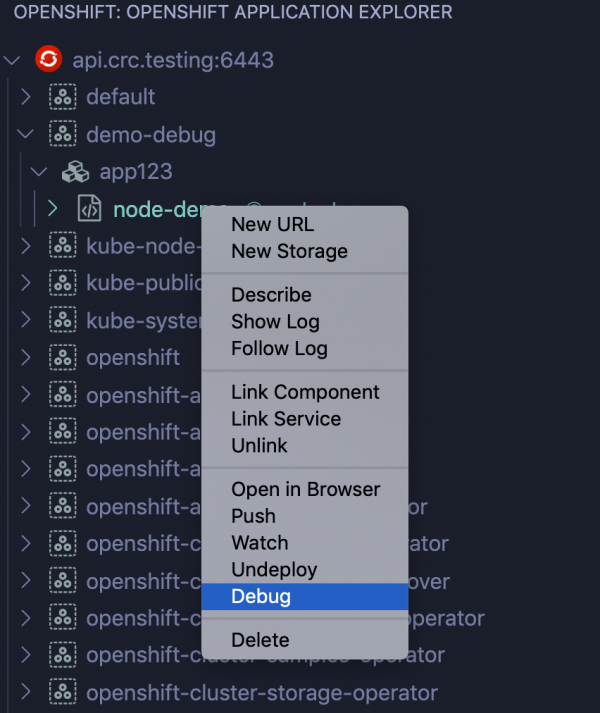
2. Using OpenShift Application Explorer view. User needs to go to the context menu for component nodes and select Debug action as shown in Figure 2.

Figure 2: Accessing the OpenShift: Debug command through the OpenShift Application Explorer view.">
Debug a NodeJS component in OpenShift
The default Visual Studio Code installation includes JavaScript/TypeScript language support and the debugger extensions required to debug a NodeJS component. That means that the new OpenShift: Debug command can be used without installing any additional extensions. To get started:
- Install OpenShift Connector from the marketplace or from the Extensions icon in VS Code.
- Log into the running OpenShift cluster.
- Create a NodeJS component from the local workspace and deploy it in OpenShift.
- Perform the debugging actions as shown in the video below, which shows a detailed walk-through of the workflow for debugging a local NodeJS component on OpenShift:
https://developers.redhat.com/media/119201
Debug a Java component in OpenShift
To debug a Java component, the Java Language Support and Java Debugger extensions are required. Therefore, the OpenShift Connector extension will prompt you to install the missing extension(s) before launching the debugger for a Java component. To get started:
- Install OpenShift Connector from the marketplace or from the Extensions icon in VS Code.
- Log into the running OpenShift cluster.
- Create a Java component from the local workspace and deploy it in OpenShift.
- Perform the debugging actions as shown in the video below, which shows a detailed walk-through of the workflow for debugging a local Java component on OpenShift:
https://developers.redhat.com/media/119191
Feedback
We’ve released this extension on GitHub as an MIT-licensed open source project, and the extension is available in the VS Code Marketplace. We really want your feedback and help to build an even better debugging experience. If you have any issues or ideas for improvements, feel free to reach out to us on Gitter or GitHub.
Look out for more awesome features in the next releases!
Last updated: February 5, 2024