The Quarkus is an open source framework designed to help software developers build efficient cloud-native applications tailored to their architectural preferences, while ensuring development joy. Efficient resource utilization, particularly in terms of memory and CPU, has been a key requirement since its creation, allowing fast startup and response times with low memory consumption. This article briefly explains how Quarkus works with the OpenTelemetry and the steps to deploy an observable service on OpenShift.
Applications developed with Quarkus can follow a variety of paradigms, such as Kubernetes-native, serverless, microservices, monolithic architectures, command-line applications, etc. Experience developer joy by enabling the creation of cloud-native applications quickly and efficiently. Quarkus provides a combination of tools, libraries, extensions, and one of the key features is the Dev Mode with live code reload.
OpenTelemetry
One of the observability related extensions Quarkus provides is quarkus-opentelemetry. OpenTelemetry is an open source framework designed to standardize the collection, processing, and export of telemetry signal data such as traces, metrics, and logs from applications and infrastructure. It helps developers and operators monitor, troubleshoot, and optimize their systems by providing a consistent way to capture and analyze operational data across diverse environments, platforms, and programming languages.
The extension provides OpenTelemetry support for applications without a Java agent and enables telemetry generation in native mode when building and running the application as a native binary executable, using GraalVM to compile ahead of time (AOT) into a platform-specific binary.
By default, only the tracing is enabled, but you can switch on the other signals by setting the following build time properties in the application.properties file:
quarkus.otel.metrics.enabled=true
quarkus.otel.logs.enabled=true
For context, automatic metrics instrumentation in Quarkus has been performed for quite some time with the quarkus-micrometer extension. To provide a unified experience, the quarkus-micrometer-opentelemetry extension was recently created to provide all the OpenTelemetry signals turned on plus all Micromenter metrics. The data output is unified and performed using the OTLP protocol.
Deploying the application
The quarkus-observability-openshift application is a single service developed with Quarkus featuring REST endpoints for create, read, update, and delete (CRUD) operations on a PostgreSQL database. We are managing the Vegie entity with Hibernate ORM, and we use Jackson serialization for the data transfer objects (DTOs) in the REST interface.
We will build the service into a Docker image and then deploy in Red Hat OpenShift.
The application will automatically produce telemetry for all REST endpoints using OpenTelemetry traces, metrics, and logs.
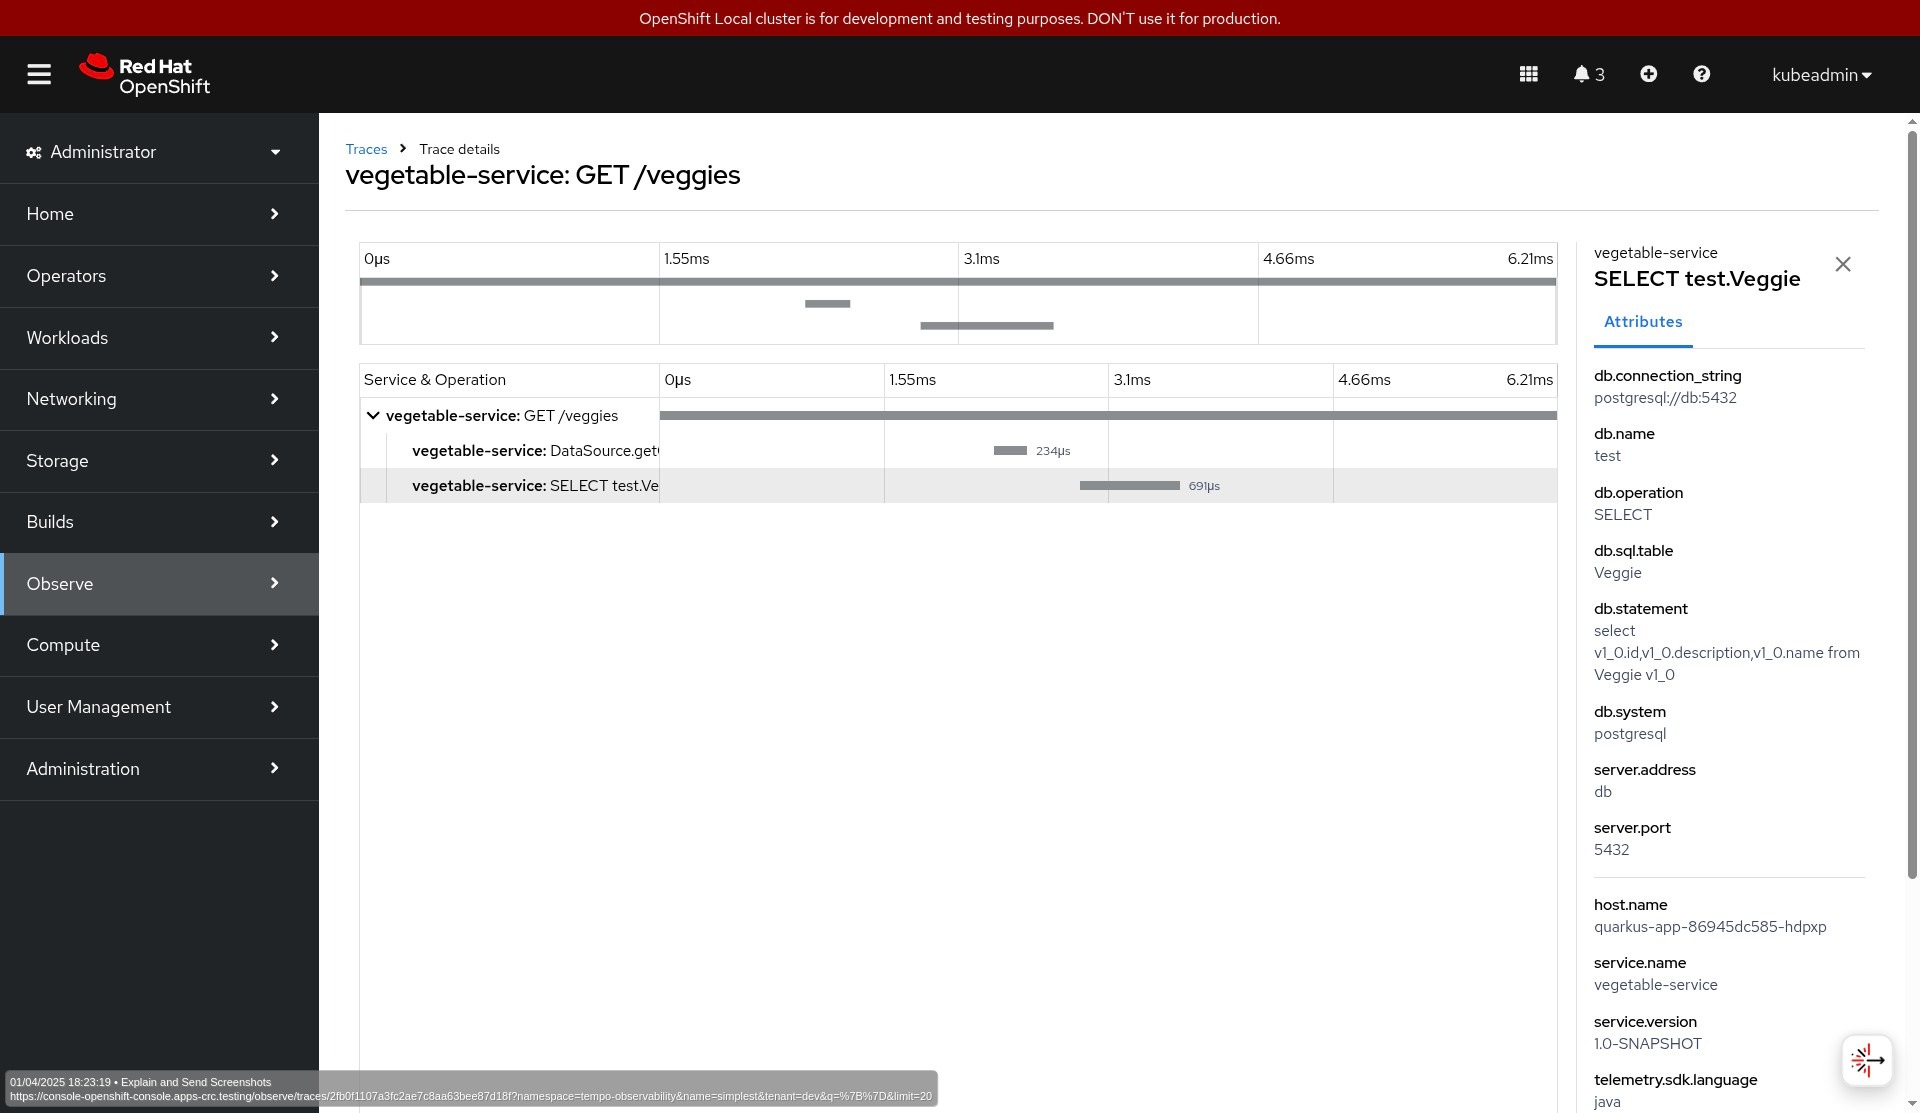
Tracing
Each request to the service will generate 1 trace with 2 spans: the first one automatically generated by the REST server and the second span for the Java Database Connectivity (JDBC) queries sent to the database.
You must explicitly activate this last one by setting the following property in the application.properties file:
quarkus.datasource.jdbc.telemetry=trueEach database-related span will include the execution time and a set of attributes to describe the performed SQL query.
The span for HTTP request includes attributes describing the route, operation, method used, and the response status code, among others.
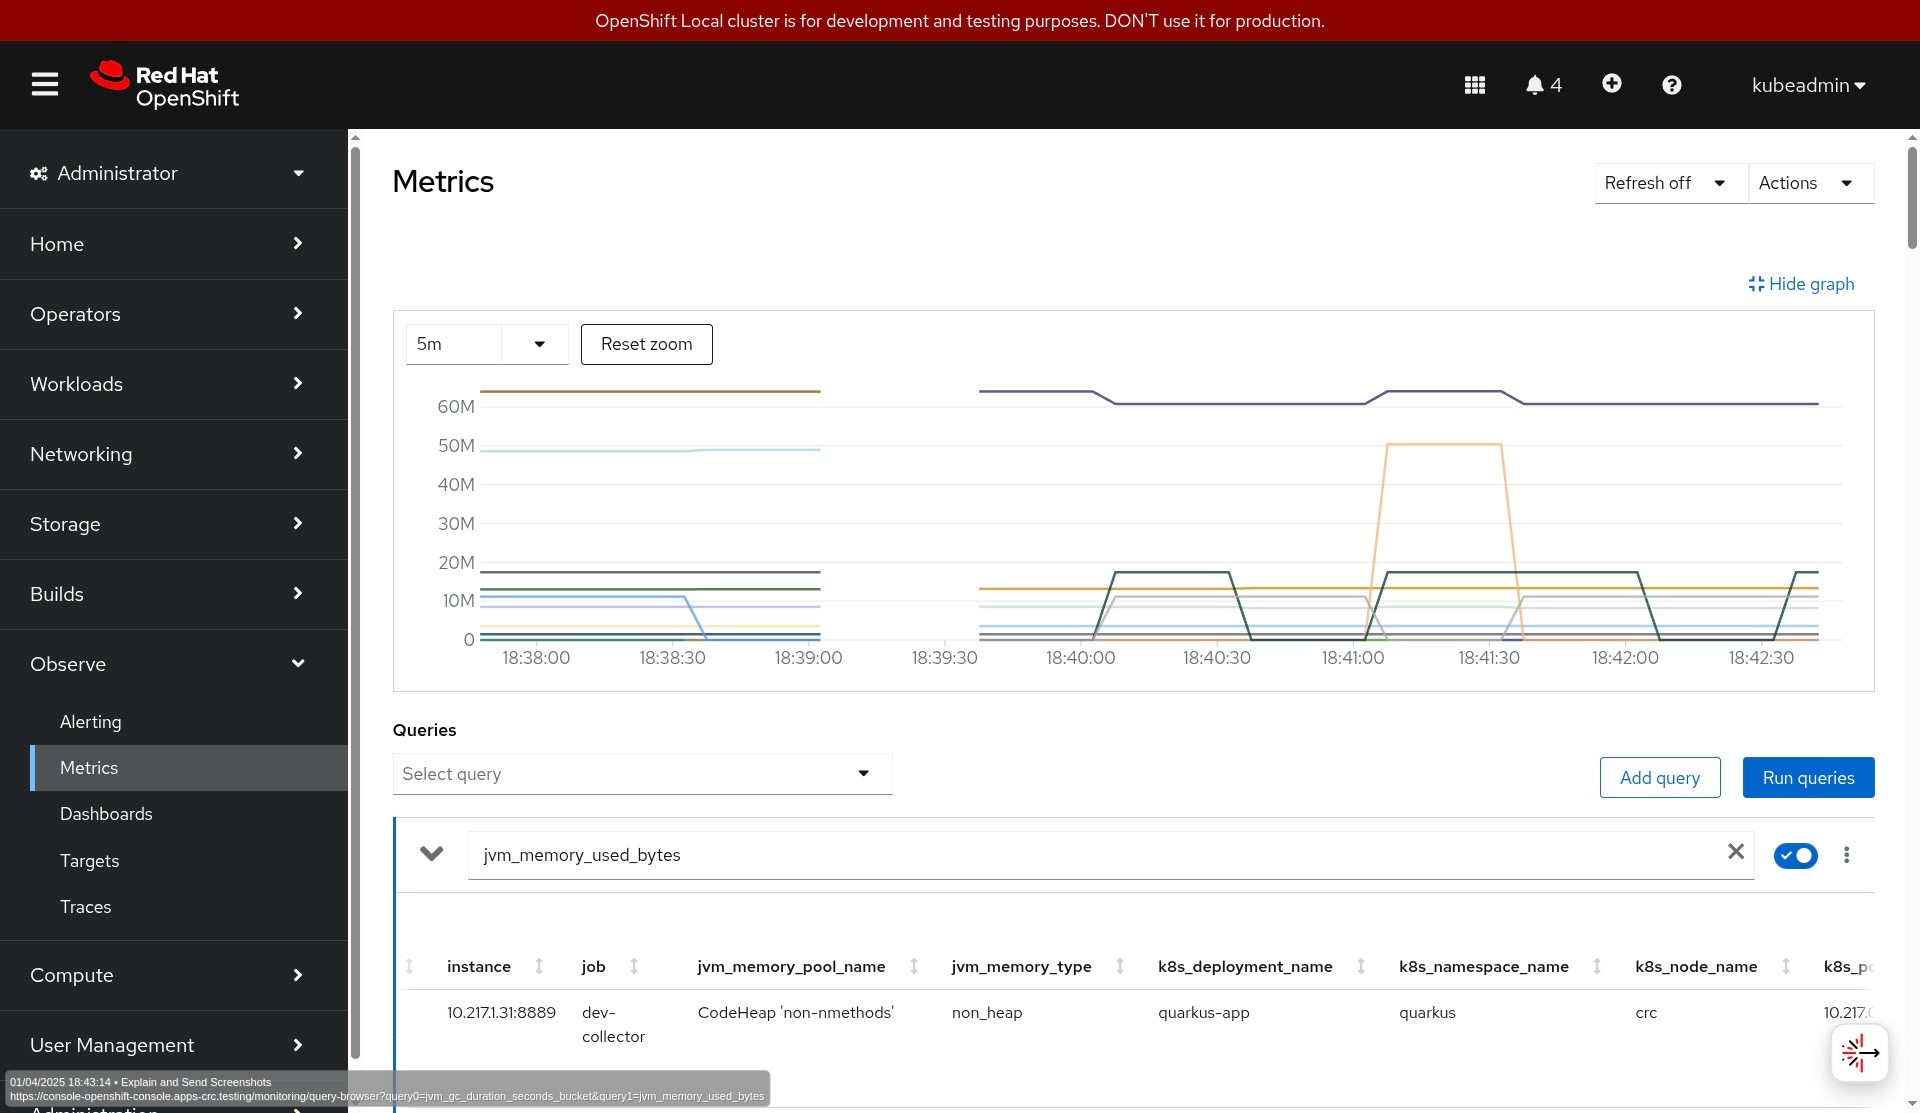
Metrics
The automatic metrics instrumentation will only provide HTTP and Java Virtual Machine (JVM) metrics according to the Microprofile Telemetry 2.0 specification, which defines how Microprofile-compliant applications should interact with OpenTelemetry regarding tracing, metrics, and logs.
Note that the complete set of automated metrics in Quarkus is implemented with micrometer. You can retrieve them by using a quarkus-micrometer registry or the quarkus-micrometer-opentelemetry extension.
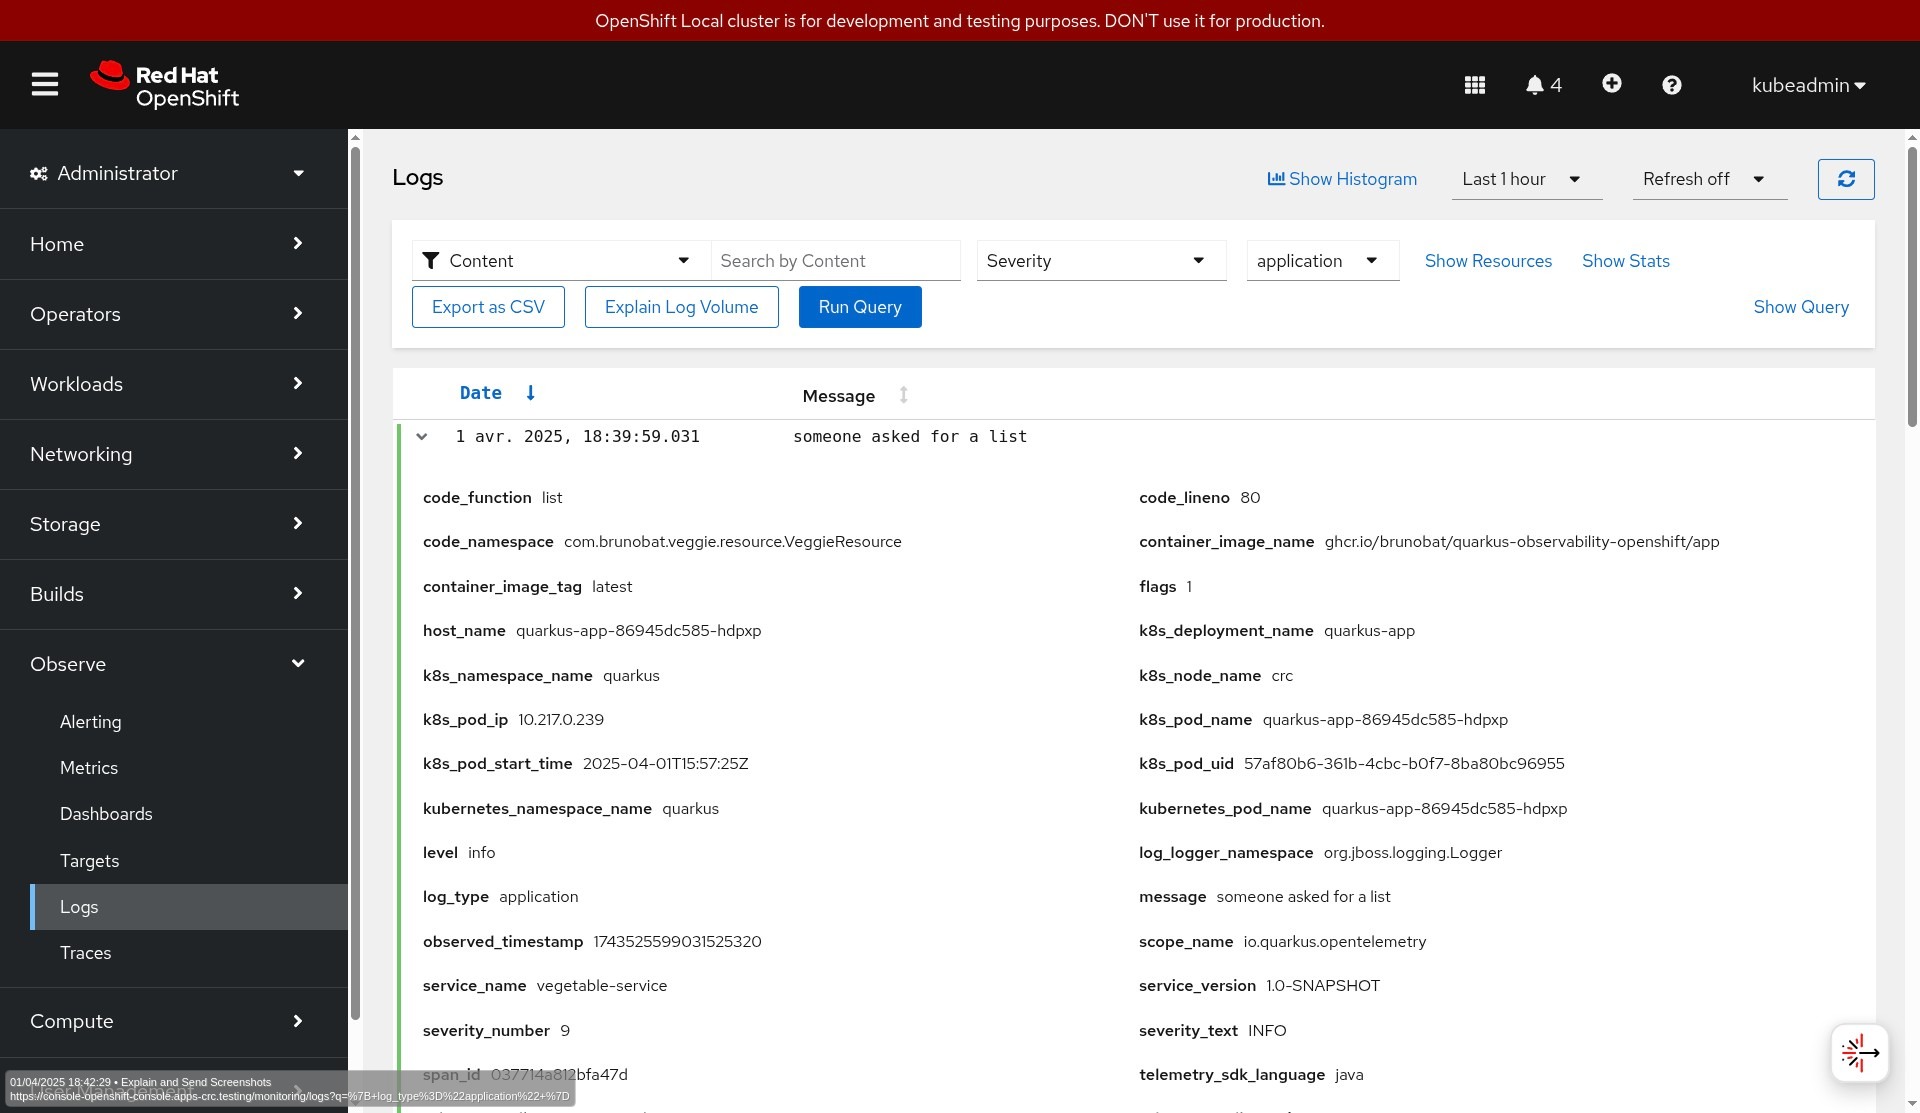
Logs
OpenTelemetry logs will forward the application logs to a central system, in the current case, to the OpenTelemetry Collector. Log lines will be enriched with additional attributes like class, method, line number, thread data, tracing, and span IDs, etc.
Quarkus will automatically forward log data independently of the logging framework you are using (slf4j, jog4j, commons logging, etc.) as long you follow the logging guidelines and use the standard logging adapters.
Image creation
The project includes a GitHub action to build and publish a Docker container image each time a change happens in the repo. The image is based on the standard Dockerfile.jvm file bundled with the project and published in the GitHub registry.
Note that whenever a new project is generated in https://code.quarkus.io/, a set of Dockerfiles, like the one we use, are also included for convenience.
OpenShift deployment steps
In this section, we will deploy the application into an OpenShift cluster and configure it to send telemetry data to an OpenTelemetry collector. We'll store the data in supported trace, metrics, and log storages on OpenShift. You can find all deployment manifest files in this GitHub repository.
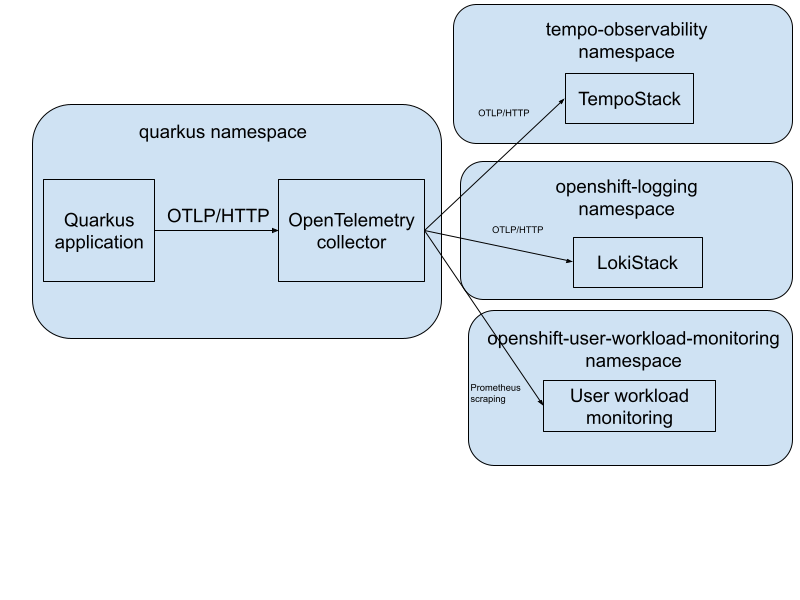
On OpenShift, you can install the OpenTelemetry collector via the Red Hat build of OpenTelemetry operator. You can access the trace storage via the Tempo operator and the log storage via the Loki operator. For storing the metrics, users have two options:
Use the user workload monitoring stack, which is part of the core OpenShift platform.
Deploy a standalone monitoring stack (based on Prometheus) from the cluster observability operator.
Figure 1 depicts a high-level architecture diagram of the observability installation.
First, let’s deploy the application. The following code block shows the deployment manifests for the application. Note the environment variables section to set the exporter endpoint. It configures the app to send all telemetry data to an OpenTelemetry collector via OTLP/HTTP:
kind: Deployment
apiVersion: apps/v1
spec:
  selector:
    matchLabels:
      app: quarkus-app
  template:
    metadata:
      labels:
        app: quarkus-app
    spec:
      containers:
        - name: app
          image:  ghcr.io/brunobat/quarkus-observability-openshift/app:latest
          ports:
            - containerPort: 8080
          env:
            - name: QUARKUS_DATASOURCE_JDBC_URL
              value: jdbc:postgresql://db:5432/test
            - name: QUARKUS_OTEL_EXPORTER_OTLP_ENDPOINT
              value: http://dev-collector.quarkus.svc.cluster.local:4318
Now let’s look at the OpenTelemetry collector custom resource (CR). Configure the collector to enable OTLP receiver which receives the data from the application and exports traces to TempoStack, logs to LokiStack, and metrics to the OpenShift user workload monitoring.
The traces and logs are sent via OTLP/HTTP and the metrics are exposed from the collector via the Prometheus exporter and scraped by the user workload monitoring stack. Before sending the data to the appropriate backend, the collector adds Kubernetes resource attributes (e.g., pod, deployment, and namespace name) via the k8sattributes processor:
apiVersion: opentelemetry.io/v1beta1
kind: OpenTelemetryCollector
spec:
  observability:
    metrics:
      enableMetrics: true
  config:
    extensions:
      bearertokenauth:
        filename: "/var/run/secrets/kubernetes.io/serviceaccount/token"
    receivers:
      otlp:
        protocols:
          grpc: {}
          http: {}
    processors:
      k8sattributes: {}
      batch: {}
      memory_limiter:
        check_interval: 1s
        limit_percentage: 75
        spike_limit_percentage: 25
     exporters:
      debug:
        verbosity: normal
      otlphttp/tempo:
        endpoint: https://tempo-simplest-gateway.tempo-observability.svc.cluster.local:8080/api/traces/v1/dev
        tls:
          insecure: false
          ca_file: "/var/run/secrets/kubernetes.io/serviceaccount/service-ca.crt"
        auth:
          authenticator: bearertokenauth
      otlphttp/loki:
        endpoint: https://logging-loki-gateway-http.openshift-logging.svc.cluster.local:8080/api/logs/v1/application/otlp
        encoding: json
        tls:
          ca_file: "/var/run/secrets/kubernetes.io/serviceaccount/service-ca.crt"
        auth:
          authenticator: bearertokenauth
      prometheus:
        endpoint: 0.0.0.0:8889
        resource_to_telemetry_conversion:
          enabled: true # by default resource attributes are dropped
    service:
      extensions: [bearertokenauth]
      pipelines:
        traces:
          receivers: [otlp, jaeger, zipkin]
          processors: [memory_limiter, k8sattributes, batch]
          exporters: [debug, otlphttp/tempo]
        logs:
          receivers: [otlp]
          processors: [memory_limiter, k8sattributes, resource/loki, transform/loki, batch]
          exporters: [debug, otlphttp/loki]
        metrics:
          receivers: [otlp]
          processors: [memory_limiter, k8sattributes, batch]
          exporters: [debug, prometheus]
Observe the data in OpenShift
The telemetry data on OpenShift is in the OpenShift console in the Observe menu. However, the UI must first be installed via the Cluster Observability operator and its UI plug-in custom resources for traces and logs.
Figures 2, 3, and 4 show how you can visualize the data in the OpenShift UI.
Learn more
In this article, we explained how Quarkus works with OpenTelemetry and how to deploy an observable service on OpenShift. Get started with the Red Hat build of Quarkus. You can also refer to the documentation for the Red Hat build of Quarkus and Red Hat build of OpenTelemetry.