Monitoring systems are usually composed of three layers: a database layer that hosts metrics data, a layer to display the stored metric data graphically in dashboards, and an alerting layer to send out notifications via methods such as email, on-call notification systems, and chat platforms. This article presents an overview of the components used in Red Hat OpenShift's Application Monitoring Operator, how to install them using the Operator, and an example of the Operator in action.
Application monitoring stack components
The OpenShift Application Monitoring Operator used in Red Hat Integration products aims to cover all of those layers by installing a set of tools to build a monitoring system on the cluster. This monitoring stack consists of three famous open source community components that are installed by deploying the Grafana and Prometheus Operators: Grafana, Prometheus, and Alertmanager.
Prometheus
Prometheus is an open source project designed to monitor and provide alerts in a microservices infrastructure. Prometheus supports scraping application instances to collect metrics and generate graphs. These metrics are exposed by services through HTTP(S), and Prometheus periodically scraps target-defined endpoints and writes the collected samples into its database.
This tool comes with a functional query language called PromQL that lets users select and aggregate time series data in real time. The outcome of a query can be exposed as a graph or tabula data, or consumed via the HTTP API.
The Application Monitoring Operator uses the Prometheus Operator to install instances of Prometheus in a simple, declarative way to create, configure, and manage Prometheus instances on the cluster.
Alertmanager
Here is where the alerts sent from Prometheus servers are handled. Alertmanager is responsible for receiving alerts and sending them out to notify the end user. An alerting system is useful to warn about a new problem, allowing teams to take action to prevent major issues or system downtime.
When alerts are sent to Alertmanager, they can be filtered and grouped according to their severity, and then the system decides which action to take—that can either be to go silent or to notify a receiver (email, chat app, calls, etc.).
Grafana
When it comes to monitoring systems, the visualization layer helps teams detect and take action when anomalous behavior occurs. In the Application Monitoring Operator, we use Grafana as the visualization tool to display time series data collected from Prometheus in the dashboard format.
Grafana is installed using the Grafana Operator Custom Resource (CR), which can deploy and manage Grafana instances in the cluster.
Application Monitoring Operator installation
After a brief introduction of each component in the application monitoring stack, let’s see how they all work together by installing the Application Monitoring Operator. The first thing we need is Red Hat OpenShift cluster, which can be provided by installing Minishift on your local machine. For more information about installing Minishift, see Getting Started with Minishift.
Once you have your cluster up and running, you can start deploying the Operator:
- Clone the Operator from the git repository:
$ git clone git@github.com:integr8ly/application-monitoring-operator.git
- Log in to OpenShift with the administrator role (it is required to have admin access to the cluster to create CRDs, ClusterRoles, and ClusterRoleBindings):
$ oc login -u system:admin
- Install the Application Monitoring Operator using Make, which will trigger a shell script to create a new namespace on the cluster, create a new label (
monitoring-key=middleware), and install all of the custom resource definitions required by the stack:$ make cluster/install
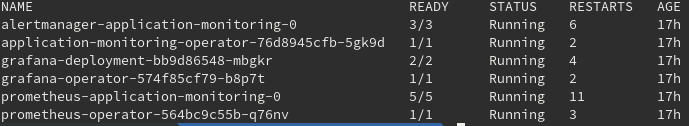
After running Make, all of the components are installed in a new namespace called application-monitoring. To make sure the installation went well, you can check by running the following:
$ oc project
Using project "application-monitoring" on server "https://your-cluster-ip:8443"
$ oc get pods
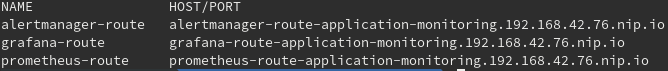
You should be able to access Prometheus, Grafana, and Alertmanager by getting their respective routes:
$ oc get route
To access Openshift via the UI you may need to grant admin permission to users. To do so, run the command below:
$ oc adm policy add-cluster-role-to-user admin "user_name"
Application Monitoring Operator in action
Now that the Application Monitoring Operator is running, let’s create a project to expose metrics to Prometheus. The first thing we need to do is create a new namespace on the cluster to host the project:
$ oc new-project example-prometheus-nodejs
The Application Monitoring Operator uses the Kubernetes labeling system to discover imported custom resources (Prometheus rules, service monitors, Grafana dashboards, etc.):
- Prometheus rules define a set of alert rules in Prometheus.
- Service monitors define how groups of services should be monitored, and the operator automatically configures Prometheus to scrap services according to the definition.
- Grafana dashboard defines dashboards to be reconciled in Grafana.
The label value can be changed on the Application Monitoring CR by changing the property labelSelector. To create a new label called middleware for our new namespace on the cluster, run:
$ oc label namespace example-prometheus-nodejs monitoring-key=middleware
In the project we cloned's repository is a template file that we use to deploy the application, import the CRs (Prometheus rules, service monitors, Grafana dashboards, etc.) that the application monitoring stack detects, and reconcile them.
To deploy the application use the following command:
$ oc process -f https://raw.githubusercontent.com/david-martin/example-prometheus-nodejs/master/template.yaml | oc create -f -
An important thing to notice is that the Custom Resource Definition (CRD) the Grafana dashboard imported does not have the monitoring-key=middleware label required for Grafana to detect and reconcile new dashboards. To add the label, run the following command:
$ oc label grafanadashboard monitoring-key=middleware --all
After this action, we should see a new Grafana UI dashboard showing app memory usage (among other things). You should also see a new Prometheus target in example-prometheus-nodejs/example-prometheus-nodejs, and the new alert role APIHighMedianResponseTime.
