Not long after Podman developed a certain level of stability and functionality we started to hear questions like, “What about container healthchecks?” It was a tough question with no easy, obvious answers. My colleagues and I would occasionally discuss healthchecks, but we are a daemonless environment, which makes this kind of thing challenging. Without a long-running process or daemon to schedule healthchecks, we needed to look at other parts of the operating system to launch them. Recently, the questions grew more pronounced, and it was high time we resolved this for our users.
I am pleased to say that the latest Podman release 1.2 now has the ability to perform container healthchecks. This article describes healthchecks and explains how we implemented them for Podman.
What are healthchecks?
A “healthcheck” is a way in which a user can determine the “health” or readiness of the primary process running inside of a container. It is more than a simple “is my container running?” question. Think of it more like “is my application ready?” So, a healthcheck is really a way to verify that both the container and its applications are responsive.
A healthcheck is made of five basic components:
- Command
- Retries
- Interval
- Start-period
- Timeout
The core of the healthcheck is the command. Podman will execute the command inside the target container and wait for either a "0" or "failure exit" code. For example, if you have a container that runs an Nginx server, your healthcheck command could be something as simple as a curl command successfully connecting to the web port to make sure Nginx is responsive.
The other four components are related to the scheduling of the healthcheck itself. They are optional and have defaults should you choose to not specify values for each one. Retries defines the number of consecutive failed healthchecks that need to occur before the container is marked as “unhealthy.” A successful healthcheck resets the retry counter.
The interval metric describes the time between running the healthcheck command. Determining the interval value is a bit of an art. Make it too small and your system will spend a lot of time running healthchecks; make the interval too large and you struggle with catching time outs. The value is a time duration like “30s” or “1h2m.”
Note: A duration string is a possibly signed sequence of decimal numbers, each with optional fraction and a unit suffix, such as "300ms," "-1.5h," or "2h45m." Valid time units are "ns," "us," (or "µs"), "ms," "s," "m," and "h."
The fourth component is the start-period. This describes the time between when the container starts and when you want to ignore healthcheck failures. Put more simply, if a healthcheck fails during this time, it will not count as a failure. During this time, the container’s healthcheck status will be starting. If a healthcheck returns successfully, the container’s healthcheck status will change from starting to healthy.
The last component is the timeout definition. Like the interval value, it is a time duration. It describes the period of time the healthcheck itself must complete before being considered unsuccessful.
Show me
As of Podman 1.2, you can define a healthcheck as part of container creation using the command-line interface. Suppose you want to define a healthcheck and run that healthcheck manually. Healthchecks currently only run for Podman running as root.
$ sudo podman run -dt --name hc1 --healthcheck-command 'CMD-SHELL curl http://localhost || exit 1' --healthcheck-interval=0 quay.io/libpod/alpine_nginx:latest
d25ee6faaf6e5e12c09e734b1ac675385fe4d4e8b52504dd01a60e1b726e3edb
$ sudo podman healthcheck run hc1
Healthy
$ echo $?
0
On the podman run command, note the use of --healthcheck-command where the healthcheck command itself is defined. Remember that this is a command being run “inside” the container itself. In this case, the curl command needs to be present in the container. Also, notice both the --healthcheck-interval flag and its "0" value. The interval flag defines the time frequency in which to run the healthcheck. The "0" value indicates that we want to run the healthcheck manually.
If you were to provide only the command, the healthcheck would not only be defined but also automatically scheduled with defaults. Podman uses systemd timers to schedule healthcheck runs. If you don’t have systemd, then no automatic scheduling of the healthchecks will occur. You could use different tools like a “cron” job to schedule the healthchecks, but you would have to do this manually.
About image and container types
To really have a strong understanding of healthchecks in Podman, you need to understand there are two predominant image types Podman understands: “docker” and “oci:”. Only Docker image types store healthcheck metadata as part of the image itself. This is described in the healthcheck section of the Docker reference builder. The OCI Image Specification does not include a healthcheck definition. The fact that an OCI image cannot embed or retain the healthcheck metadata actually has resulted in a very flexible approach to defining (and sometimes redefining) healthchecks themselves.
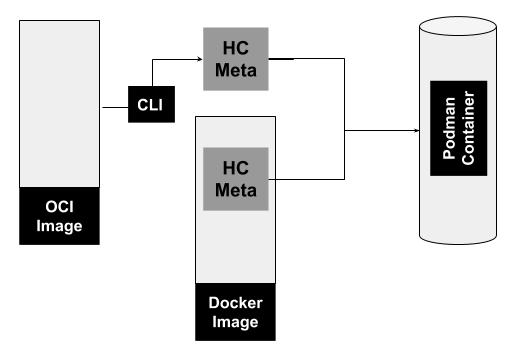
Figure 1: Origin of healthcheck metadata and its path to a Podman container.">
Figure 1 shows the origin of healthcheck metadata and how it becomes part of a Podman container. As mentioned earlier, a Docker image can contain the metadata, and this metadata can be passed onto a Podman container. If the healthcheck defined in a Docker image isn’t sufficient, the metadata of a Docker image can be overridden by the podman CLI. In the case of an OCI image, heathchecks can only be defined with the CLI.
The healthcheck metadata that is defined for a container cannot be “saved” to an OCI image for reuse. The Podman commit command, for example, which allows users to create an image from a Podman image and defaults to an “oci” format; however, you can switch the format to “docker” and the healthcheck will be part of the resulting image.
How healthchecks work in Podman
Podman’s implementation of healthchecks can be categorized in three pieces (as shown in Figure 2):
- Image and container metadata
- Logging
- Scheduling
The first piece is the image and container metadata discussed in the previous section. It is in fact the core piece of healthchecks, and a healthcheck cannot exist without it.
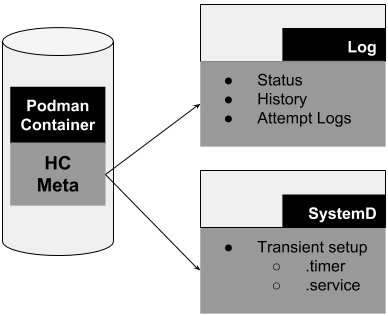
Figure 2: Three main pieces of healthchecks.">
A log file for healthchecks is also created. It retains the container’s health status as well as history including previous healthcheck attempts. And finally, the scheduling is done by systemd. When a container starts and has a healthcheck, Podman performs a transient setup of a .service and .timer file. This simply means that the .service and .timer files are not permanent and can be lost on reboot. In fact, if you stop the same container, the .service and .timer files are removed; the same is true if you manually stop the transient timer or service. As you might have concluded, the .timer file defines the scheduling aspect (intervals) and the .service contains the Podman healthcheck command.
Transient healthcheck timer
The following is an example timer file that Podman created for a container beginning with `81b9…`. This particular container has a 30-second interval defined.
$ cat 81b9da5145f9d2ab3f6ab27e4ec15e95d8975f796be819248f149a617aa3055f.timer
# This is a transient unit file, created programmatically via the systemd API. Do not edit.
[Unit]
Description=/usr/bin/podman healthcheck run 81b9da5145f9d2ab3f6ab27e4ec15e95d8975f796be819248f149a617aa3055f

[Timer]
OnUnitInactiveSec=30s
AccuracySec=1s
RemainAfterElapse=no
Transient healthcheck service
When Podman creates a transient service file, it will look something like the below:
$ cat 81b9da5145f9d2ab3f6ab27e4ec15e95d8975f796be819248f149a617aa3055f.service
# This is a transient unit file, created programmatically via the systemd API. Do not edit.
[Unit]
Description=/usr/bin/podman healthcheck run 81b9da5145f9d2ab3f6ab27e4ec15e95d8975f796be819248f149a617aa3055f

[Service]
ExecStart=
ExecStart=@/usr/bin/podman "/usr/bin/podman" "healthcheck" "run" "81b9da5145f9d2ab3f6ab27e4ec15e95d8975f796be819248f149a617aa3055f"
Note that if your system does not have systemd, you can still use Podman healthchecks. Podman only uses systemd handle healthcheck timing. You could use cron or some other scheduling application. Moreover, you can manually run the healthcheck command using Podman, and the container’s health and logs will be updated accordingly.
Interacting with the results of healthchecks
You can use Podman to interact with healthcheck results and status. The most direct way is using podman inspect on the container. Suppose I create a container running Nginx and define a healthcheck as follows:
$ sudo podman run -dt --name hc --healthcheck-start-period 2m --healthcheck-retries 5 --healthcheck-command "CMD-SHELL curl http://localhost  || exit 1" quay.io/libpod/alpine_nginx:latest
164747229c31eb0214c2aa63997171104e38f93d8aa4d5e315b16679213c078d
With this healthcheck definition, the command runs curl to make sure Nginx is responsive. The retry limit is set to 5 and I provided a two-minute start-period. The interval will default to a value of 30 seconds. After letting the container run a few seconds, we can inspect the container to see both the healthcheck status and later the configuration.
In the output of the inspect command, we can see the healthcheck status is set to healthy and even a log of the curl command that was executed. The start and stop times are also recorded.
$ sudo podman inspect hc
[
    {
        "ID": "164747229c31eb0214c2aa63997171104e38f93d8aa4d5e315b16679213c078d",
        "Created": "2019-03-26T14:27:21.928727195-05:00",
        "Path": "nginx",
        "Args": [
            "-g",
            "daemon off;"
        ],
        "State": {
            "OciVersion": "1.0.1-dev",
            "Status": "running",
            "Running": true,
            "Paused": false,
 ...
            "StartedAt": "2019-03-26T14:27:22.439699271-05:00",
            "FinishedAt": "0001-01-01T00:00:00Z",
            "Healthcheck": {
                "Status": "healthy",
                "FailingStreak": 0,
                "Log": [
                    {
                        "Start": "2019-03-26T14:27:22.597838221-05:00",
                        "End": "2019-03-26T14:27:22.847910361-05:00",
                        "ExitCode": 0,
                        "Output": "  % Total    % Received % Xferd  Average Speed Time    Time     Time  Current\n                                 Dload  Upload  Total Spent    Left  Speed\n\r  0     0    0     0    0     0      0      0 --:--:-- --:--:-- --:--:--     0\r100    12  100    12    0     0  12000      0 --:--:-- --:--:-- --:--:-- 12000\npodman rulez"
                    }
                ]
            }
        },
        "Image": "3ef70f7291f47dfe2b82931a993e16f5a44a0e7a68034c3e0e086d77f5829adc",
        "ImageName": "quay.io/libpod/alpine_nginx:latest",
...
        "Config": {
            ...
            "StopSignal": 15,
            "Healthcheck": {
                "Test": [
                    "CMD-SHELL",
                    "curl",
                    "http://localhost",
                    "],
                "StartPeriod": 120000000000,
                "Interval": 30000000000,
                "Timeout": 30000000000,
                "Retries": 5
            }
        }
    }
]
As part of the podman inspect output, we can also see the healthcheck configuration as container metadata. The field Test refers to the healthcheck command. The start-period, interval, and timeout are converted to milliseconds. And retries is a simple integer.
You can also get a summary view of container healthcheck status by using a filter with the podman ps command.
$ sudo podman ps -a --filter health=healthy
CONTAINER ID  IMAGE                      COMMAND               CREATED         STATUS             PORTS  NAMES
71dac13c36d9  quay.io/libpod/alpine_nginx:latest  nginx -g daemon o... 27 seconds ago  Up 27 seconds ago     hc2
164747229c31  quay.io/libpod/alpine_nginx:latest  nginx -g daemon o... 14 minutes ago  Up 14 minutes ago     hc
When using a filter for health, you may use a value of healthy, starting, or unhealthy.
Wrap-Up
The inclusion of healthchecks in Podman opens some interesting future possibilities. We certainly have entertained the recent addition of events in Podman and the possible interaction between events and things like healthchecks. Another idea is to apply the concept of healthchecks to pods and whether using side-car containers could be an ideal solution. This would allow us to concentrate on the healthcheck at the pod level and even outside the containers themselves. And finally, it could be of great use to associate a restart policy to healthchecks resulting in the ability to actually take action when a container or pod becomes “unhealthy.”
Last updated: May 31, 2023