For developers working on a Kubernetes-based application environment such as Red Hat OpenShift, there are a number things that need to be considered to fully take advantage of the significant benefits provided by these technologies, including:
- How do I communicate with the orchestration layer to indicate the application is operating correctly and is available to receive traffic?
- What happens if the application detects a system fault, and how does the application relay this to the orchestration layer?
- How can I accurately trace traffic flow between my applications in order to identify potential bottlenecks?
- What tools can I use to easily deploy my updated application as part of my standard toolchain?
- What happens if I introduce a network fault between my services, and how do I test this scenario?
These questions are central to building container-native solutions. At Red Hat, we define container-native as applications that conform to the following key tenets:
- DevOps automation
- Single concern principle
- Service discovery
- High observability
- Lifecycle conformance
- Runtime confinement
- Process disposability
- Image immutability
This may seem like a lot of overhead on top of the core application logic. Red Hat OpenShift Application Runtimes (RHOAR) and Istio provide developers with tools to adhere to these principles with minimal overhead in terms of coding and implementation.
In this blog post, we're specifically focusing on how RHOAR and Istio combine to provide tools for DevOps automation, lifecycle conformance, high observability, and runtime confinement.
Note: This article is based on version 0.7 of Istio, which was the latest version at the time of writing. We do not recommend using this version of Istio for production deployments due to some key features still in the alpha/beta state. While Istio is evolving quickly, we think it is important for developers to learn and understand the capabilities to fully take advantage of this technology once it becomes a viable production offering.
Prerequisites
- Red Hat Openshift Container Platform 3.9 (RHOCP) or Minishift Istio build: https://github.com/openshift-istio/origin/releases
occommand-line access to RHOCP with cluster administrator rights- Node.js version 8.6.0
Note: Due to the requirement for administrator rights during the installation phase, Istio is not available on Red Hat OpenShift Online.
Setting Up a RHOAR Project
We're going to start off with the RHOAR health check booster repo:
https://github.com/bucharest-gold/nodejs-health-check-redhat.
Clone this repo with the following command:
$ git clone https://github.com/bucharest-gold/nodejs-health-check-redhat
Change to the nodejs-health-check-redhat folder:
$ cd nodejs-health-check-redhat
Install npm dependencies:
$ npm install
Create a new project in OpenShift called rhoar-istio:
$ oc new-project rhoar-istio
Deploy the RHOAR booster application:
$ npm run openshift
Once the deployment is complete, you should see output like this:
 2018-06-01T14:06:35.037Z INFO build nodejs-health-check-redhat-s2i-1 complete
 2018-06-01T14:06:37.923Z INFO creating deployment configuration nodejs-health-check-redhat
 2018-06-01T14:06:37.927Z INFO creating new route nodejs-health-check-redhat
 2018-06-01T14:06:37.963Z INFO creating new service nodejs-health-check-redhat
 2018-06-01T14:06:38.063Z INFO route host mapping nodejs-health-check-redhat-rhoar.router.default.svc.cluster.local
 2018-06-01T14:06:38.106Z INFO complete
In OpenShift, the application should be deployed and pods should be running, as shown below.
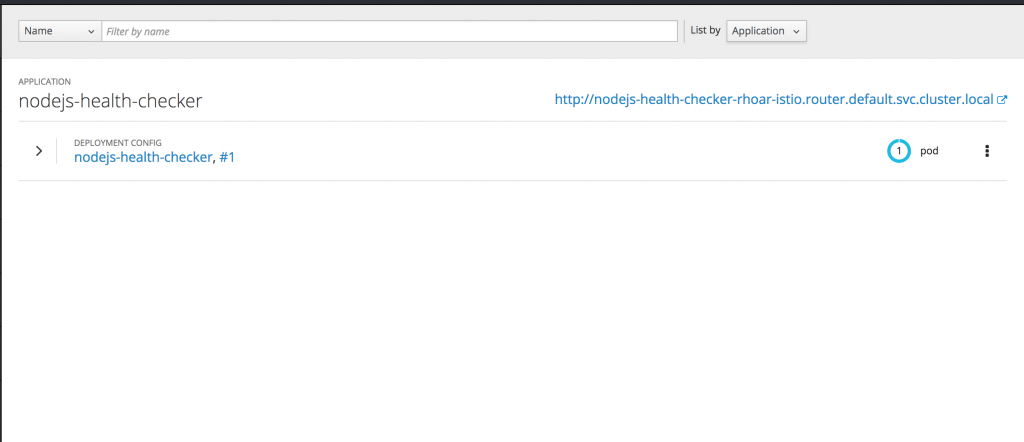
The key thing to note here is the route host mapping URL, which in this case is http://nodejs-health-checker-rhoar-istio.router.default.svc.cluster.local. Once your DNS is configured correctly, you should be able to navigate to this URL and see the following page:
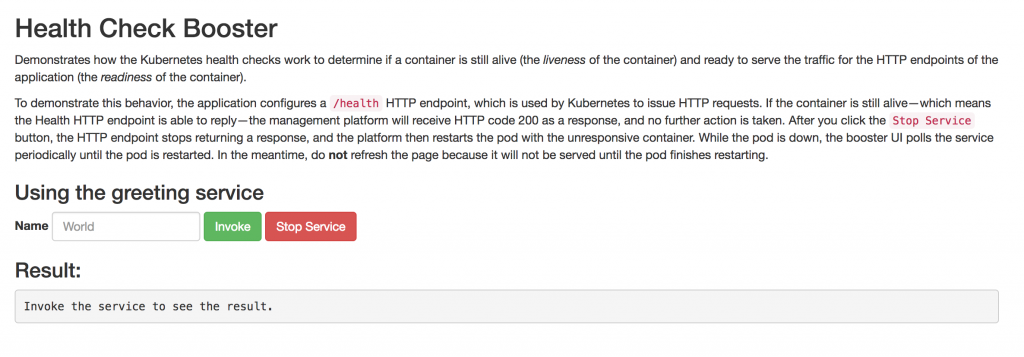
We're going to use this UI shortly to trigger the container to restart.
Let's take a look at the code to see what this booster app is demonstrating.
Looking at app.js, we can see the following, which means that the app is creating an instance of the Express web framework:
const app = express();
The following line means the app is setting the variable isOnline to true on startup:
let isOnline = true;
And the app is defining a custom liveness probe that returns "OK" if isOnline is set to true:
const options = {
	livenessCallback: (request, response) => {
		return isOnline ? response.send('OK') : response.sendStatus(500);
	}
};
The app is defining a route, /api/stop, that allows users to set the value of isOnline to false:
app.use('/api/stop', (request, response) => {
	isOnline = false;
	return response.send('Stopping HTTP server');
});
The app is using the kube-probe npm module to provide readiness and liveness probes:
const probe = require('kube-probe');
The probe module is invoked with the app object (instance of Express):
probe(app, options);
When you look at the pods in the OpenShift console, you should see something like:
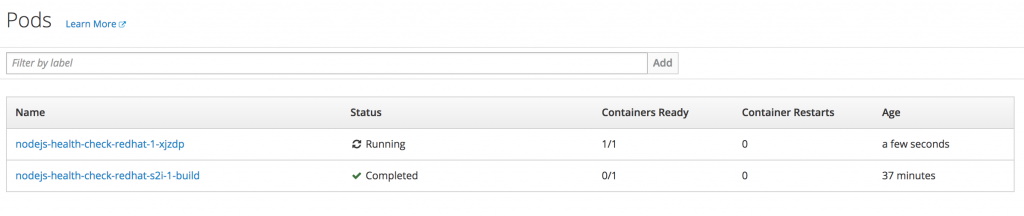
This is showing the readiness probe is correctly informing OpenShift that the container is ready.
From the UI exposed by the route, when you click on the Stop Service button, you should see in OpenShift an indication that OpenShift has detected that the liveness probe has failed and is attempting to restart the container.
So this is pretty cool "out of the box" functionality provided by RHOAR, touching on three of the key principles of container-native design: DevOps automation, lifecycle conformance, and high observability.
Why Use Istio?
The following is taken from the Istio website:
Istio provides a complete solution to satisfy the diverse requirements of microservice applications by providing behavioral insights and operational control over the service mesh as a whole. It provides a number of key capabilities uniformly across a network of services:
Traffic Management. Control the flow of traffic and API calls between services, make calls more reliable, and make the network more robust in the face of adverse conditions.
Service Identity and Security. Provide services in the mesh with a verifiable identity and provide the ability to protect service traffic as it flows over networks of varying degrees of trustability.
Policy Enforcement. Apply organizational policy to the interaction between services, ensure access policies are enforced and resources are fairly distributed among consumers. Policy changes are made by configuring the mesh, not by changing application code.
Telemetry. Gain understanding of the dependencies between services and the nature and flow of traffic between them, providing the ability to quickly identify issues.
In short, introducing Istio to our project will provide a lot of tools around traffic management, monitoring, and fault tolerance providing (among other things) a lot of benefits for the high observability principle.
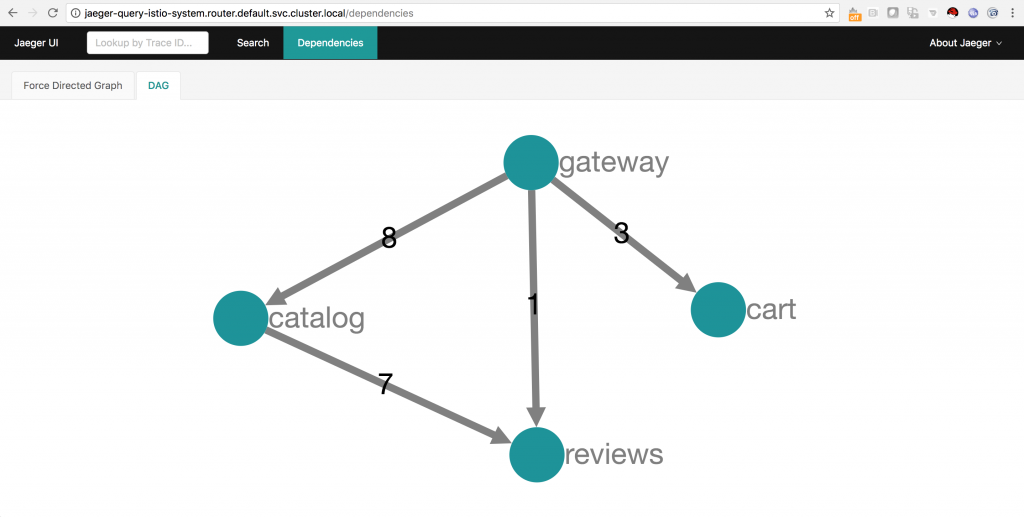
For example, with minimal implementation impact on the part of the developer, Istio will produce tracing information such as this:
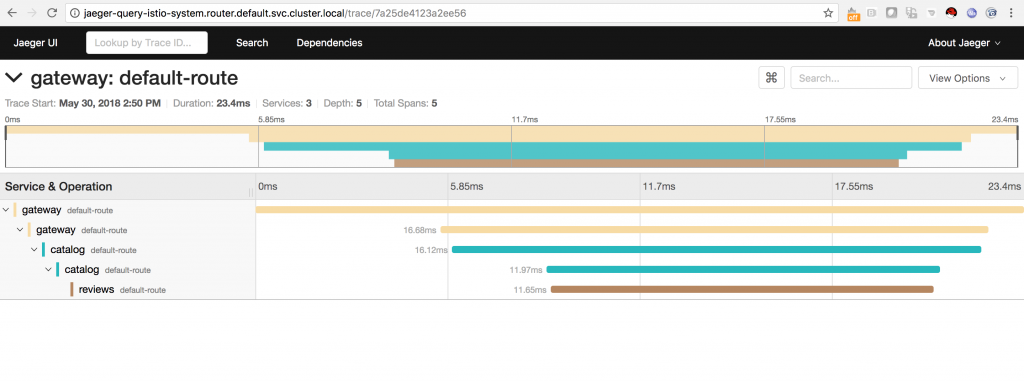
The screenshot above shows the trace of a request hitting three microservices in a service mesh. The screenshot below shows the same mesh in a directed acyclic graph that was also generated by the information recorded by Istio.
Installing Istio
To start off, we'll install Istio using instructions here: https://github.com/openshift-istio/openshift-ansible/blob/istio-3.9-0.7.1/istio/Installation.md
On the master node:
Change to the directory containing the master configuration file (master-config.yaml), for example, /etc/origin/master.
Create a file named master-config.patch with the following contents:
admissionConfig:
 pluginConfig:
  MutatingAdmissionWebhook:
   configuration:
    apiVersion: v1
    disable: false
    kind: DefaultAdmissionConfig
kubernetesMasterConfig:
 controllerArguments:
  cluster-signing-cert-file:
  - ca.crt
  cluster-signing-key-file:
  - ca.key
Run the following commands to patch the master-config.yml file and restart the atomic OpenShift master services:
cp -p master-config.yaml master-config.yaml.prepatch

oc ex config patch master-config.yaml.prepatch -p "$(cat ./master-config.patch)" > master-config.yaml
systemctl restart atomic-openshift-master*
In order to run the Elasticsearch application, it is necessary to make a change to the kernel configuration on each node; this change will be handled through the sysctl service.
Create a file named /etc/sysctl.d/99-elasticsearch.conf with the following contents:
vm.max_map_count = 262144
Execute the following command:
sysctl vm.max_map_count=262144
On a machine with an oc user logged in with cluster-admin rights, clone the openshift-istio repo locally:
$ git clone https://github.com/openshift-istio/openshift-ansible.git

$ cd openshift-ansible/istio
Run the Istio installer template:
$ oc new-app istio_installer_template.yaml --param=OPENSHIFT_ISTIO_MASTER_PUBLIC_URL=<master public url>
Verify the installation:
$ oc get pods -n istio-system -w
You should see a list similar to this:
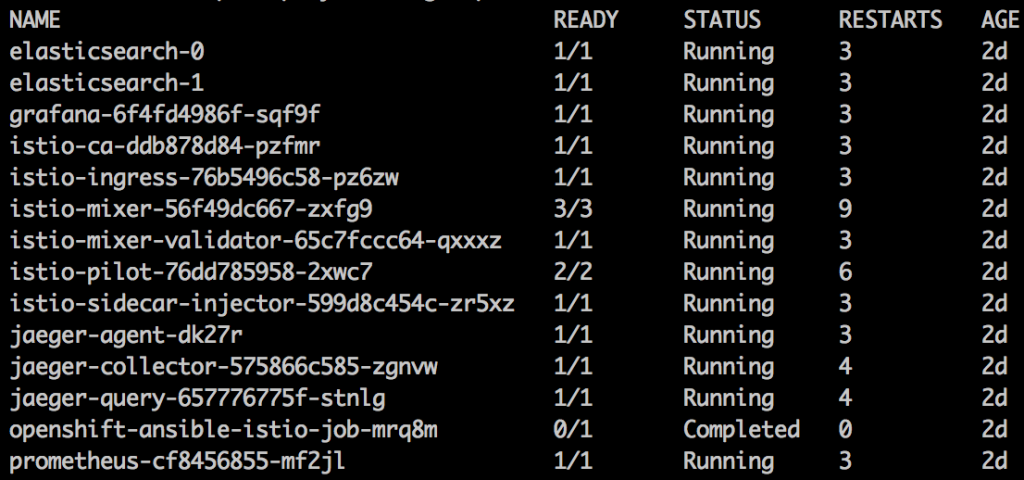
Once all the pods are successfully running, there are a number of new routes created, for example, those shown in the following screenshot:
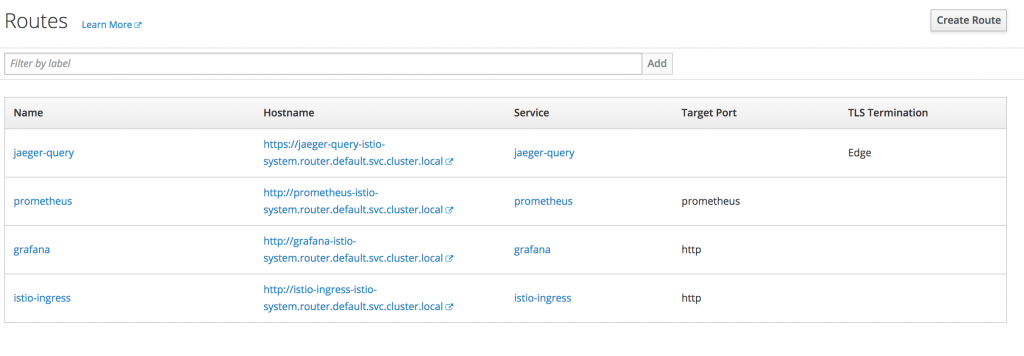
Take some time to look at the interfaces exposed by these routes; there won't be any data at this stage though until we start using our app with an Istio proxy sidecar.
Now that Istio is installed and running, we need to configure our Node.js application deployment to include the Istio proxy sidecar. Istio is configured to add the proxy sidecar to any deployments that include the annotation sidecar.istio.io/inject: "true".
Change the Port the Liveness/Readiness Probes Are Listening On
The Istio sidecar proxy will not operate correctly if the liveness/readiness probes are on the same port as the app routes. To resolve this issue we're going to change the port for the probes in our Node.js app to 3000.
To do this, we add an additional Express web framework instance listening on port 3000 by adding the following to app.js:
const health = express();

…

probe(health, options);
health.listen(3000, function(){
	console.log('App ready, probes listening on port 3000');
})
The full app.js file will now look like this:
const path = require('path');
const express = require('express');
const bodyParser = require('body-parser');
const probe = require('kube-probe');
const app = express();
const health = express();
app.use(bodyParser.json());
app.use(bodyParser.urlencoded({extended: false}));
app.use(express.static(path.join(__dirname, 'public')));
// Expose the license.html at http[s]://[host]:[port]/licences/licenses.html
app.use('/licenses', express.static(path.join(__dirname, 'licenses')));
let isOnline = true;
//
app.use('/api/greeting', (request, response) => {
if (!isOnline) {
	response.status(503);
	return response.send('Not online');
}
const name = request.query ? request.query.name : undefined;
	return response.send({content: `Hello, ${name || 'World!'}`});
});
app.use('/api/stop', (request, response) => {
	isOnline = false;
	return response.send('Stopping HTTP server');
});
const options = {
	livenessCallback: (request, response) => {
		return isOnline ? response.send('OK') : response.sendStatus(500);
	}
};
probe(health, options);
health.listen(3000, function(){
	console.log('App ready, probes listening on port 3000');
})
module.exports = app;
Update the deployment.yml File
We need to make the following changes to the .nodeshift/deployment.yml file. Additions are highlighted in green.
Changes are highlighted in red:
spec:
 template:
  metadata:
   labels:
    app: nodejs-health-check-redhat
    name: nodejs-health-check-redhat
   annotations:
    sidecar.istio.io/inject: "true"
 spec:
  containers:
  - name: nodejs-health-check-redhat
   ports:
   - containerPort: 8080
    protocol: TCP
    name: http
   readinessProbe:
    httpGet:
     path: /api/health/readiness
     port: 3000
     scheme: HTTP
    failureThreshold: 3
    initialDelaySeconds: 10
    periodSeconds: 5
    successThreshold: 1
    timeoutSeconds: 1
   livenessProbe:
    httpGet:
     path: /api/health/liveness
     port: 3000
     scheme: HTTP
    failureThreshold: 2
    initialDelaySeconds: 60
    periodSeconds: 3
    successThreshold: 1
    timeoutSeconds: 1
   resources:
    limits:
    cpu: 200m
    memory: 400Mi
   requests:
    cpu: 100m
    memory: 200Mi
Let's look at these changes individually.
For Istio metrics to correctly identify the application, the template must have an "app" label in metadata:
metadata:
labels:
 app: nodejs-health-check-redhat
 name: nodejs-health-check-redhat
The Istio sidecar injector is configured to add the sidecar proxy to any deployments including the sidecar.istio.io/inject: "true" annotation. So we're adding this under metadata:
annotations:  sidecar.istio.io/inject: "true"
For the data to be logged as HTTP, the container must have a port definition named as http.
- name: nodejs-health-check-redhat
 ports:
 - containerPort: 8080
  protocol: TCP
  name: http
As stated previously, we are changing the probe ports from 8080 to 3000:
readinessProbe:
 httpGet:
  path: /api/health/readiness
  port: 3000
  scheme: HTTP
 failureThreshold: 3
 initialDelaySeconds: 10
 periodSeconds: 5
 successThreshold: 1
 timeoutSeconds: 1
livenessProbe:
 httpGet:
  path: /api/health/liveness
  port: 3000
  scheme: HTTP
 failureThreshold: 2
 initialDelaySeconds: 60
 periodSeconds: 3
 successThreshold: 1
 timeoutSeconds: 1
And finally, we are also adding some resource constraints to communicate to OpenShift the required CPU and memory this container will consume:
resources:
 limits:
  cpu: 200m
  memory: 400Mi
 requests:
  cpu: 100m
  memory: 200Mi
Create a service.yml File
In order for Istio to treat the traffic to our app as HTTP, we need to create a service.yml file in the .nodeshift folder and the file needs to contain the following:
spec:
 ports:
 - name: http
  port: 8080
  protocol: TCP
  targetPort: 8080
Redeploy the Application
First, delete the existing deployment configuration:
$ oc delete dc/nodejs-health-check-redhat

$ oc delete service nodejs-health-check-redhat

$ oc delete route nodejs-health-check-redhat
Run npm run openshift to redeploy the application.
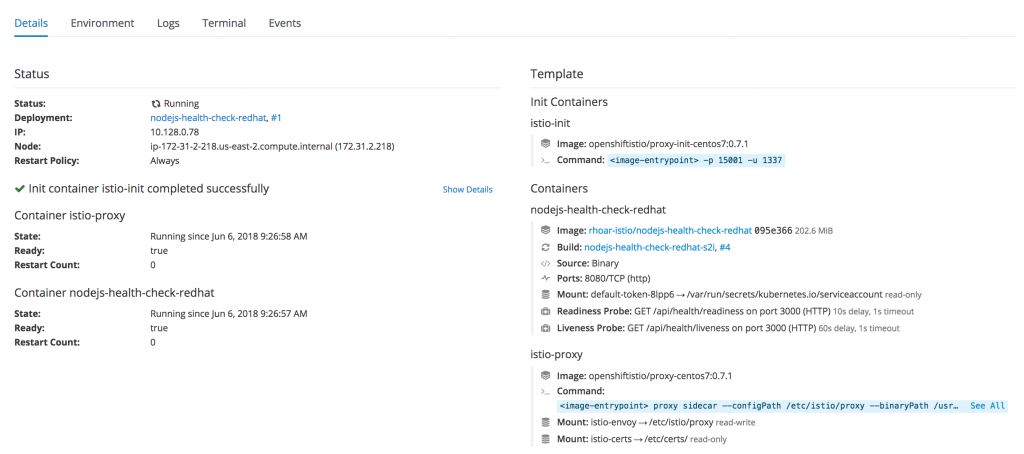
Once the deployment is complete, you should see the following in the OpenShift console:
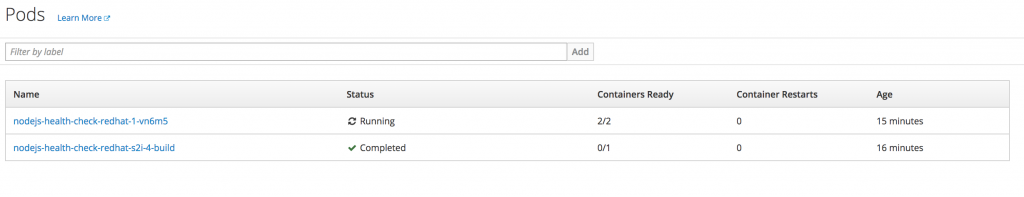
Note: The screenshot above is showing there are now two containers ready (2/2) in the nodejs-health-check-redhat pod, which indicates the Istio sidecar proxy is running alongside the app container.
When you click on the running pod, you should see the list of containers as follows:
Navigate to the UI route, for example, http://nodejs-health-check-redhat-rhoar.router.default.svc.cluster.local/, and perform a number of requests. It is also worth clicking the Stop Service button to test how Istio handles the service being unavailable.
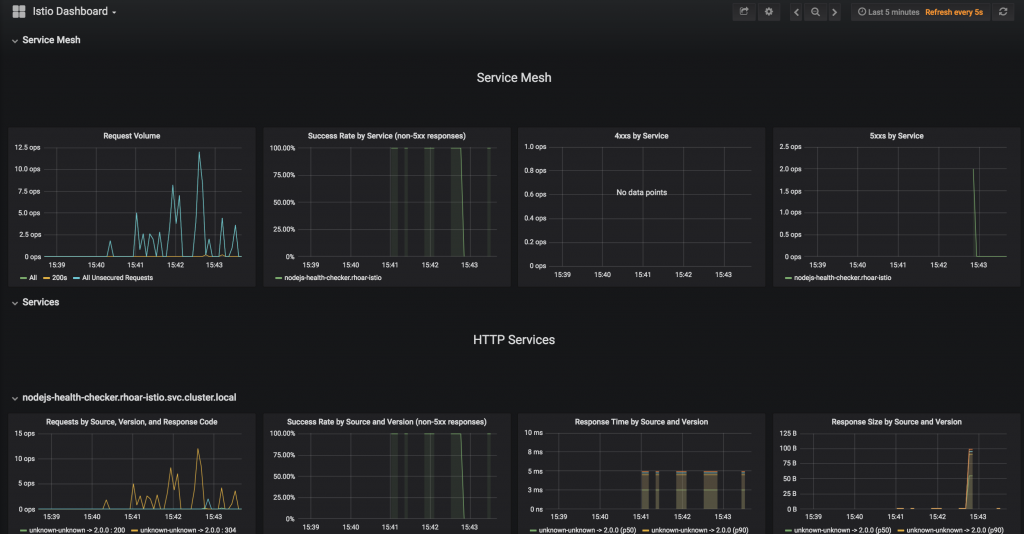
Check the Results in Istio
If you now look at the grafana route we created in the istio-system project, you should see something like the screenshot below, which clearly shows the traffic to our application with response times, failure, and success rates.
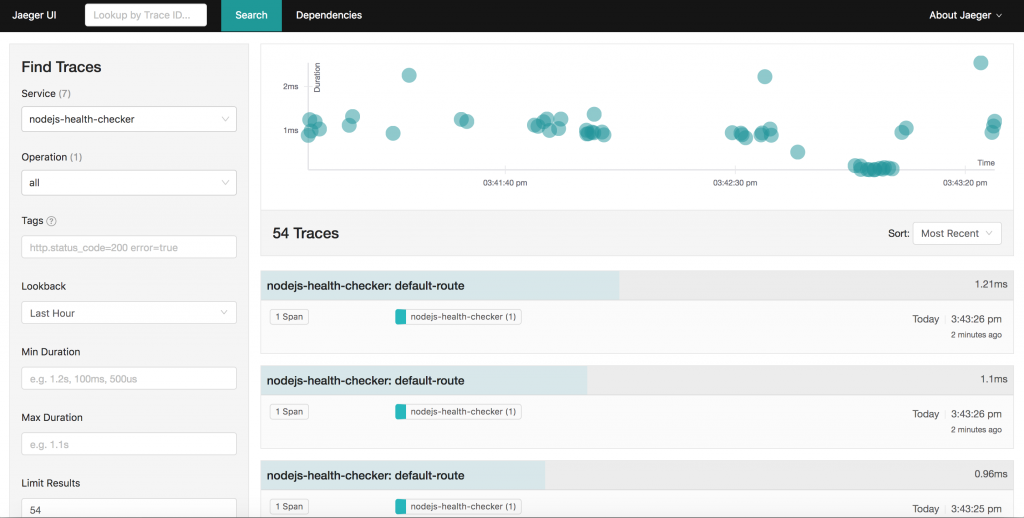
Looking at the Jaeger console, you should also see a significant amount of activity, for example:
Summing Up
Building container-based solutions can seem like a challenging task that adds a lot of overhead for application developers. Using a combination of RHOAR and Istio will take care of a lot of these considerations, leaving application developers to focus on implementing the business logic.
These tools make it a lot easier for developers to control the deployment of their application to OpenShift, interact with the service orchestration framework, monitor the performance of their application, understand how the application relates to other applications (service mesh), and also introduce and test system faults. Developers don't need to learn how to containerize their application or implement any metrics or tracing tools at the application level; this is all provided with minimal configuration.
Last updated: January 12, 2024