Many developers are (or should be) aware that Java processes running inside Linux containers (docker, rkt, runC, lxcfs, etc) don't behave as expected when we let the JVM ergonomics set the default values for the garbage collector, heap size, and runtime compiler. When we execute a Java application without any tuning parameter like "java -jar mypplication-fat.jar", the JVM will adjust by itself several parameters to have the best performance in the execution environment.
This blog post takes a straightforward approach to show developers what they should know when packaging their Java applications inside Linux containers.
We tend to think that containers are just like Virtual Machines where we can completely define a number of virtual CPUs and virtual memory. Containers are more similar to isolation mechanisms where the resources (CPU, memory, filesystem, network, etc.) for one process are isolated from another. This isolation is possible due to a Linux kernel feature called cgroups.
However, some applications that collect information from the execution environment have been implemented before the existence of cgroups. Tools like 'top', 'free', 'ps', and even the JVM are not optimized for executing inside a container, a highly-constrained Linux process. Let's check it out.
The problem
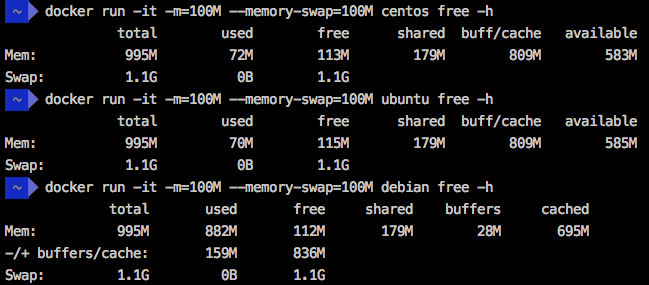
For demonstration purposes, I've created a docker daemon in a virtual machine with 1GB of RAM using "docker-machine create -d virtualbox --virtualbox-memory '1024' docker1024". Next, I executed the command "free -h" in three different Linux distributions running in a container with 100MB of RAM and Swap as a limit. The result is that all of them show 995MB of total memory.
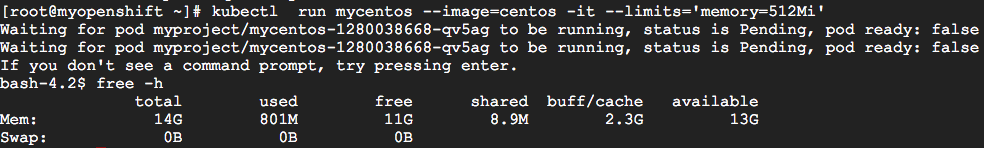
Even in a Kubernetes/OpenShift cluster, the result is similar. I've executed a Kubernetes Pod with a memory limit of 512MB (using the command "kubectl run mycentos --image=centos -it --limits='memory=512Mi'") in a cluster with 15GB of RAM and the total memory shown was 14GB.
To understand why this happen, I suggest that you read the blog post "Memory inside Linux containers - Or why don’t free and top work in a Linux container?" from my fellow Brazilian compatriot, Fabio Kung.
We need to understand that the docker switches (-m, --memory and --memory-swap) and the Kubernetes switch (--limits) instruct the Linux kernel to kill the process if it tries to exceed the specified limit, but the JVM is completely unaware of the limits and when it exceeds the limits, bad things happen!
To simulate the process being killed after exceeding the specified memory limit, we can execute the WildFly Application Server in a container with 50MB of memory limit through the command "docker run -it --name mywildfly -m=50m jboss/wildfly". During the execution of this container, we could execute "docker stats" to check the container limit.

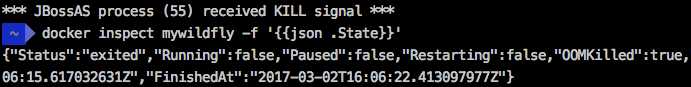
But after some seconds, the Wildfly container execution will be interrupted and print a message: *** JBossAS process (55) received KILL signal ***
The command "docker inspect mywildfly -f '{{json .State}}'" shows that this container has been killed because of an OOM (Out of Memory) situation. Note the OOMKilled=true in the container "state".
How this affects Java applications?
On the docker daemon running on a machine with 1GB of RAM (previously created with "docker-machine create -d virtualbox --virtualbox-memory '1024' docker1024") but having the container memory restricted to 150 megabytes, which seems to be enough for this Spring Boot application, a java application has been started with the parameter -XX:+PrintFlagsFinal defined in the Dockerfile. This parameter allows us to read the initial JVM ergonomics parameters.
Let's try it:
$ docker run -it --rm --name mycontainer150 -p 8080:8080 -m 150M rafabene/java-container:openjdk
I have prepared an endpoint at "/api/memory/" that loads the JVM memory with String objects to simulate operations that consume a lot of memory. Let's invoke it once:
$ curl http://`docker-machine ip docker1024`:8080/api/memory
This endpoint will reply with something like "Allocated more than 80% (219.8 MiB) of the max allowed JVM memory size (241.7 MiB)"
Here we can extract at least two questions:
- Why is the JVM maximum allowed memory 241.7 MiB?
- If this container restricts the memory to 150MB, why does it allow Java to allocate almost 220MB?
First, we need to recall what the JVM 9 ergonomic page says about "maximum heap size". It says that it will be 1/4 of the physical memory. Since the JVM doesn't know that it's executing inside a container, it will allow the maximum heap size to be close to 260MB. Given that we added the flag -XX:+PrintFlagsFinal during the initialization of the container, we can check this value:
$ docker logs mycontainer150|grep -i MaxHeapSize
uintx MaxHeapSize := 262144000 {product}
Second, we need to understand that when we use the parameter "-m 150M" in the docker command line, the docker daemon will limit 150M in the RAM and 150M in the Swap. As a result, the process can allocate the 300M and it explains why our process didn't receive any kill from the Kernel.
More combinations between the memory limit (--memory) and swap (--memory-swap) in docker command line can be found here.
Is more memory the solution?
Developers that don't understand the problem, tend to think that the environment doesn't provide enough memory for the execution of the JVM. A frequent solution is to provision an environment with more memory, but it will, in fact, make things worse.
Let's suppose that we change our daemon from 1GB to 8GB (created with "docker-machine create -d virtualbox --virtualbox-memory '8192' docker8192"), and our container from 150M to 600M:
$ docker run -it --name mycontainer -p 8080:8080 -m 600M rafabene/java-container:openjdk
Note that the command "curl http://`docker-machine ip docker8192`:8080/api/memory" doesn't even complete this time because the calculated MaxHeapSize for the JVM in an 8GB environment is 2092957696 bytes (~ 2GB). Check with "docker logs mycontainer|grep -i MaxHeapSize" by yourself.

The application will try to allocate more than 1.2GB of memory, which is more than the limit of this container (600MB in RAM + 600MB in Swap) and the process will be killed.
It's clear that increasing the memory and letting the JVM set its own parameters is not always a good idea when running inside containers. When running a Java application inside containers, we should set the maximum heap size (-Xmx parameter) ourselves based on the application needs and the container limits.
What is the solution?
A slight change in the Dockerfile allows the user to specify an environment variable that defines extra parameters for the JVM. Check the following line:
CMD java -XX:+PrintFlagsFinal $JAVA_OPTIONS -jar java-container.jar
Now we can use the JAVA_OPTIONS environment variable to inform the size of the JVM Heap. 300MB seems to be enough for this application. Later you can check the logs and get the value of 314572800 bytes ( 300MBi)
For docker, you can specify the environment variable using the "-e" switch.
$ docker run -d --name mycontainer8g -p 8080:8080 -m 600M -e JAVA_OPTIONS='-Xmx300m' rafabene/java-container:openjdk-env

$ docker logs mycontainer8g|grep -i MaxHeapSize
uintx    MaxHeapSize := 314572800       {product}
In Kubernetes you can set the environment variable using the switch "--env=[key=value]":
$ kubectl run mycontainer --image=rafabene/java-container:openjdk-env --limits='memory=600Mi' --env="JAVA_OPTIONS=-Xmx300m"

$ kubectl logs $(kubectl get pods|grep mycontainer|awk '{ print $1 }'|head -1)|grep MaxHeapSize
uintx     MaxHeapSize := 314572800     {product}
Can it get better?
What if the value of the Heap could be calculated based on the container restriction automatically?
This is actually possible if you use a base Docker image provided by the Fabric8 community. The image fabric8/java-jboss-openjdk8-jdk uses a script that calculates the container restriction and uses 50% of the available memory as an upper boundary. Note that this memory ratio of 50% can be overwritten. You can also use this image to enable/disable debugging, diagnostics, and much more. Let's see how a Dockerfile for this Spring Boot application looks like:
FROM fabric8/java-jboss-openjdk8-jdk:1.4.0

ENV JAVA_APP_JAR java-container.jar
ENV AB_OFF true

EXPOSE 8080

ADD target/$JAVA_APP_JAR /deployments/
Done! Now, no matter what the container memory limit is, our Java application will always adjust the heap size according to the container and not according to the daemon.


Updated on March 15th 2018
From JDK 8u131+ and JDK 9, there's an experimental VM option that allows the JVM ergonomics to read the memory values from CGgroups. To enable it on, you must explicit set the parameters -XX:+UnlockExperimentalVMOptions and -XX:+UseCGroupMemoryLimitForHeap on the JVM. You can see it in action on the following Dockerfile.
Let's see how this option behaves. Execute:
$ docker run -d --name mycontainer8g-jdk9 -p 8080:8080 -m 600M rafabene/java-container:openjdk-cgroup

$ docker logs mycontainer8g-jdk9|grep MaxHeapSize
size_t MaxHeapSize = 157286400 {product} {ergonomic}
The JVM read that the container is limited to 600M and created a JVM with maximum heap size of ~150MB. Exactly 1/4 of the container memory as defined in the JDK ergonomic page.
You can also read more about OpenJDK and containers on the excellent blog post from Christine Flood: https://developers.redhat.com/blog/2017/04/04/openjdk-and-containers/#more-433899
Updated on April 21st 2018
Java 10 was released and it now has all the improvements needed to run inside a container. Because of these improvements, the flags -XX:+UnlockExperimentalVMOptions and -XX:+UseCGroupMemoryLimitForHeap aren't needed anymore. In fact, you try to execute the JDK 10 with those parameters enabled, you will see the following warning: "Option UseCGroupMemoryLimitForHeap was deprecated in version 10.0 and will likely be removed in a future release."
Because of that, the Dockerfile for JDK10 doesn't need any extra flags, and/or even any manual and special ergonomics configuration.
Execute the application using the JDK 10 image:
$ docker run -it --name mycontainer -p 8080:8080 -m 600M rafabene/java-container:openjdk10
Note that the command "curl http://`docker-machine ip docker8192`:8080/api/memory" doesn't fail anymore and you see the following message "Allocated more than 80% (145.0 MiB) of the max allowed JVM memory size (145.0 MiB)%". 145MB is 1/4 of the 600M limits that we defined for this container.

Conclusion
The Java JVM until now doesn't didn't provide support to understand that it's was running inside a container and that it has some resources like those that are memory and CPU restricted. Because of that, you can't let the JVM ergonomics take the decision by itself regarding the maximum heap size.
One way to solve this problem is using the Fabric8 Base image that is capable of understanding that it is running inside a restricted container and it will automatically adjust the maximum heap size if you haven't done it yourself. Another solution is to use an experimental option that can be enabled through the parameter -XX:+UseCGroupMemoryLimitForHeap that has been included in JDK8u131 and JDK9 to support cgroup memory limits in container (i.e. Docker) environments.
This blog post covers how the JVM blows up from the memory perspective. To continue following me in the research about the JVM behavior regarding the CPU in a future blog post, register now in the Red Hat Developers Program. Download the CDK and give these options a try yourself.
Last updated: February 24, 2025